

My chart is empty or shows an error
A chart that shows nothing is either empty (the query ran and returned no rows) or failed (the query could not run or returned an error). The two have different fixes, so tell them apart first, then work through the causes below. Each cause follows the same shape: what it means, likely causes, and how to fix it.
Before you start: open the chart that is wrong and note the exact words it shows, if any. If it says Oops, something went wrong, skip to The Oops message. Most fixes below need edit rights on the app or its semantic layer. If you can only view the app, start with If you can only view the app.
Tell empty from failed
Section titled “Tell empty from failed”| You see | It means | Start with |
|---|---|---|
| A blank chart that has finished loading, with no marks and no message | Usually the query ran and found no rows | Filters or selections, then The chart’s own definition |
| “No data for the current filters.” | The query ran and found no rows | Filters or selections |
| “This chart could not be loaded.” | The query failed, or the chart refers to a field that is gone | A field is missing and Connection or warehouse errors |
| “Still loading.” in a strip along the bottom of the chart | The chart is slow, not broken | Wait, then select Retry if it is offered. If it keeps coming back, ask the app’s author to work through Query performance |
| An Oops, something went wrong toast | Your data warehouse sent back an error | The Oops message |
Expect a blank chart, not a message. A standard chart in a Data App built with App Builder cannot report that it returned no rows, so when its query finds nothing it usually stays blank. “No data for the current filters.” appears only on figures that the app draws from its own queries, and only where the app’s author added it. The quoted messages are the wording that Object states specifies for Data Apps. An app built by someone else may word them differently, and Clear filters or Retry appear only where the app’s author added them.
If you can only view the app
Section titled “If you can only view the app”Without edit rights you cannot open the app in App Builder or change its semantic layer, so the fixes below are for the people who own them. Find out who they are:
-
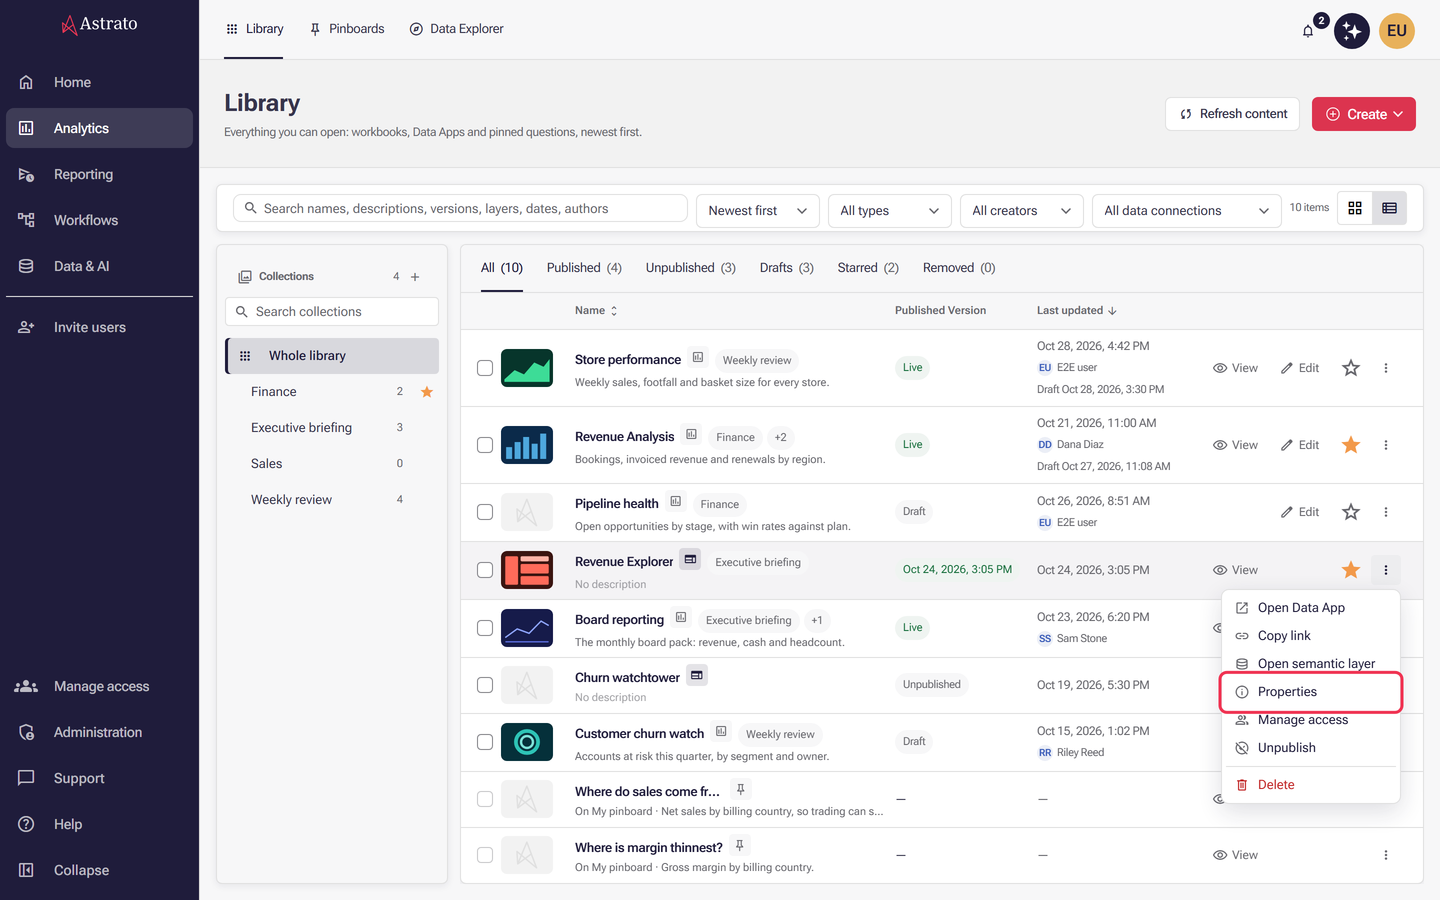
Open Analytics → Library and find the app.
-
Select the three-dot menu at the end of its row, then Properties.
-
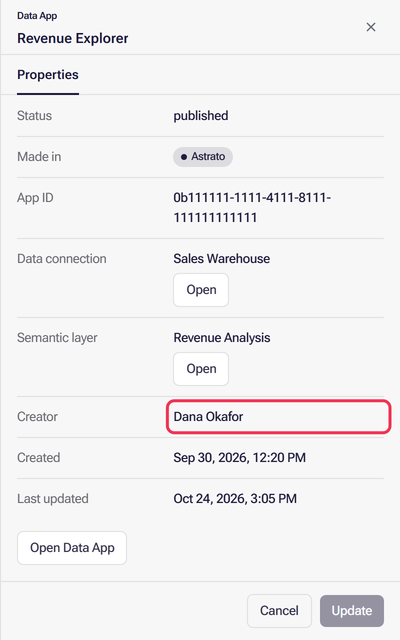
Read the Creator row for who made the app, and the Semantic layer and Data connection rows for the data it reads.
-
Send the app’s creator the chart’s name, what it shows, and the filters and selections you had applied. Before you do, check the two causes you can rule out yourself: Filters or selections and You do not have access.
You are done when: the app’s creator has the details, or one of those two checks fixed it.
Filters or selections exclude every row
Section titled “Filters or selections exclude every row”What it means: the chart works, but the filters and selections applied to it leave no rows.
Likely causes:
- Filters on the page, or a selection made on another chart, combine so that no row matches all of them.
- The chart has its own filter that never matches. See The chart’s own filter, measure or aggregation is wrong.
- A text filter was typed with different spelling or case than the data.
How to fix it:
- Select Clear filters if the chart offers it. Otherwise remove the filters and selections on the page one at a time.
- If the chart fills in again, add the filters back one by one until it empties. The last one you added is the cause.
- Compare that filter’s value with the real values in the field.
You are done when: the chart shows marks again.
The chart’s own filter, measure or aggregation is wrong
Section titled “The chart’s own filter, measure or aggregation is wrong”What it means: the chart’s definition decides what it asks for: the measures and the aggregation each one uses, and any filter that belongs to the chart itself. Page filters cannot undo these, so a chart can stay blank, or show the wrong numbers, while every other chart on the page is fine.
Likely causes:
- The chart filters on a value that is not in the data, for example a region that was renamed.
- The chart uses a different measure than the one you expected, or an aggregation such as a count where a sum was meant.
- Part of the chart’s definition was refused, so the chart draws without it.
How to fix it:
-
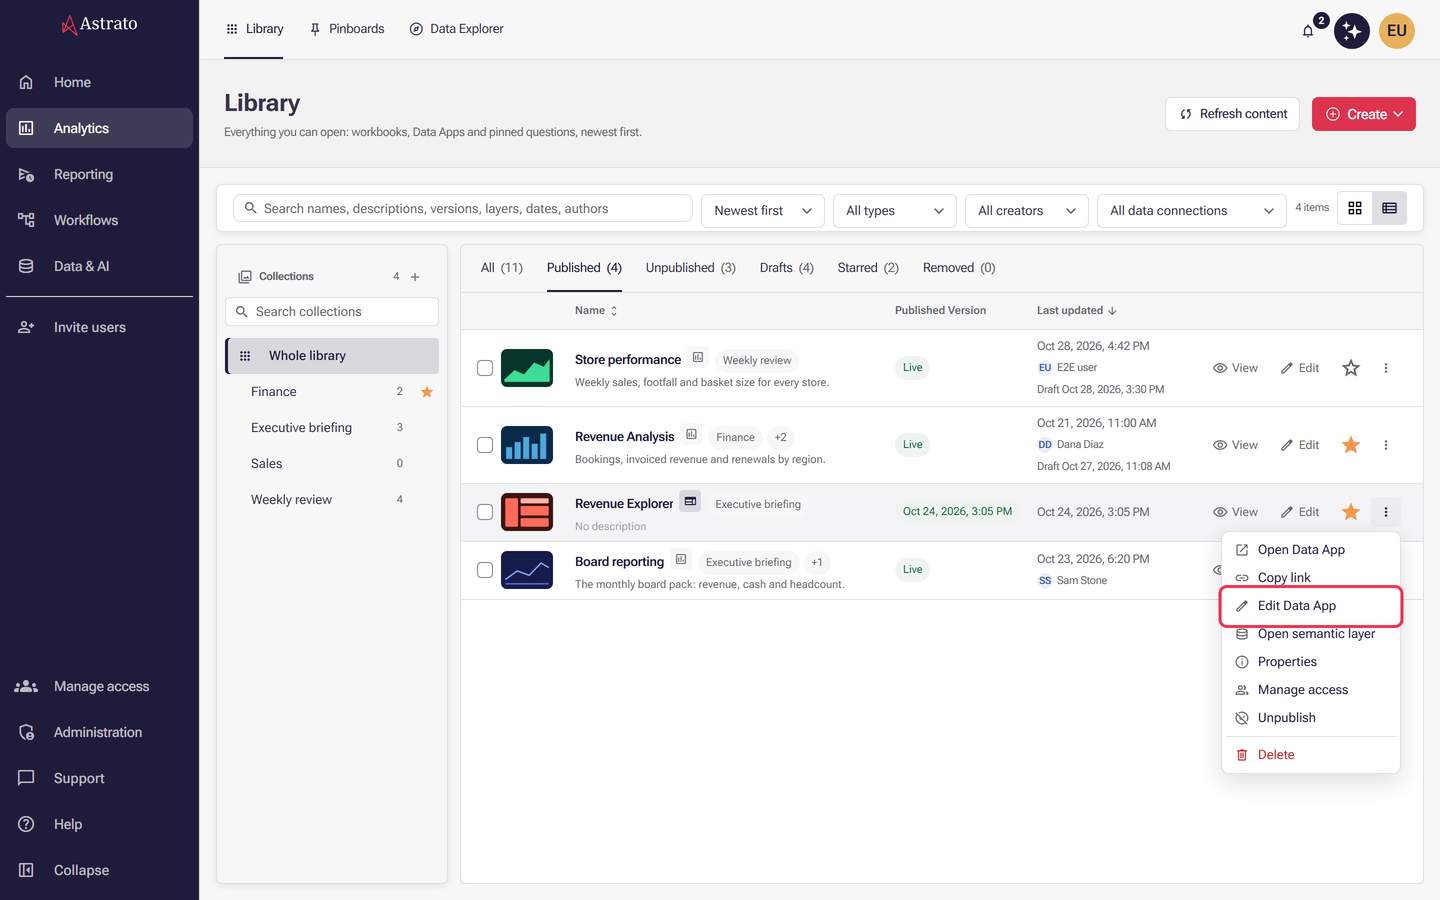
Open Analytics → Library, select the three-dot menu at the end of the app’s row, then Edit Data App. The item is there only when App Builder is enabled, you can manage the app, and the app was made in App Builder. A draft that was never published opens in App Builder when you select its row.
-
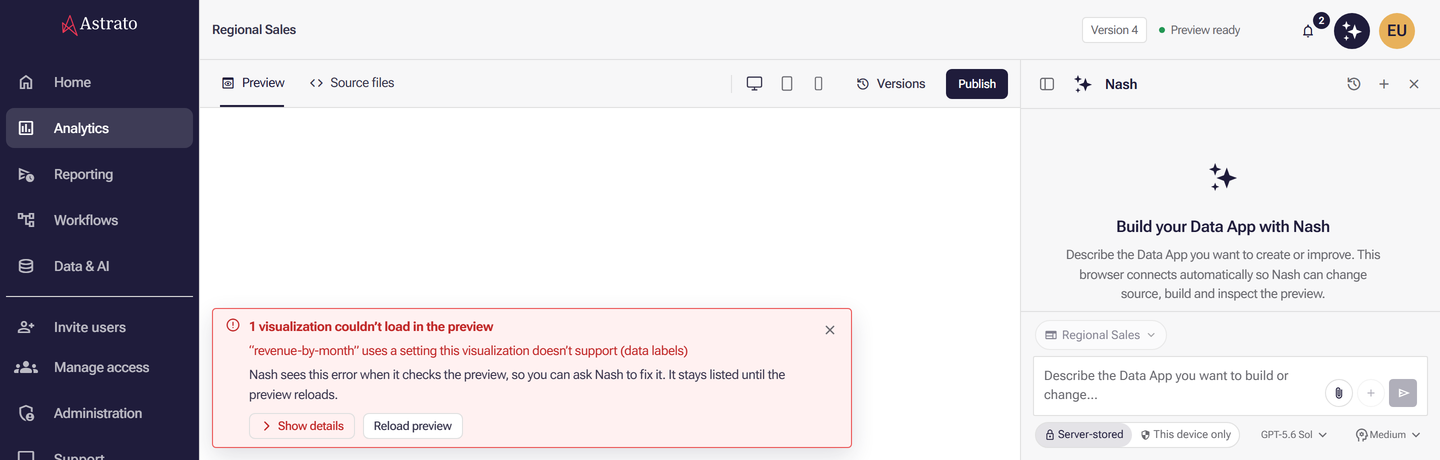
With Preview selected, check that the chart is blank there too. If a notice appears at the bottom of the preview, select Show details to read the errors the app reported, for example a visualization that uses a setting it does not support.
-
Ask Nash what the chart is built from, for example:
Which measures, aggregations and filters does the Revenue by month chart use? List any filter that belongs to the chart itself.
To read it yourself, select Source files and open the file that defines the chart. Its definition lists each measure with its field and
aggregation, and any static filters. -
Ask Nash to change what is wrong, for example “Remove the chart’s own filter on Region” or “Use Sum of Revenue instead of Count”. Nash builds a new preview and checks it.
-
When the chart shows the data you expect, select Publish at the right end of the toolbar. See Publishing from App Builder.

You are done when: the chart shows marks in Preview, and in the published app after you reload the browser page.
The semantic layer was never published
Section titled “The semantic layer was never published”What it means: MCP queries and Data Preview read the published semantic layer, not your draft. A dimension or measure you only saved is not there for them yet.
Likely causes:
- You added or changed a dimension or measure and did not select Publish.
- Publish is greyed out because the layer has validation issues.
How to fix it:
-
Open the semantic layer in the editor.
-
If Publish is available, select it.
-
If Publish is greyed out, hover it to read what holds it up, then select Issues. Rows marked Blocks publishing must be cleared first. See Publish your changes.
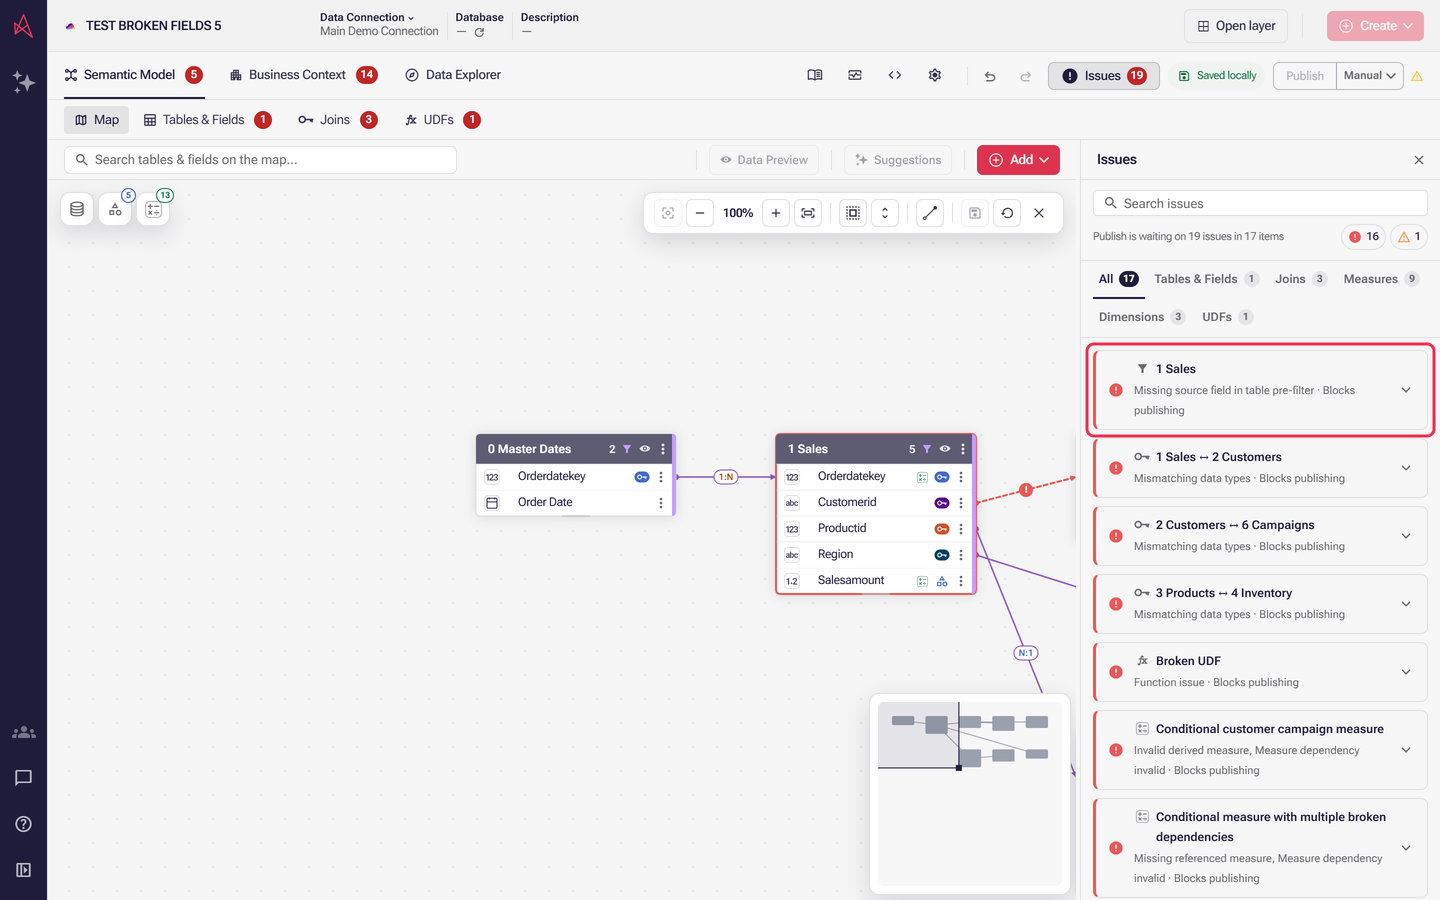
You are done when: the layer is published and the chart shows your data after you reload it: reload the browser page, in App Builder or in the published app. Publishing releases your changes to everyone who uses the layer, so confirm with the layer’s owner if it is not yours.
A period default excludes your dates
Section titled “A period default excludes your dates”What it means: a period axis is read as of today unless its periodEnd says otherwise. If your
data stops before today, every relative period, such as “current year” or “last 30 days”, is empty.
Likely causes:
- The data is a sample, a historical extract or a feed that stopped.
- The chosen period has not started yet.
How to fix it:
-
Find the latest date in the data. Data Preview in the editor’s Map View shows a sample of rows, so the latest date may not be among them; if you are unsure, ask the layer’s author to check it in the warehouse.
-
If the data ends before today, ask the layer’s author to open the time intelligence axis in Business Context → Dimensions and set Period as of to Latest date in data (
periodEnd: latest). Period as of appears only where the chosen period can end on more than one date. See Create a time intelligence axis.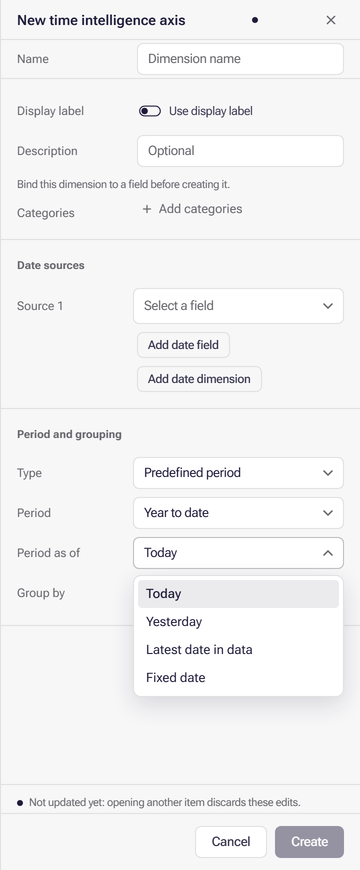
-
Otherwise, choose a period that contains dates present in the data.
See The date a period is read as of.
You are done when: the chart shows rows for a period you know the data covers.
You do not have access to the rows or the data
Section titled “You do not have access to the rows or the data”What it means: access is checked when the query runs, so two people can open the same chart and see different numbers, or one of them nothing.
Likely causes:
- A security rule on a table compares a field with the email address or groups of the person asking, and no row matches yours.
- You cannot read the semantic layer. It then shows that it is unavailable and offers Request access.
How to fix it:
- Ask a colleague with different access whether they see rows. If they do, the cause is access.
- Where the layer offers Request access, add a reason and select it. See Review permission requests.
- If the layer opens but returns no rows for you, ask its owner to check the security rules and your group membership. See Manage groups and assignment rules.
You are done when: you see rows, or the owner confirms the rules intentionally give you none.
A field is missing or was renamed
Section titled “A field is missing or was renamed”What it means: the chart refers to a dimension, a measure or a database column that no longer exists under that name.
Likely causes:
- A dimension or measure was renamed or removed in the semantic layer.
- A table or column was changed or dropped in your database. Astrato marks a confirmed missing object as missing and blocks publishing until what uses it is repaired.
How to fix it:
-
In the editor, select Issues and look for the field’s name.
-
Select Open on the issue to jump to the affected item, then restore or repair it.
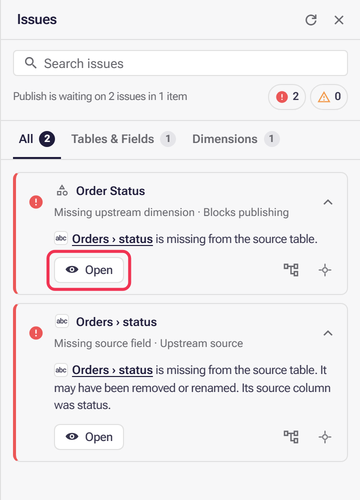
-
Publish, then reload the chart: reload the browser page, in App Builder or in the published app.
See When your database schema changes and Semantic layer issues.
You are done when: the chart loads without “This chart could not be loaded.”
Connection or warehouse errors
Section titled “Connection or warehouse errors”What it means: Astrato could not get an answer from your data source.
Likely causes:
- The data connection’s credentials expired or were changed.
- The warehouse is paused, busy or refused the query.
How to fix it:
-
Open Data & AI → Data Connections and open the connection the layer uses.
-
Enter the current credentials. The saved password or key is not shown, so type a replacement. Validate Connection appears once you change a credential or setting.
-
Select Validate Connection. When it succeeds, select Save changes. See Data connections.
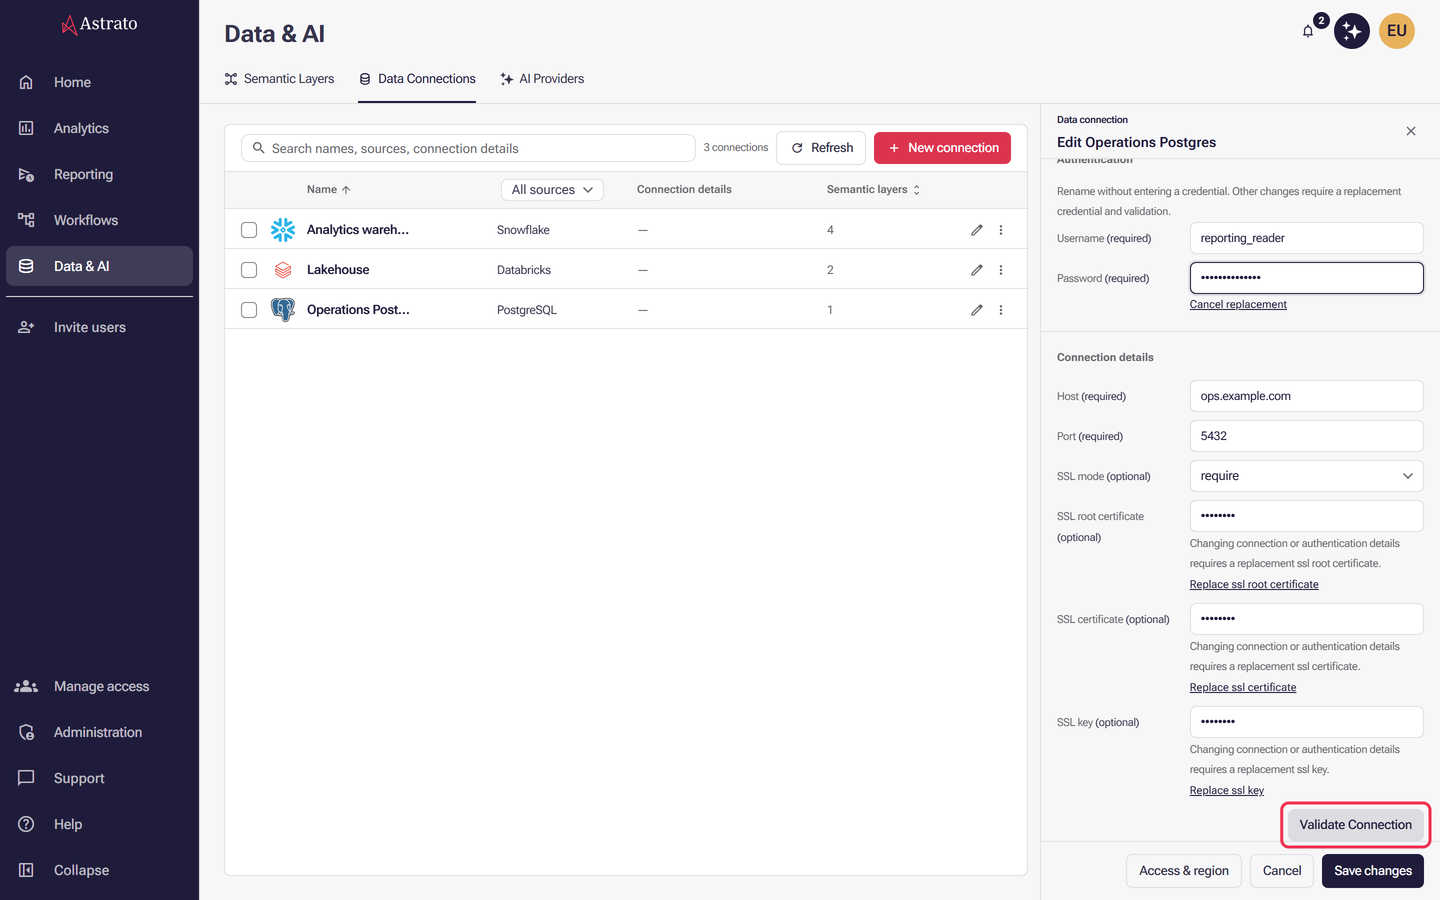
-
Reload the page, or select Retry on the chart if it is offered.
You are done when: the connection saves and the chart loads.
The Oops message
Section titled “The Oops message”What it means: an Oops, something went wrong toast means Astrato received an unexpected response from your cloud data warehouse. The error comes from the warehouse, so the fix is usually there or in the account the connection uses.
How to fix it:
- Work through Connection or warehouse errors and You do not have access.
- If it still fails, open your browser’s developer tools (F12), select the Network tab, reload the page and select the failed request. Copy its full response text.
- Send that text, the time and the chart’s name through the Support portal.
You are done when: the toast no longer appears, or Support has the full error text.
What next
Section titled “What next”- Object states: how a Data App shows loading, no data and error.
- Publish your changes: release a draft so charts can read it.
- Data Apps - Nash App Builder UI: Preview, Source files and the notices App Builder shows.
- Support portal: ask Nash for help or raise a bug report.
- Troubleshooting chart errors: the Help Center article on “Oops” and “Unauthorized access” errors in workbooks (legacy).