Design first: Using manual data
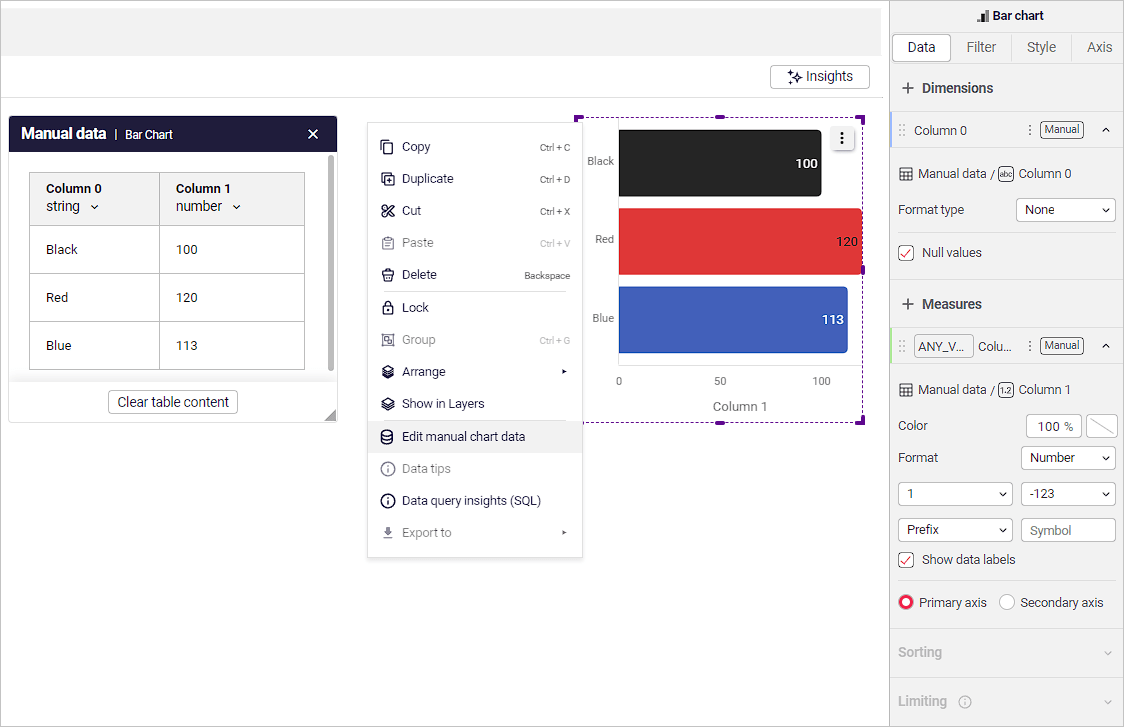
Users can build and design dashboards before connecting data, by adding manual mockup data sets that create a specific desired visualization that more closely represents your use case.
🎨 DESIGN FIRST | Prototype dashboards before connecting live data. Agile, over waterfall dashboard development.
👨🍳 BLEND DATA | Blend live data from the cloud, with data from static sources
📚 DATA STORIES | Effortless storytelling with infographics
Contents
Section titled “Contents”Creating workbooks with manual data
Creating charts with manual data
Creating workbooks with manual data
Section titled “Creating workbooks with manual data”Not all workbooks need to be live, some do not need to have data connected. Yes, you can even connect the data later!
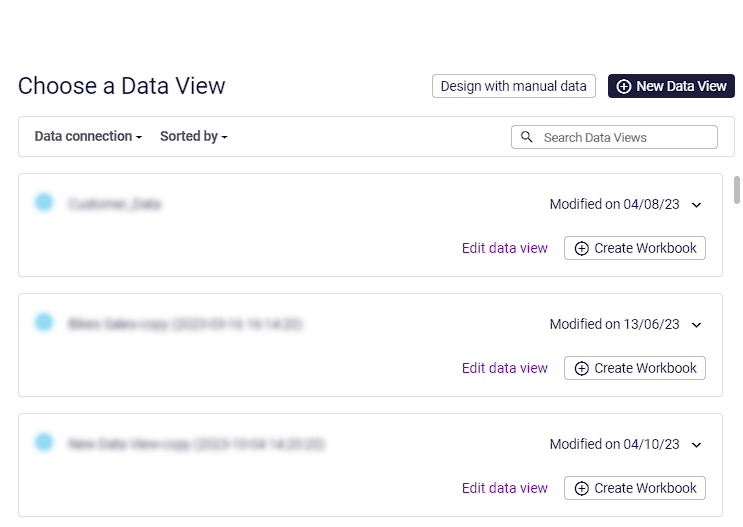
After starting the workbook creation process, simply click on Design with manual data to get started.
Creating charts with manual data
Section titled “Creating charts with manual data”In the workbook editor, right-click to add/edit manual data. You can later swap the manual data to use dimensions, measures and fields from your data view.