Building a Chart with a Dynamic Measure
This recipe builds a chart whose measure viewers choose from a dropdown. The example switches between Total Sales Amount and Total Quantity. A conditional measure picks one of them from a parameter, a workbook variable sets the parameter, and an action sets that variable when the viewer changes the dropdown.
This setup switches between two measures. To let viewers choose from more measures or dimensions in several charts from one dropdown, without an action, see Drive alternate measures & dimensions using variables & dropdowns.
Building the measures
Section titled “Building the measures”Create four measures:
-
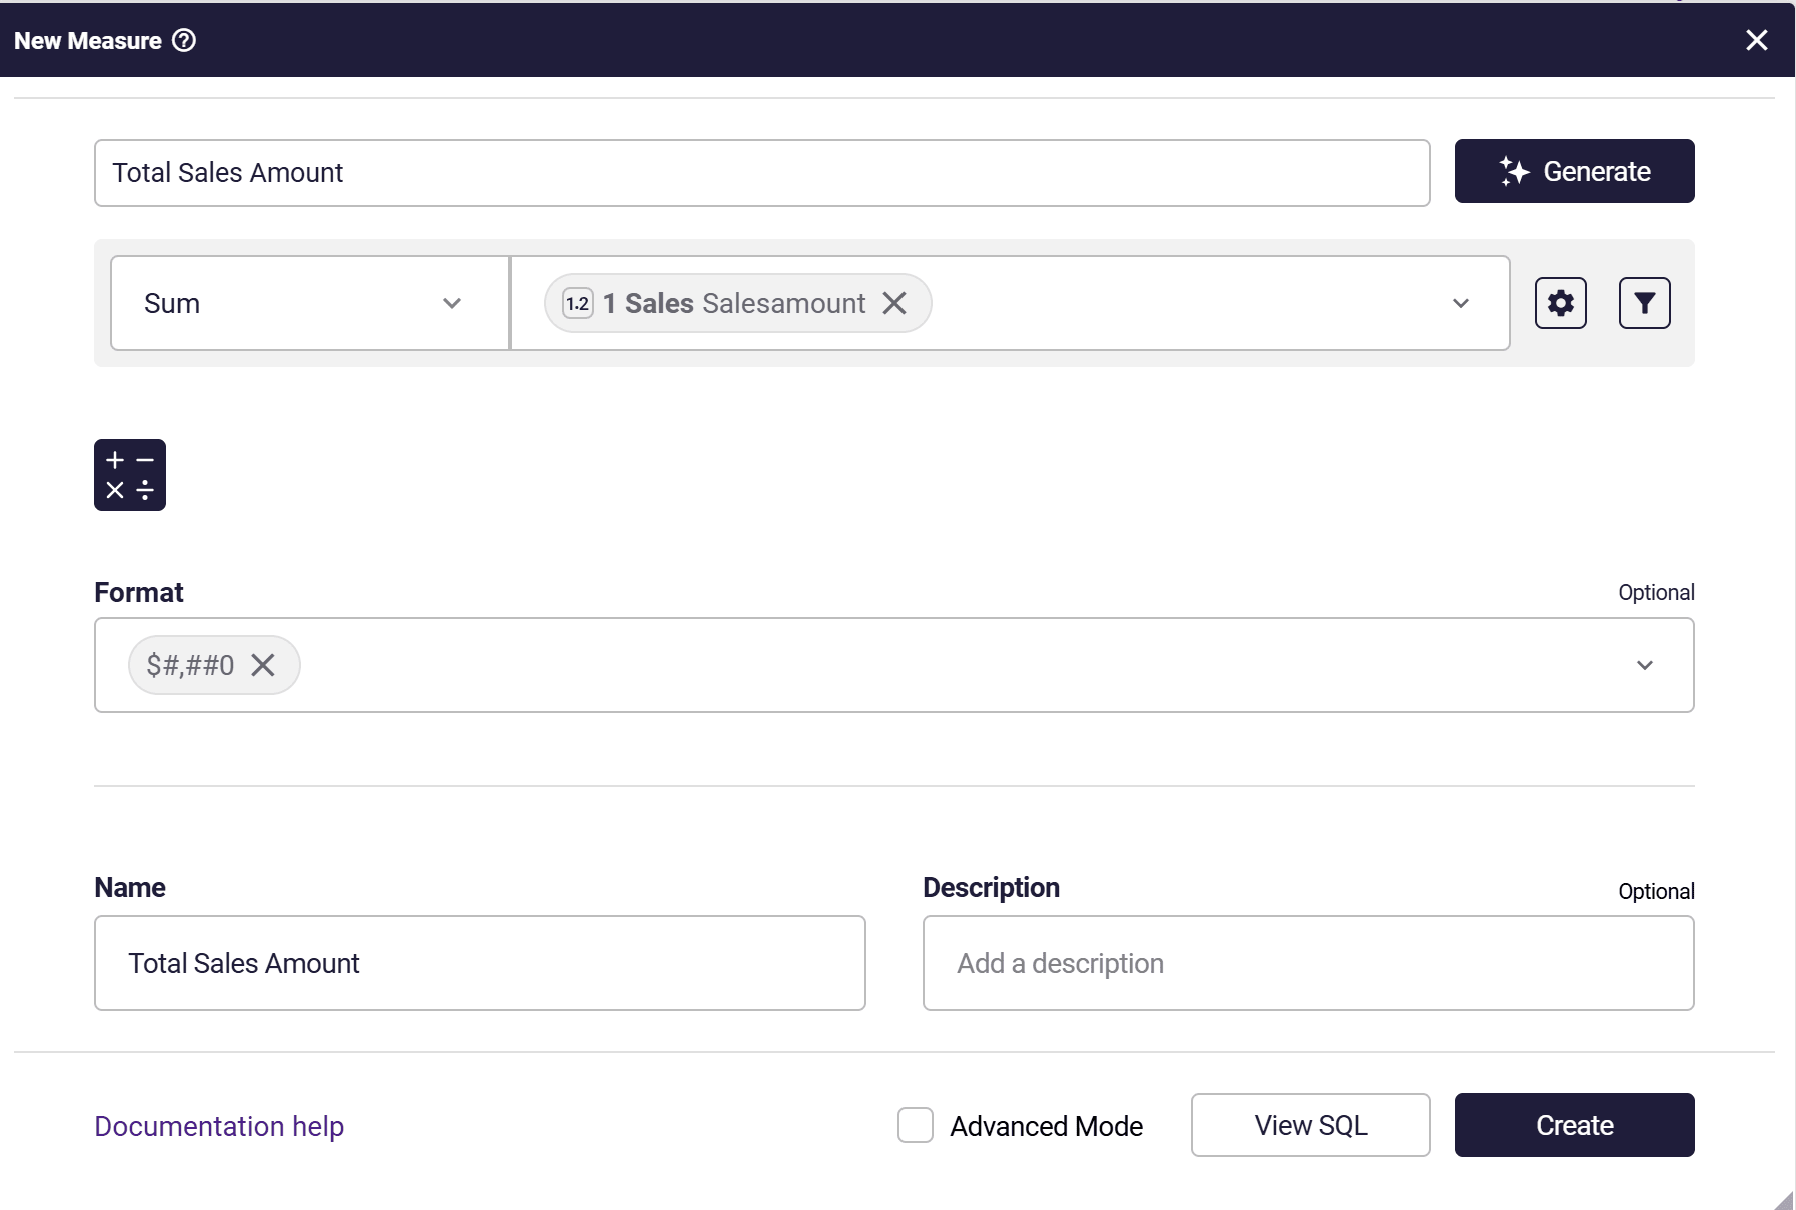
Total Sales Amount, the total sales amount.
-
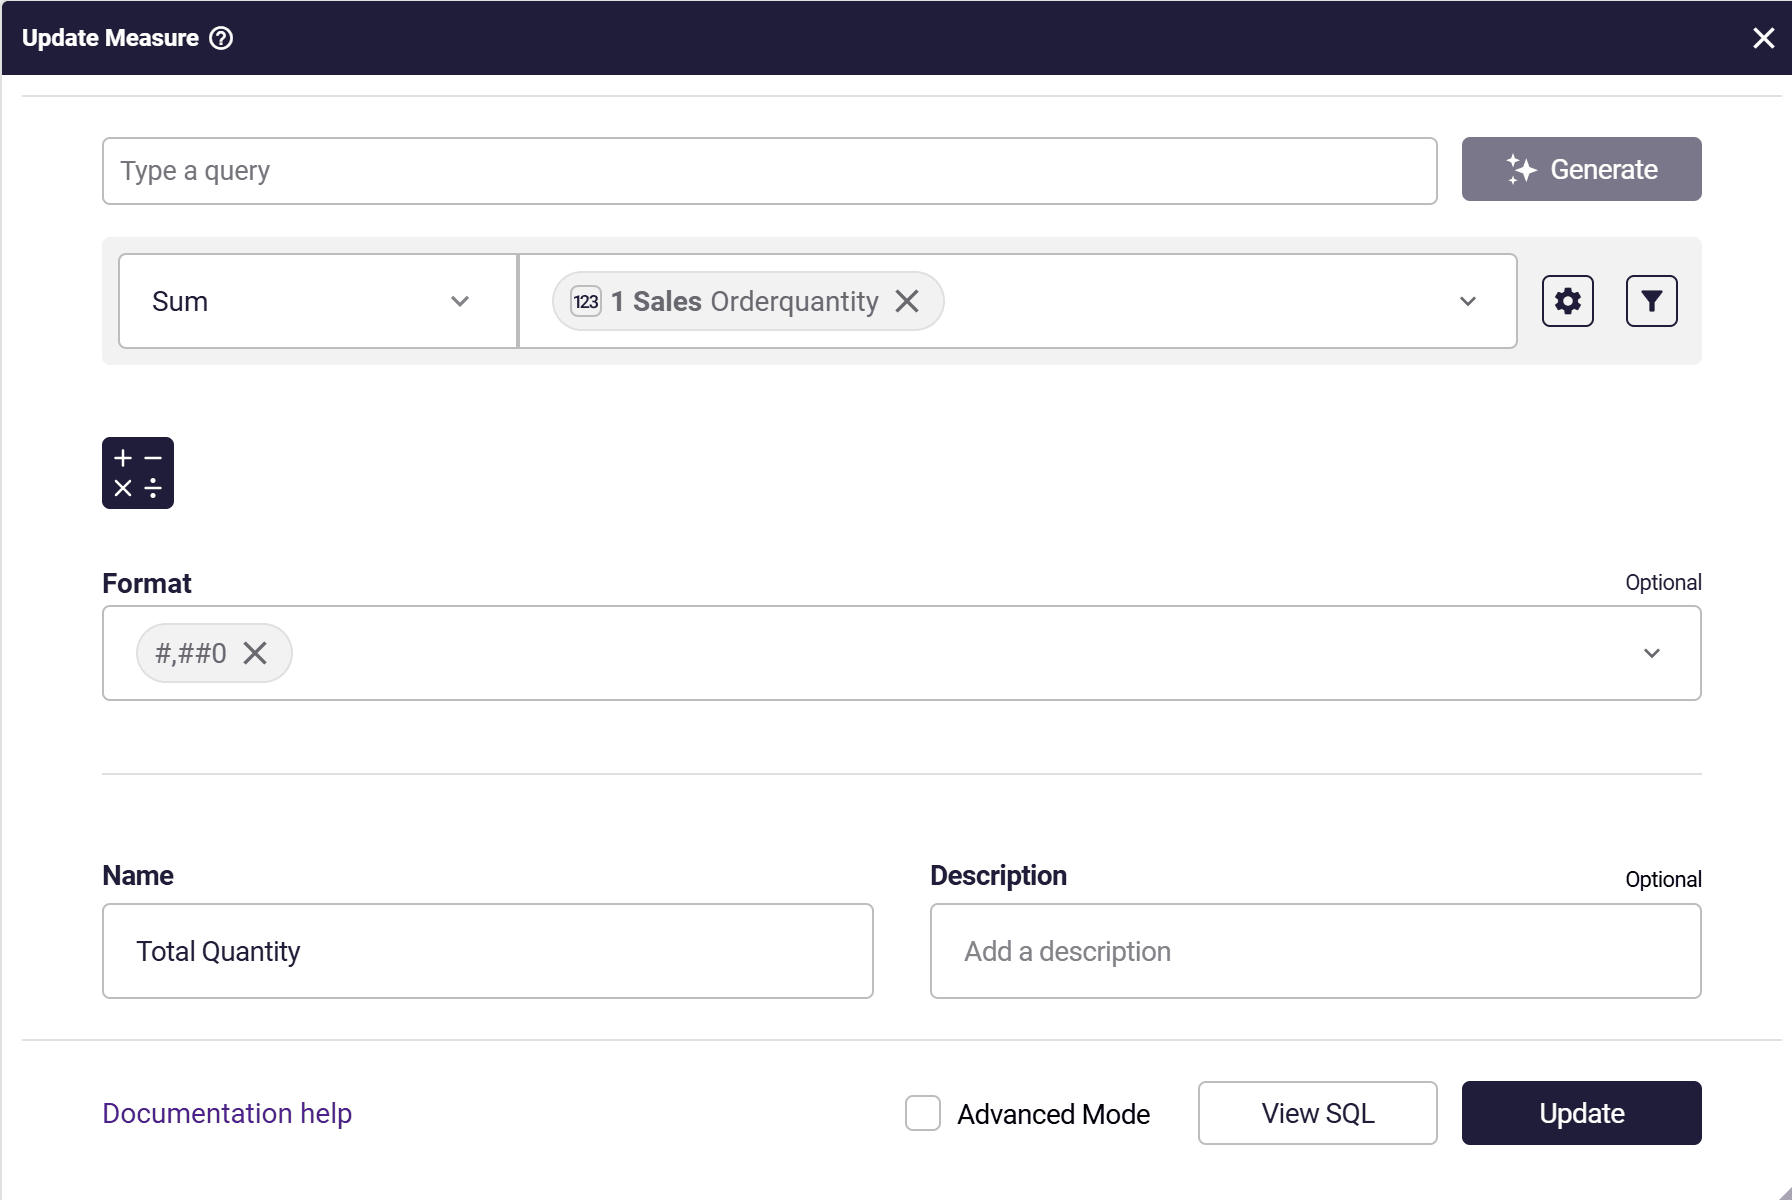
Total Quantity, the total quantity sold.
-
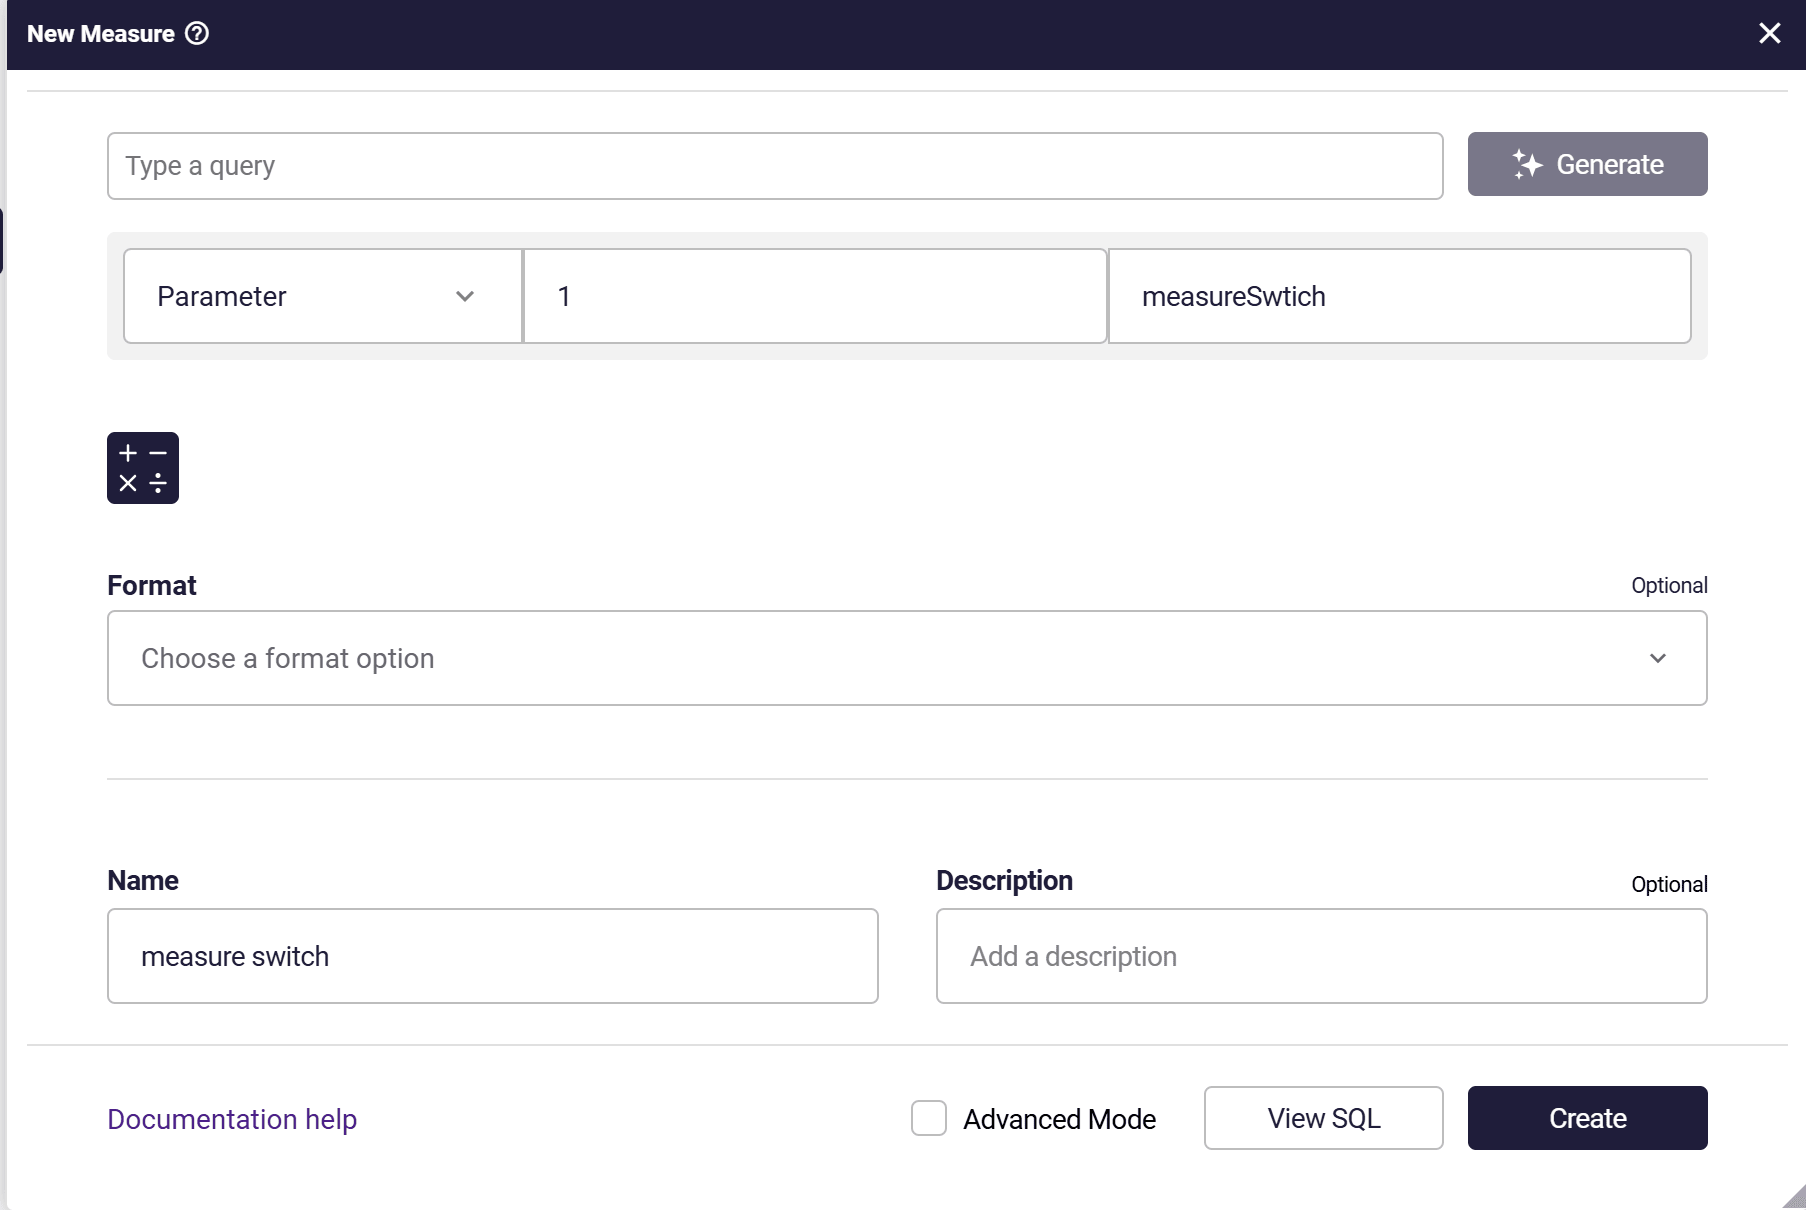
measure switch, a measure that holds only a parameter, with a default value of 1. For how measure parameters work, see Measure Parameters.
-
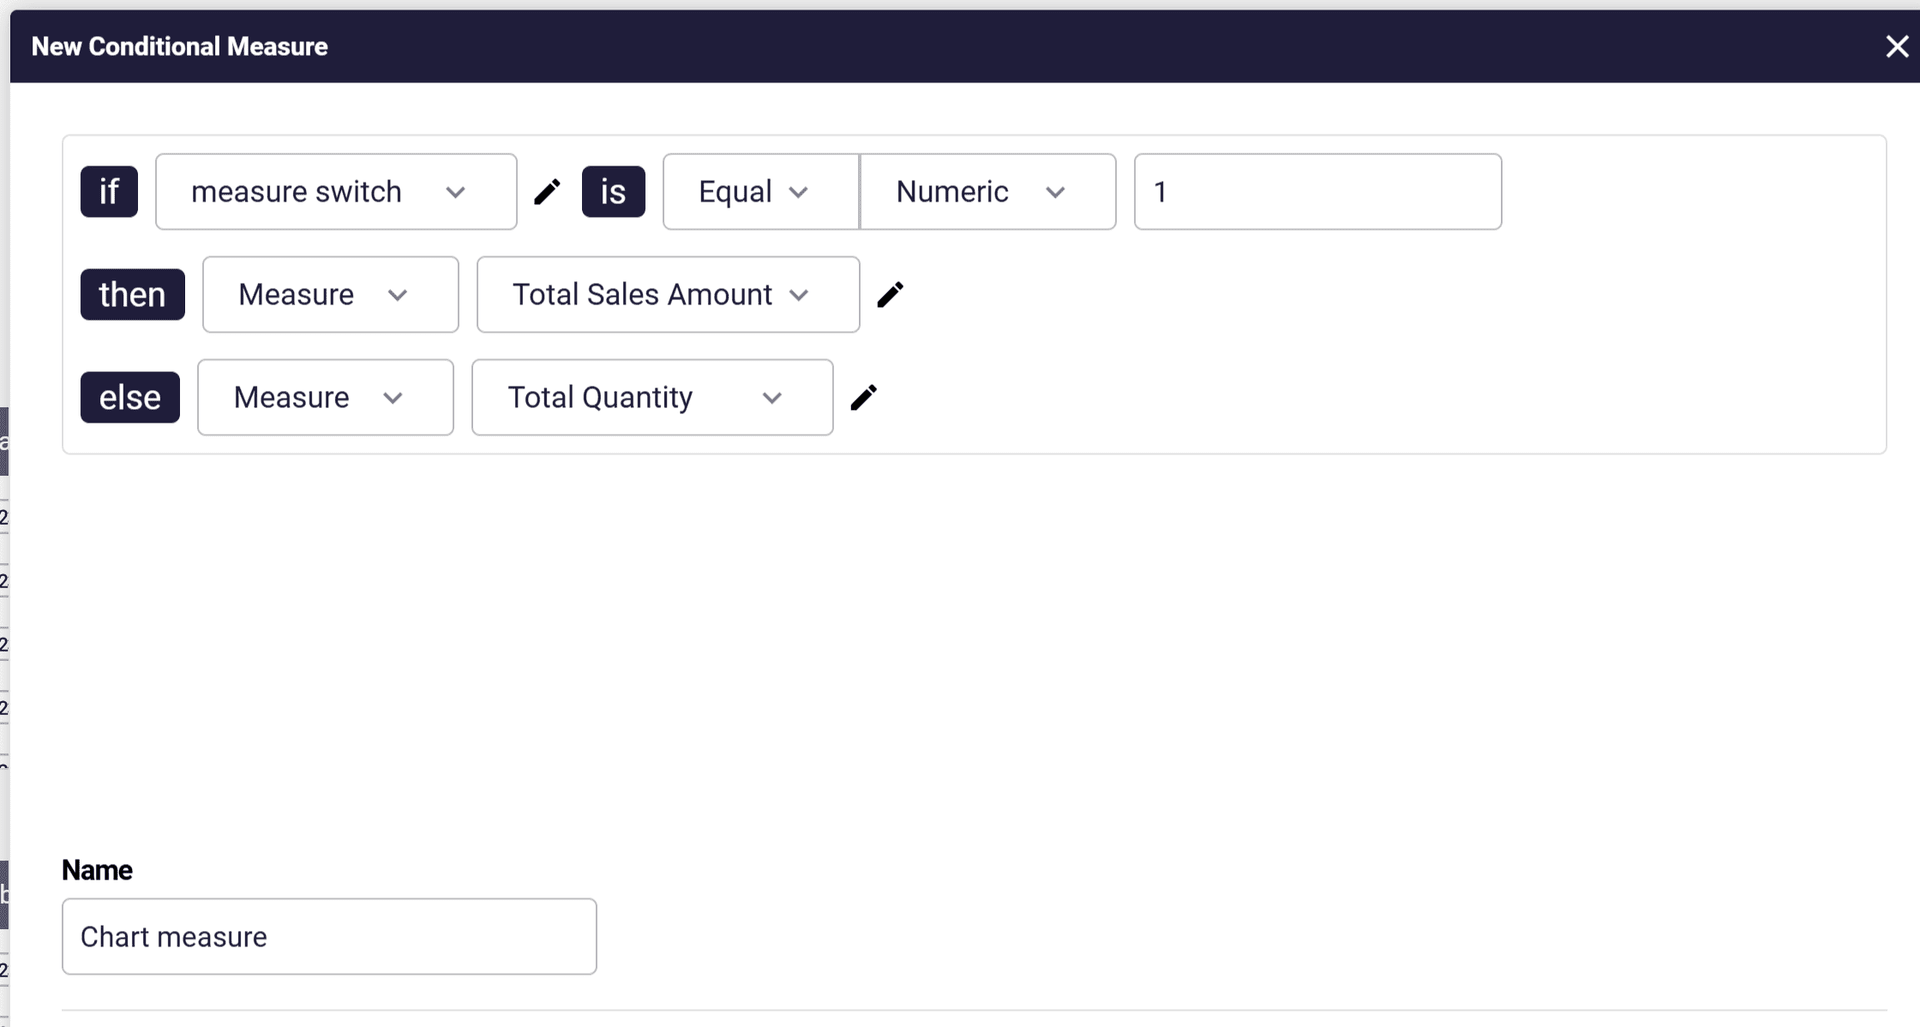
Chart measure, a conditional measure: if measure switch equals 1, then Total Sales Amount, else Total Quantity.
Building the chart
Section titled “Building the chart”-
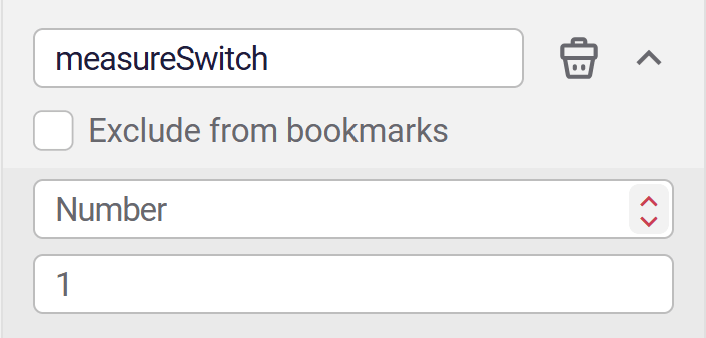
Create a number variable named measureSwitch with a default value of 1. For how to create variables, see Creating variables to use with objects.
-
Create a string variable named selected measure with a default value of
Sales Amount. -
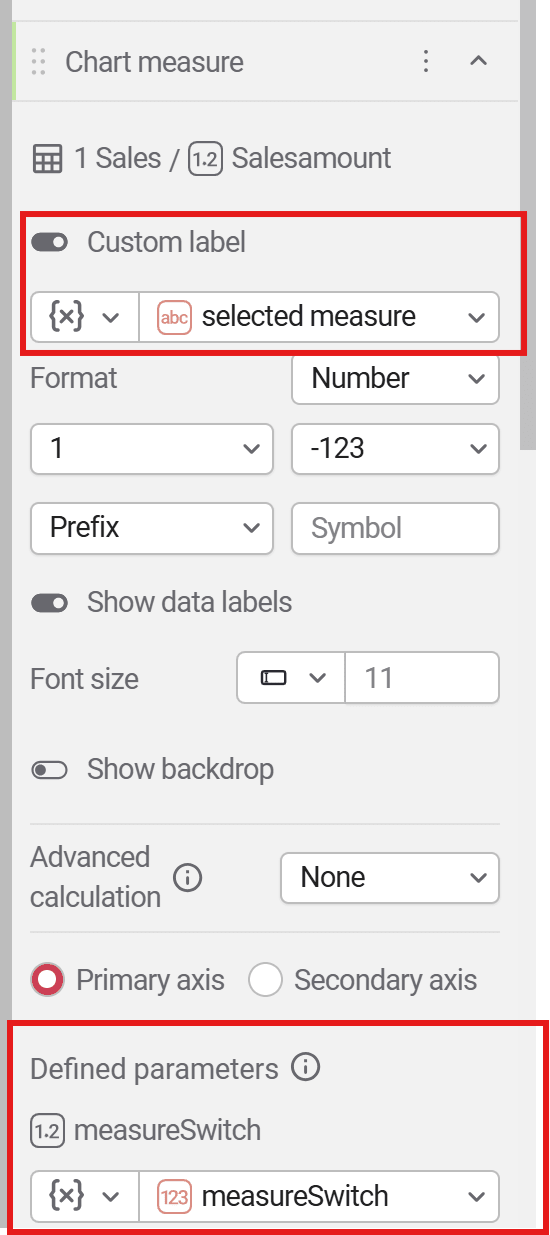
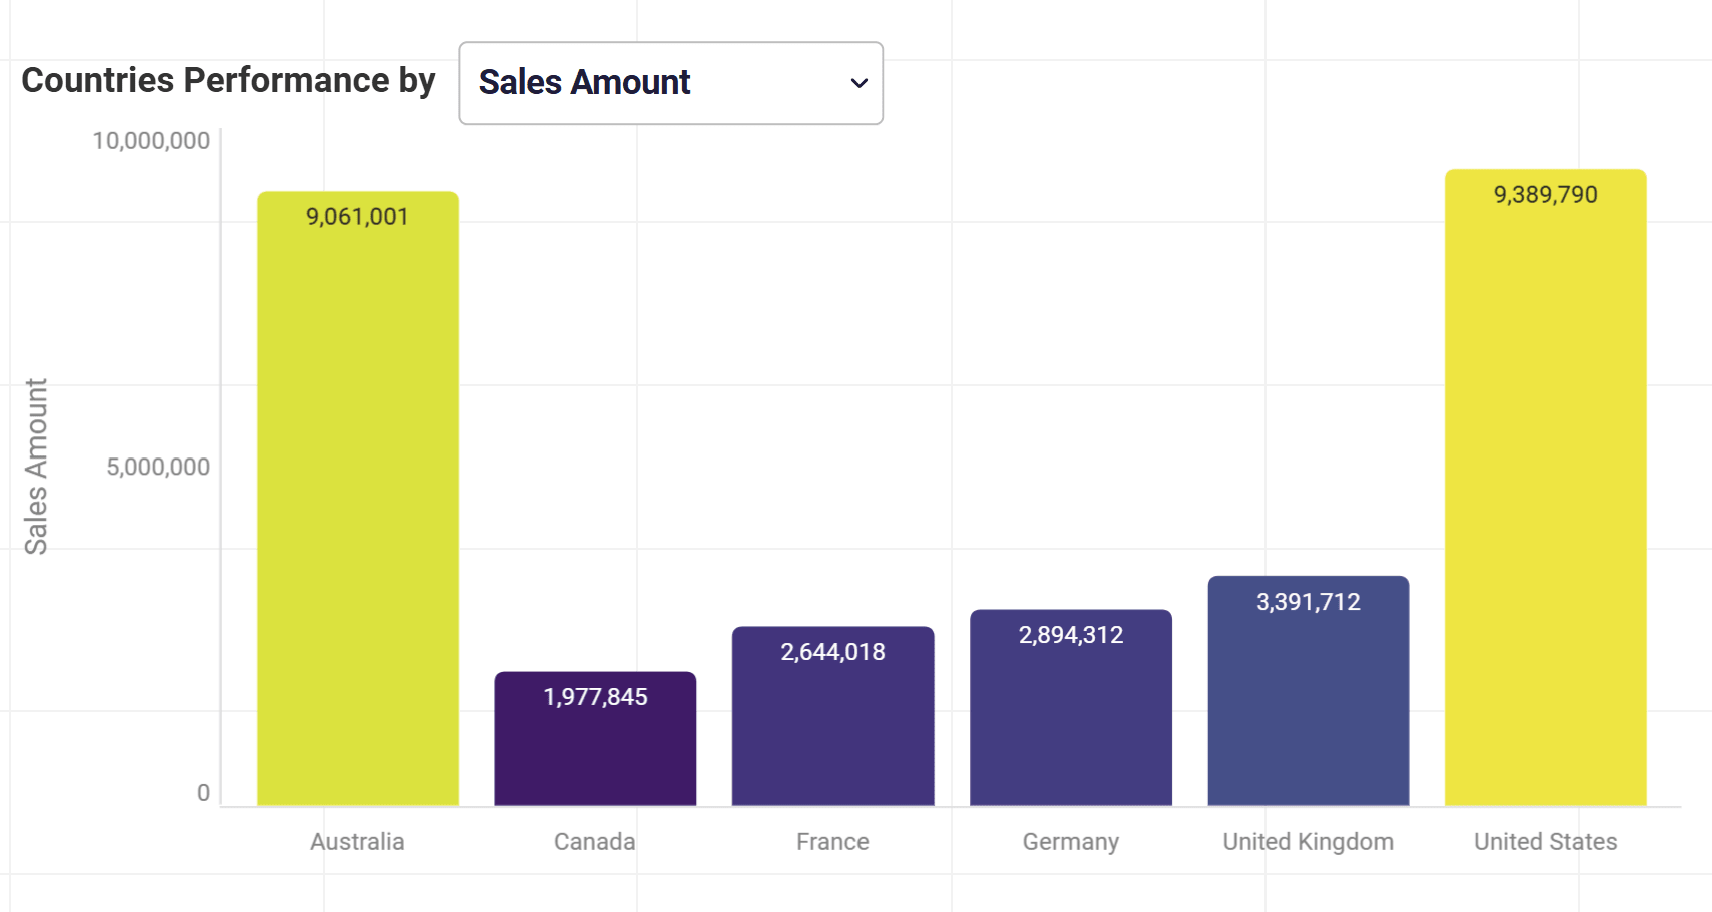
Create a chart with the dimension you want and the Chart measure measure. In the measure’s properties, link the measureSwitch variable to the measure’s parameter under the defined parameters, and set the custom label to the selected measure variable, so the chart names the measure it shows.
-
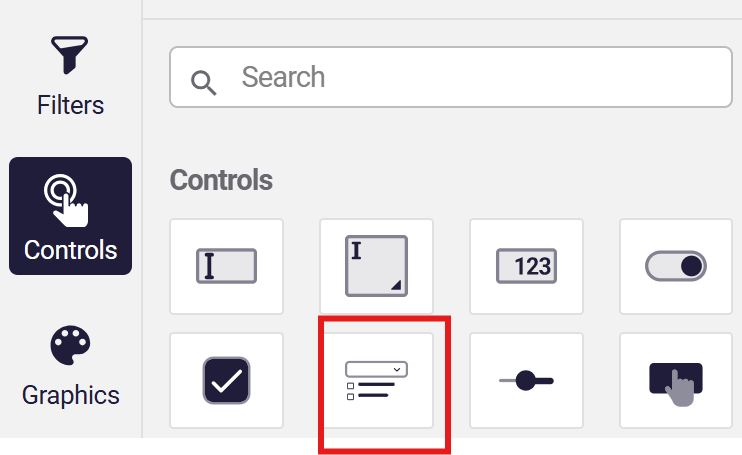
Add a dropdown control to the sheet from the controls in the left panel.
-
In the dropdown’s properties, select the selected measure variable and add two custom options:
Sales AmountandTotal QTY.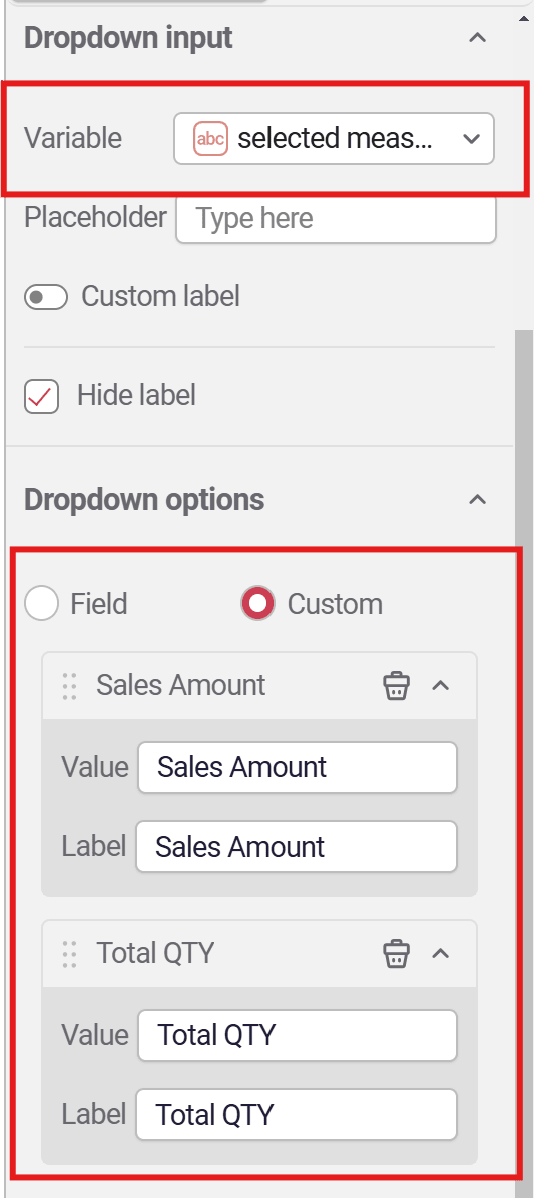
-
Place the dropdown next to the chart title or wherever it reads naturally, and group the chart and the dropdown together.
Defining the actions
Section titled “Defining the actions”The action translates the viewer’s choice in the dropdown into the number the conditional measure reads.
-
Open the Actions dialog.
-
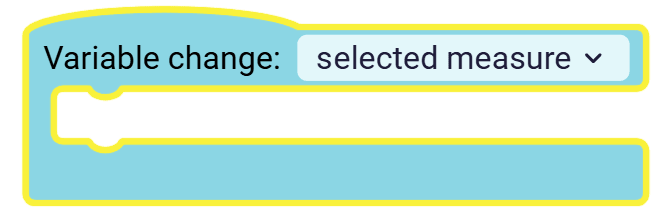
Drag the Variable change event to the canvas and select the selected measure variable.
-
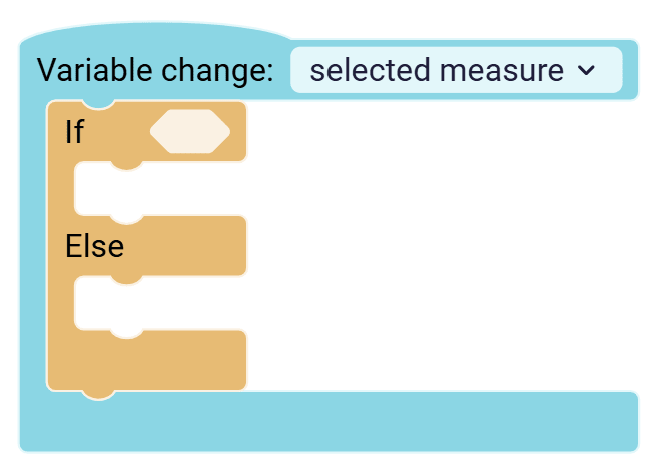
From the Conditions category, add an if-else block inside the Variable change block.
-
Set the condition to selected measure =
Sales Amount. In the branch that runs when the condition is true, set measureSwitch to 1. In the else branch, set measureSwitch to 2.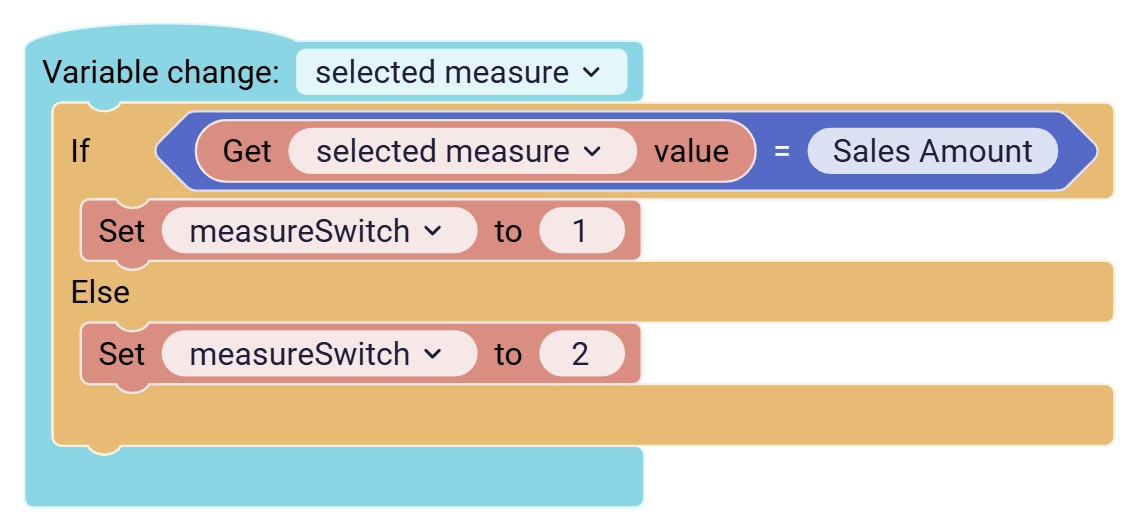
Testing the chart
Section titled “Testing the chart”Select Preview in the top bar and pick each option in the dropdown. With Sales Amount selected, the chart shows Total Sales Amount; with Total QTY selected, measureSwitch becomes 2 and the chart shows Total Quantity. The measure label follows the option you picked.
Known Limitations
Section titled “Known Limitations”- As built here, the recipe switches between two measures, because the conditional measure and the if-else block each have two branches.
- measureSwitch is a workbook variable, so every chart that uses Chart measure with that variable linked changes when a viewer picks another option.