

Sankey Chart
Introduction
Section titled “Introduction”This article looks at Astrato’s Sankey visualization.
-
Building A Sankey Chart
-
Define a Sankey Chart
-
Special Dimension Settings in a Sankey Chart
-
Data Limits
-
-
Style a Saneky Chart
A Sankey Chart (alluvial diagram) data object consists of two or more dimensions and one measure.
The Saneky chart gives users a view of data flow between the different dimensions.
Sankey chart insights identify the significance of a path that connects all the dimensions in the chart.
Sankey chart common use cases are:
-
Energy Flow Diagrams
-
Material Flow Analysis
-
Cost Allocation Diagrams
-
Supply Chain and Logistics
-
Website Traffic Flow
-
Population Migration
-
Carbon Footprint Analysis
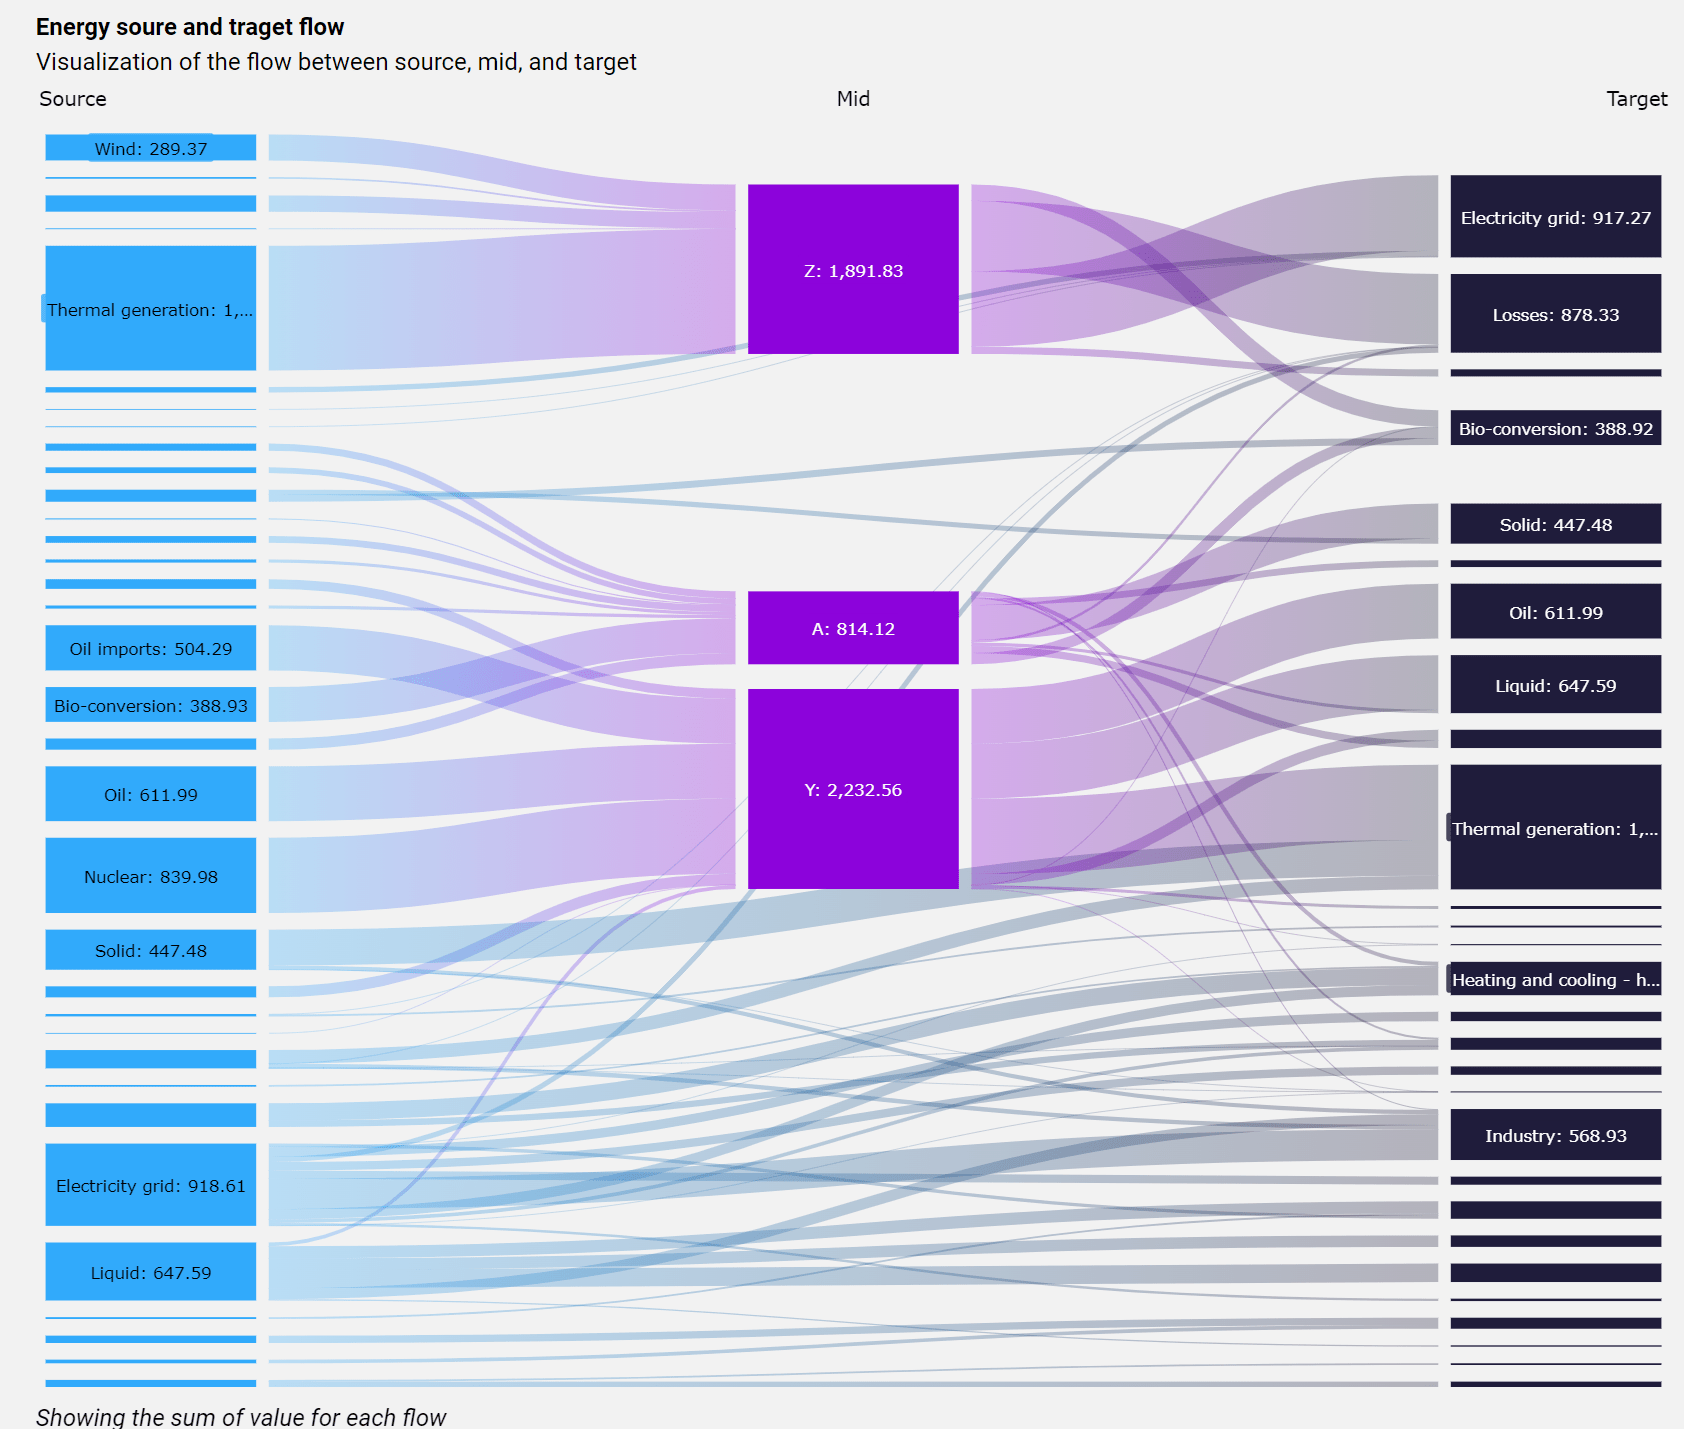
Building a Sankey
Section titled “Building a Sankey”Add a Sankey Chart
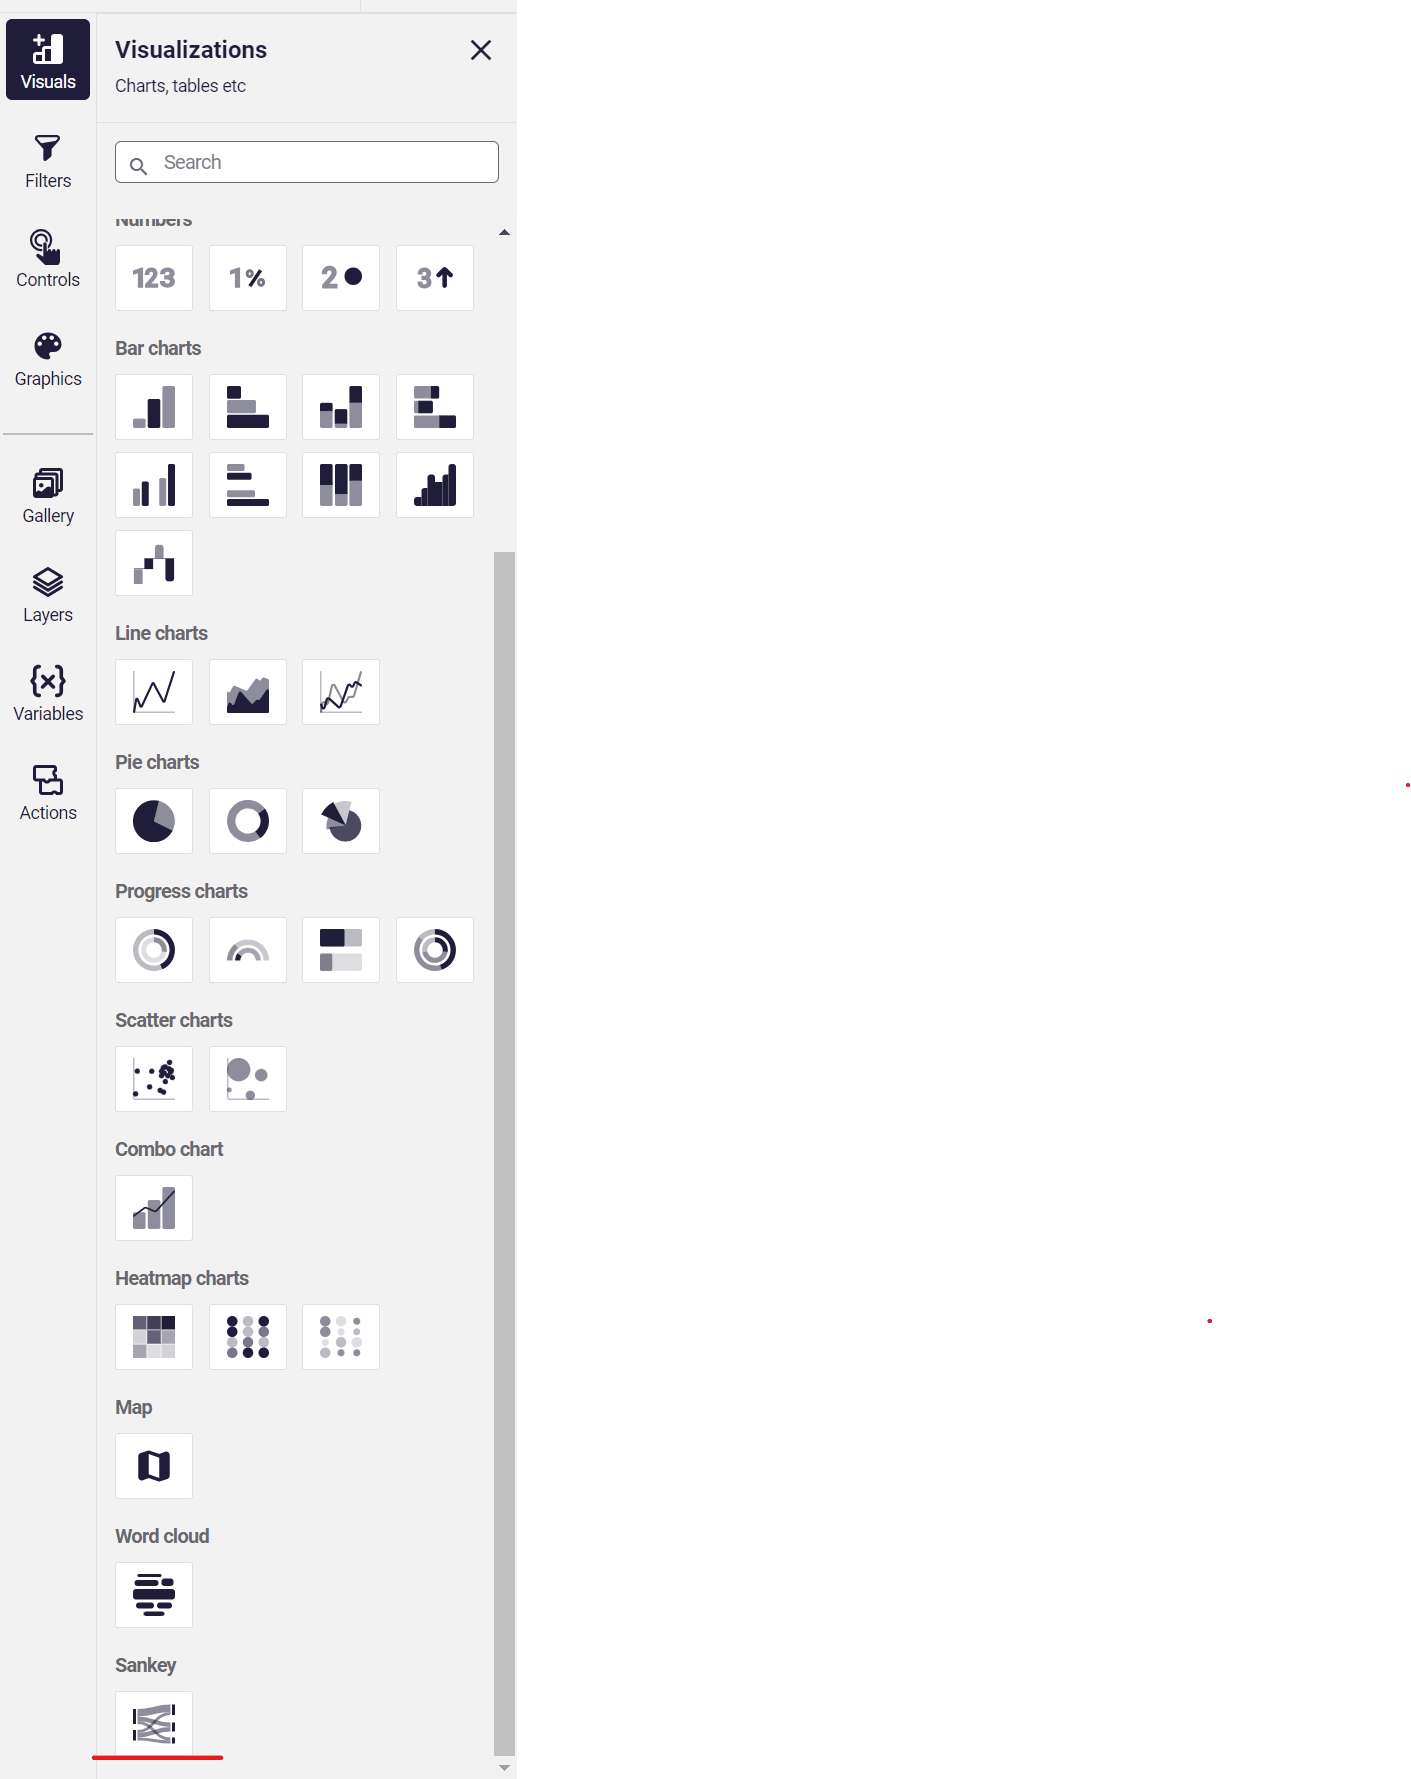
Section titled “Add a Sankey Chart”The Sankey Chart can be found in the visualization tile. It is positioned in the bottom part of the visualization list.
Define a SankeyChart
Section titled “Define a SankeyChart”-
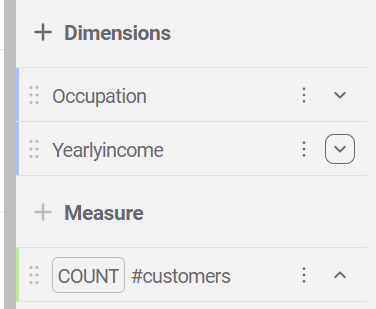
Add at least two dimensions and one measure.
-
**Special Dimension Settings in the Sankey Chart
Section titled “**Special Dimension Settings in the Sankey Chart”**
-
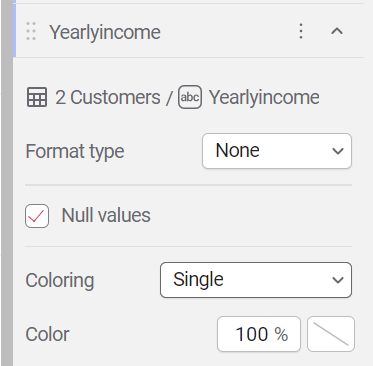
Coloring: set the coloring method for an individual dimension.
-
Single - all nodes in the dimension will have the same color
-
Categorical - each node in the dimension will have a different color.
-
-
-
Data Limits
Section titled “Data Limits”-
By default, the chart displays the first 2000 rows of the query.
When using more than 3 dimensions, it’s recommended to increase the limit of records to a number that covers all the rows. -
Large number of rows in a charts might impact the performance of the chart and dashboard.
-
-
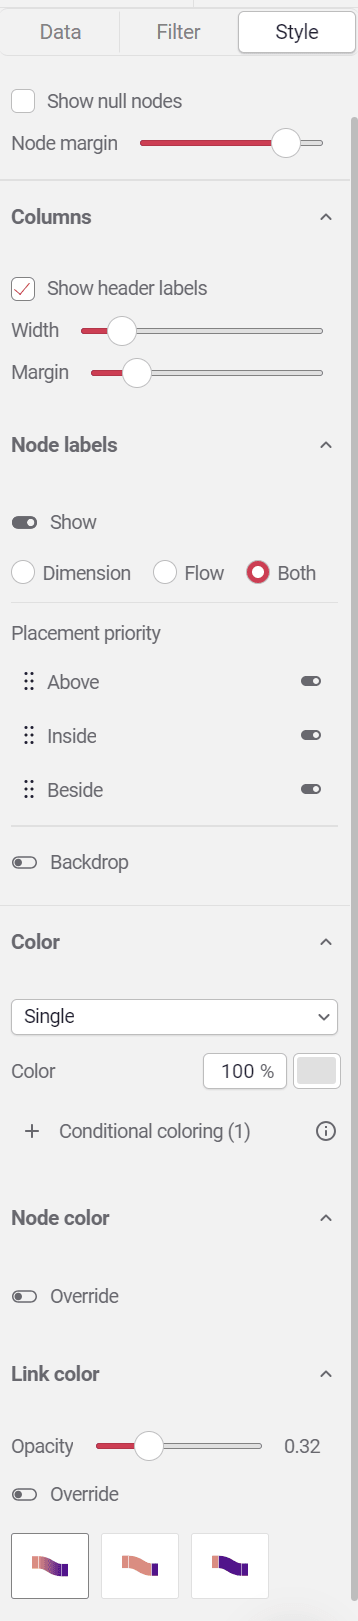
Style a Sankey Chart
Section titled “Style a Sankey Chart”
Layout
Section titled “Layout”-
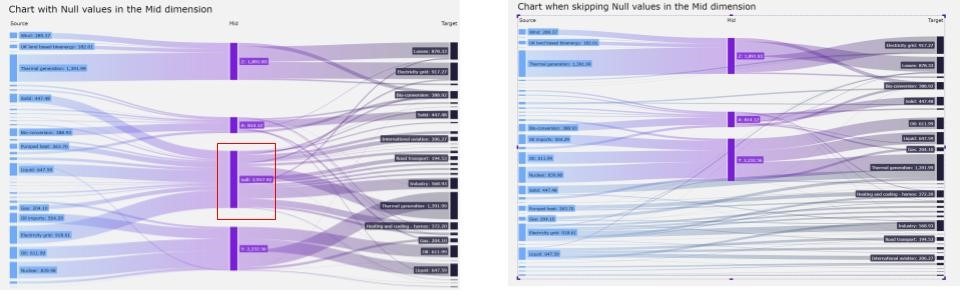
Show null nodes: show or hide all null nodes across all dimensions.
Compare the two images below and notice the difference in the second dimension when this setting is enabled versus disabled.
-
Node margin: set the vertical margin between nodes in the dimensions.
Node Labels
Section titled “Node Labels”-
Show header label: show or hide the dimensions labels.
-
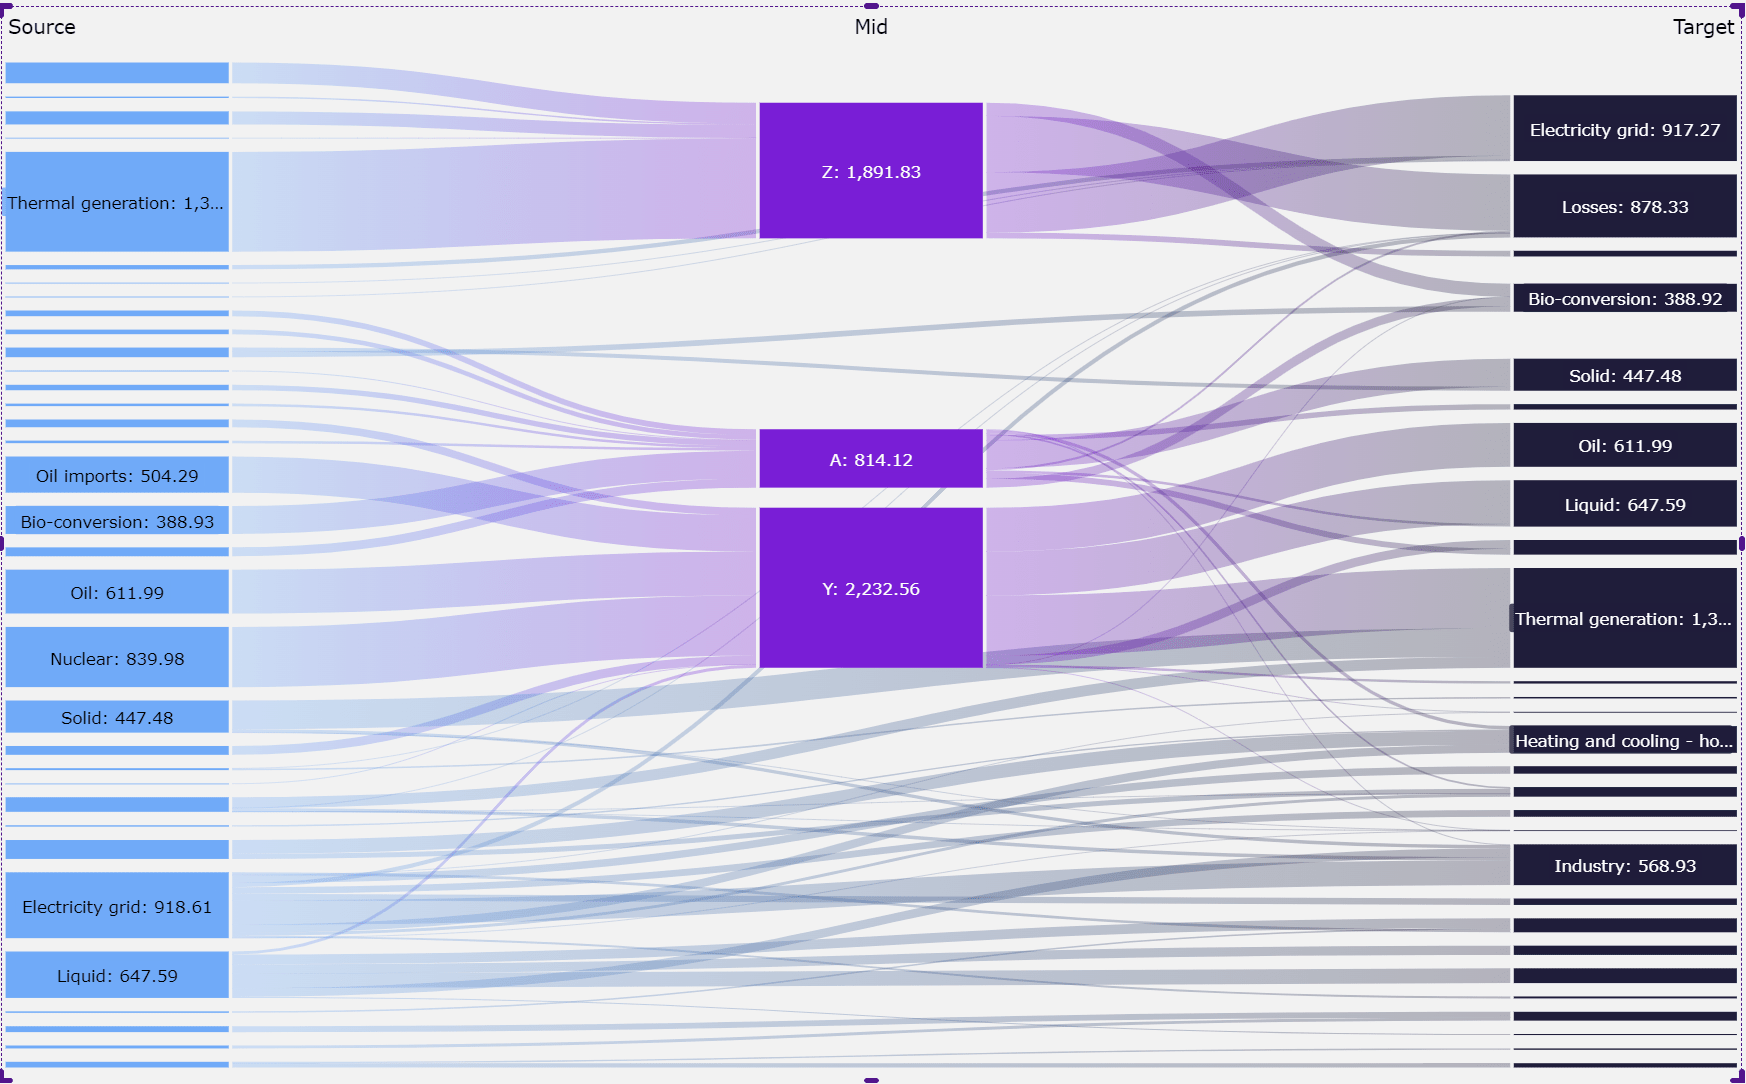
Width: set the width of nodes across all dimensions; when nodes are wide enough, labels will be placed on the side of the nodes.
-
Margin: set the horizontal margin between the links and the nodes.
-
Node labels: enable or disable node labels.
When enabled, select which information to display:-
Dimension: only shows the dimension label
-
Flow: only shows the measure value.
-
Both: Showing dimension label and measure value.
-
-
Placement Priority: by default, the node label is placed automatically in the best position to create a clear display of the chart; by disabling one of the options, you can force a particular place for the node label.
-
Backdrop: set the background color for the node label.
The image below shows a chart where node labels are set to:
both, and placement priority is set beside, and the backdrop is light green.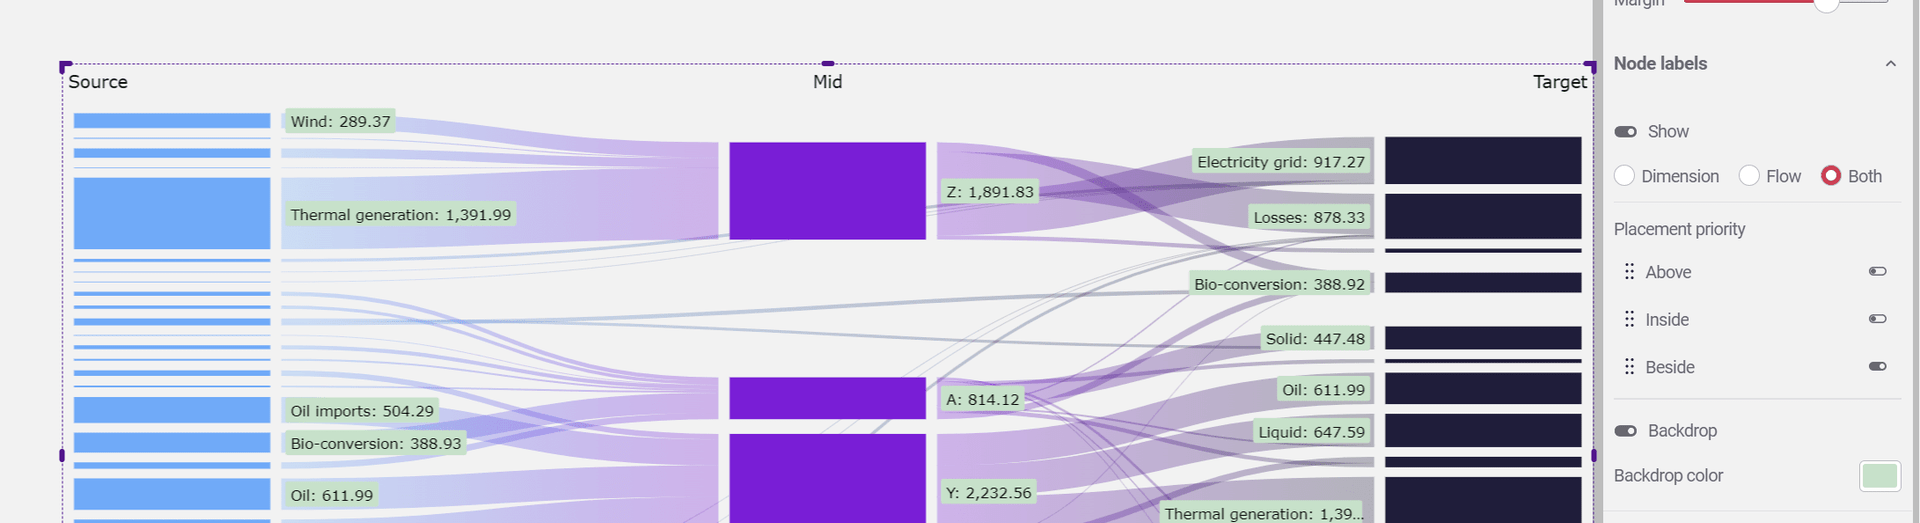
-
Color - set the coloring method for the chart. There are two options:
-
Single: All nodes and links will be colored the same way.
It’s recommended to use this method when wanting to highlight a particular part of the chart. -
Per Dimension: A different color for each dimension.
-
* This setting is overriding the color setting of the dimensions
-
-
Conditional coloring: define a coloring condition by either a measure or a dimension.
- This setting overrides any coloring definition.
-
Node color- when override is enabled, all nodes will be displayed with the defined color.
-
Link color: set the color and gradient mode for links
-
Opacity: set the opacity of links.
-
Override: set the link color, overriding other settings.
-
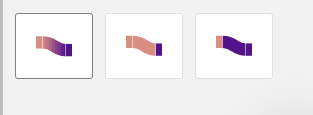
Coloring method:
-
The left shows a gradient between the start and end dimension colors.
-
The middle option uses the start dimension color
-
The right option uses the end-dimension color
-
-