

Explainer style
This style follows the explainer charts of newspaper data desks: a light ground, a clean sans-serif, figures that line up, and series named in the text instead of a legend. The chart sits inside the text; the paragraph above it says what to look at.
Titles, notes and prose are host HTML; the chart is styled with operations. See Colour visualizations with operations.
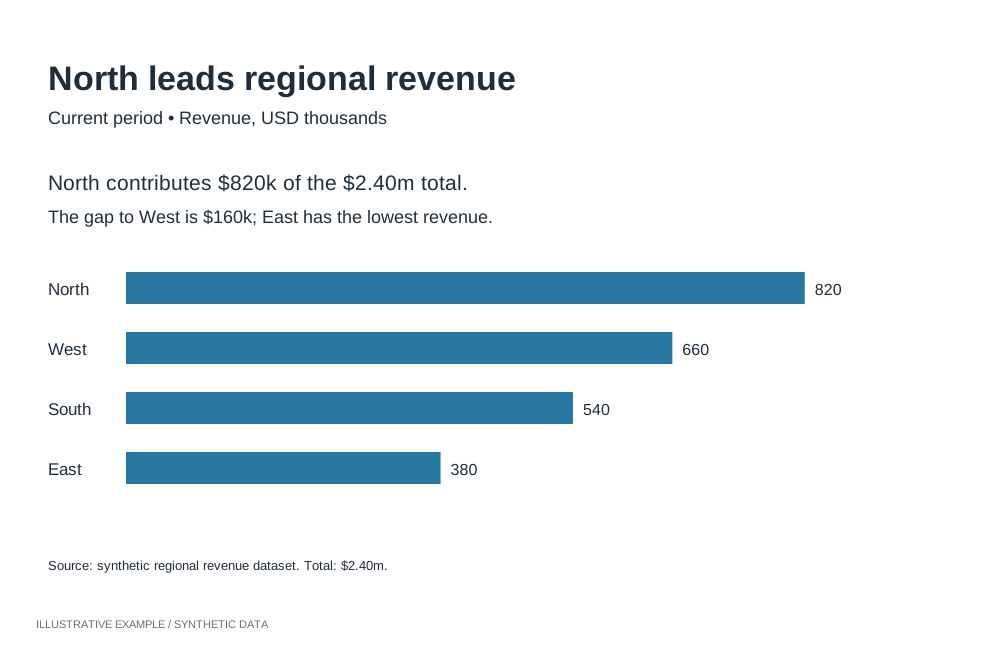
Illustrative example with synthetic data. Connect prose, direct labels and a simple chart.
When to use the explainer style
Section titled “When to use the explainer style”Use it when readers follow a number over time or need a result explained: economic indicators, poll trackers, and pages that explain why a figure moved.
| The page is mainly | Use instead |
|---|---|
| Separate charts, each making one point from its title | Economist or Financial Times |
| A presentation that leads to one decision | Storytelling with data |
| Many items compared at a glance, colour carrying categories | Information is Beautiful |
| A long narrative with charts that change as the reader scrolls | Visual essay |
| A dashboard that looks like the tenant’s Workbooks | Astrato default |
Use cases
Section titled “Use cases”| Use case | What the page shows |
|---|---|
| Economic indicator tracker | A paragraph on the latest release, then the series over time |
| Poll tracker | Each candidate’s average as a line, named in the text in its colour |
| Explaining a result | Short paragraphs, each followed by the one chart that supports it |
Tokens
Section titled “Tokens”Define the tokens once and redefine them for dark; see Define colour tokens.
:root {  --page: #ffffff;  --surface: #ffffff;  --ink: #1a1a1a;  --muted: #626262;  --line: #d6d6d6;
  --series-1: #2166ac;  --series-2: #c7432b;  --series-3: #6b6b6b;
  --font: 'Libre Franklin', Arial, sans-serif;  --font-figures: 'IBM Plex Mono', ui-monospace, monospace;
  --measure: 68ch;  --space-1: 4px;  --space-2: 8px;  --space-3: 16px;  --space-4: 32px;}:root[data-theme='dark'] {  --page: #161616;  --surface: #161616;  --ink: #ececec;  --muted: #a0a0a0;  --line: #333333;
--series-1: #6aa9e6; --series-2: #f07b62; --series-3: #9a9a9a;}- Fonts. Libre Franklin and IBM Plex Mono are openly licensed and served by Google Fonts; see Load visualization fonts.
- Figures. In host HTML, set
font-variant-numeric: tabular-numsand check that the font has tabular figures. Number and table objects take a font family but no numeric variant, so use--font-figuresthere.
Page and card chrome
Section titled “Page and card chrome”No cards. The chart sits in the text column, or wider when it needs it, on the page background.
<article class="story"> <p>Unemployment rose for a third month, to its highest level since spring.</p> <figure class="chart"> <figcaption> <h2 class="chart-title">Unemployment rate</h2> <p class="chart-subtitle">% of the labour force, seasonally adjusted</p> </figcaption> <div class="chart-host"></div> <p class="chart-note">Source: labour force survey. Figures are estimates from a sample survey.</p> </figure> <p>The rise was concentrated in younger workers.</p></article>The Card supplies structure; this style sets its tokens and type, and gives the card a height, because no layout row sizes it in the text column.
:root {  /* The Card's tokens; see /app-components/object-frame/#css. */  --panel-border: 0;  --radius: 0;  --panel-shadow: none;  --frame-pad-x: 0px;  /* 1px more than the Card's 6px, because there is no border. */  --frame-pad-y: 7px;  --frame-title-h: 24px;  --frame-subtitle-h: 18px;  /* Two 18px lines for a longer note. */  --frame-note-h: 36px;  /* 7 + 24 + 18 + 240 + 36 + 7 = 332: a 240px plot with a two-line note. */  --chart-h: 332px;}
body { background: var(--page); color: var(--ink); font: 400 17px / 1.55 var(--font); font-variant-numeric: tabular-nums;}.story { max-width: var(--measure); margin-inline: auto; padding-inline: var(--space-3);}/* In the text column the card is in normal flow, so it needs its own height. */.story > .chart { height: var(--chart-h); margin-block: var(--space-4);}.story > .chart--wide { width: min(100vw - 2 * var(--space-3), 1040px); margin-inline: calc((min(100vw - 2 * var(--space-3), 1040px) - 100%) / -2);}.chart-title { font-family: var(--font); font-weight: 700; font-size: clamp(15px, 3.4cqi, 19px);}.chart-subtitle { font-family: var(--font); font-size: 14px;}.chart-note { font-family: var(--font); font-size: 13px; line-height: 18px; white-space: normal;}- Set font longhands only; a
fontshorthand resetsline-heightand moves the text out of its row. The note is the exception: it wraps onto the two lines its row holds. .chart--widecentres a chart wider than the text column on the column.
Charts
Section titled “Charts”Read token values from script, pass them as payloads, and re-apply them when the theme changes; see Switch themes in place.
Axes, bar and line
Section titled “Axes, bar and line”The axis operations take an axisName; bar and line use dimension and primaryMeasure. Other
axis types publish the same operations with their own axis names; check the type’s operations page.
| Setting | Operation | Value |
|---|---|---|
| No value-axis line or ticks | setShowAxisLine, setShowAxisTicks |
primaryMeasure: false |
| Category-axis line | setAxisLineColor |
dimension: --line |
| Axis labels | setAxisLabelColor |
Each axis: --muted |
| No axis titles; the subtitle gives the unit | setShowAxisTitle |
Each axis: false |
| No legend when the text names the series | setLegendEnabled |
false |
| Setting | Operation | Value |
|---|---|---|
| Straight segments | setLineType |
straight |
| Colour and weight per measure | setMeasureGraphColor, setMeasureLineSize |
The series tokens; strokeWidth: 2.5 |
| Gaps shown as gaps | setDataGapsHandling |
show |
| Fewer value labels, in the series colour | setMeasureDataLabelsShow, setMeasureDataLabelDensity, setMeasureDataLabelIsColored |
true, low, true |
const token = (name: string) => getComputedStyle(document.documentElement).getPropertyValue(name).trim();
// The chart's measures, in series order, each identified by its data item keys.declare const measures: { dataItemInternalKey: string; dataItemUniqueSignature: string }[];
const lineOperations = [  { name: 'setLineType', payload: 'straight' },  // Three series tokens, so three measures at most.  ...measures.slice(0, 3).flatMap((ref, i) => [    { name: 'setMeasureGraphColor', payload: { ...ref, graphColor: token(`--series-${i + 1}`) } },    { name: 'setMeasureLineSize', payload: { ...ref, strokeWidth: 2.5 } },  ]),];
Check each result; see Check operation results.
Bar, scatter, number and table
Section titled “Bar, scatter, number and table”| Type | Setting | Operation | Value |
|---|---|---|---|
| Bar | Horizontal bars for results by group | setBarChartOrientation |
horizontal |
| Bar | Square bar ends | setBarChartBarRadius |
0 |
| Bar | Values at the bar ends instead of a value axis | setMeasureDataLabelsShow, setMeasureDataLabelBarPlacements, setShowAxisLabels |
true; [{ "position": "outside" }]; primaryMeasure: false |
| Scatter | Point labels | setShowDataLabels, setDataLabelDensity |
true, low |
| Scatter | Label text colour | setDataLabelTextOrBackdrop, setDataLabelTextColor |
text, --ink |
| Number | Figure font and colour | setNumberFontFamily, setNumberFontColor |
IBM Plex Mono, --ink |
| Table | Body and header fonts | setTableBodyFontFamily, setTableHeaderFontFamily |
IBM Plex Mono, Libre Franklin |
| Table | Horizontal dividers only, no outer border | setTableColumnBorders, setTableBorderEnabled |
showHorizontal, false |
Titles, labels and annotation
Section titled “Titles, labels and annotation”- Lead with prose. One or two sentences before each chart say what it shows. The title can then name the measure: “Unemployment rate”.
- Subtitle. The unit and adjustment: “% of the labour force, seasonally adjusted”.
- Name the series in the text. Colour each series name in the paragraph with its token, and turn the legend off.
- Note and source. Under the chart in
--muted: the method or caveat, then the source.
Contrast
Section titled “Contrast”WCAG ratios against --surface, from Measure contrast. Text
needs 4.5:1, series 3:1; --line is checked against the 1.4 surface guide.
| Token | Light | Ratio | Dark | Ratio |
|---|---|---|---|---|
--ink |
#1a1a1a |
17.40 | #ececec |
15.32 |
--muted |
#626262 |
6.10 | #a0a0a0 |
6.92 |
--line |
#d6d6d6 |
1.45 | #333333 |
1.43 |
--series-1 |
#2166ac |
5.90 | #6aa9e6 |
7.26 |
--series-2 |
#c7432b |
4.92 | #f07b62 |
6.65 |
--series-3 |
#6b6b6b |
5.33 | #9a9a9a |
6.43 |
Not available
Section titled “Not available”See App limitations: no uncertainty interval that follows a series or error bars; no gridline styling; no annotations anchored to a data point, reference lines or shaded periods on the dimension axis; chart text, including axis figures, stays in Roboto.
Use fixed shaded measure-axis bands for reference ranges and line-end labels on vertical, unstacked line charts.
Pairs well with
Section titled “Pairs well with”- Layouts: Long-form, Master–detail, Map-led.
- Experts: Tufte, Kirk.
Related
Section titled “Related”- Theming: tokens, dark theme, fonts and chart palettes.
- Visualization operations: every operation per chart type.
- Long-form layout: sections and alternating text and charts.