Pivot Table
Introduction
Astrato’s Pivot Table allows you to dynamically slice and dice your data, drilling down and through the data in an interactive display.
Customization options allow you to highlight the data, improve your table visualization, and let your data tell the story you need to share.
-
Known Limitations
-
Pivot Table Special Properties
-
Sort by Measure
-
Pivot Table Special Properties
Section titled “Pivot Table Special Properties”Astrato’s pivot table elevates our existing table features, with more grouped dimension values that aggregate across the top and the left-hand side.
The pivot table lets users display a dimension across the top to create a grid-like table visualization. You can view cross-sections of data with first and second-layer data filters.
Sort by Measure
Section titled “Sort by Measure”Sorting the pivot table display by measure enables the creation of tables that display critical information at the top.
When sorting a table by measure, it takes precedence over other sorting definitions.
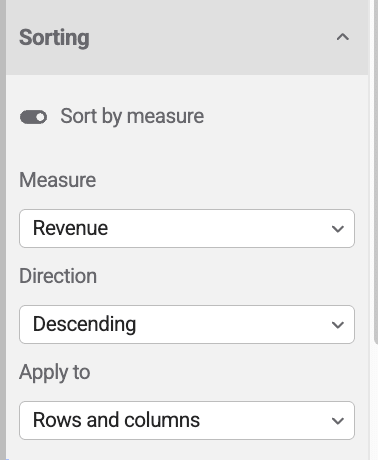
To enable sorting by measure, you turn on the switch.
Then you define these parameters:
-
Measure- select one of the measures that are used in the pivot table
-
Direction- set the direction of sorting by the measure
-
Apply to- choose between sorting by measure, both the row and column dimensions, or only the row dimensions.
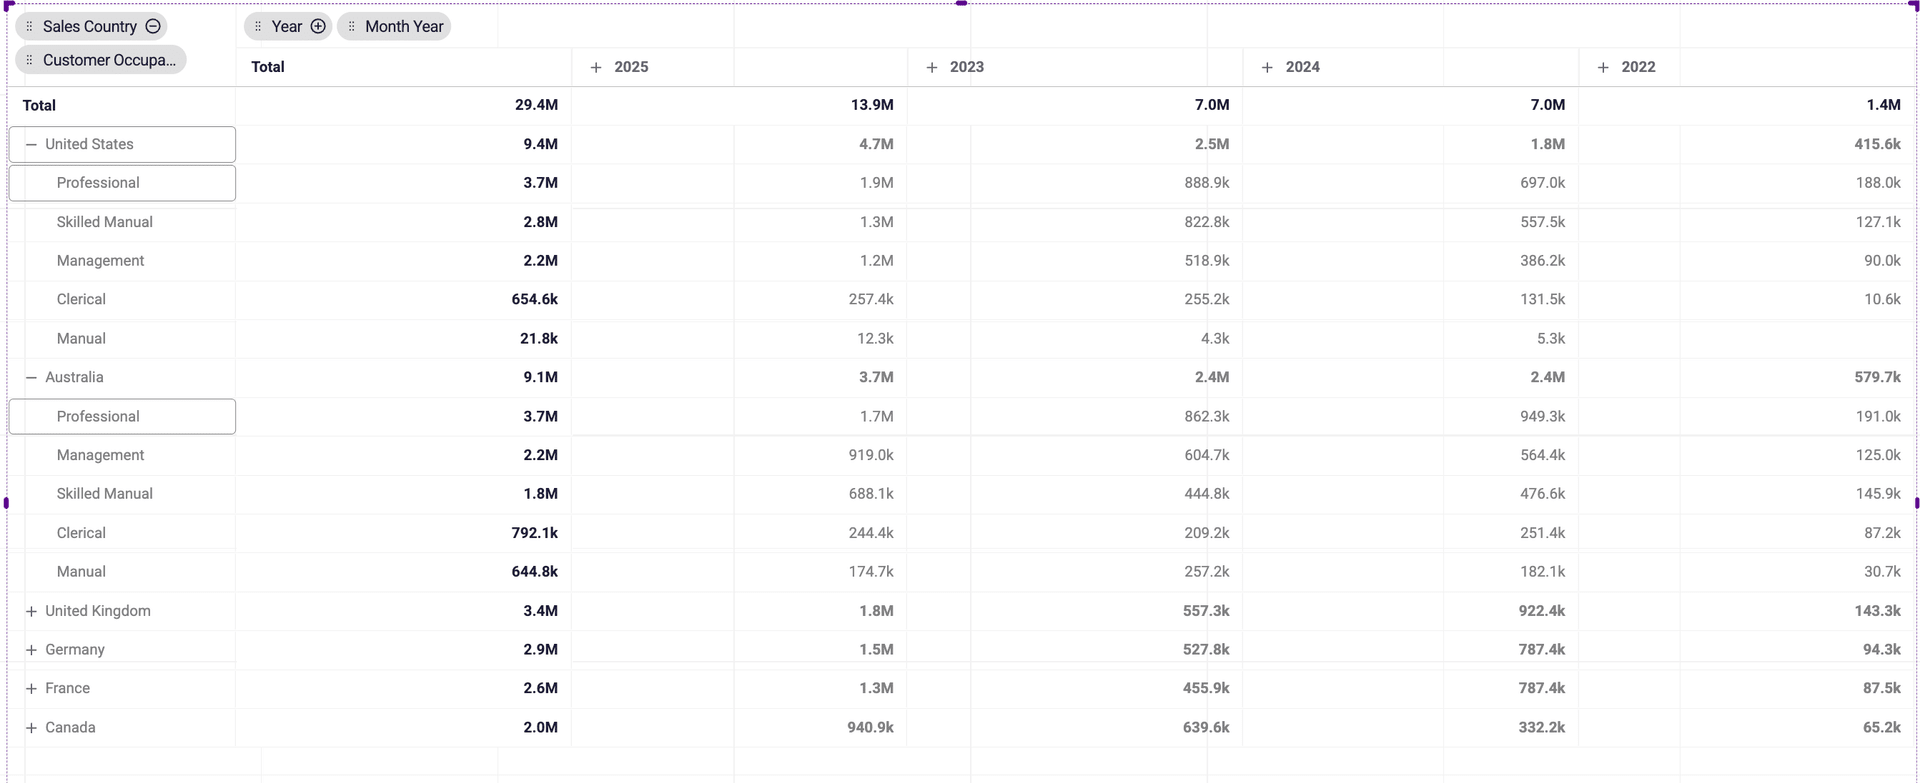
Sorting is applied to all dimensions, including internal dimensions.
The image below shows a table sorted with the setting above.
Totals
Section titled “Totals”Enable grand total for columns and rows in the Data tab of the properties panel.
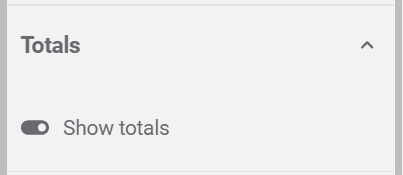
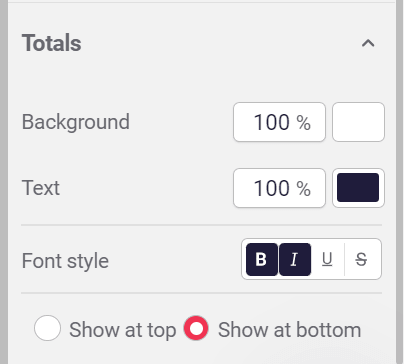
Modify the grand totals, font, colors, and position in the Style tab of the properties panel.
Always Fully Expended
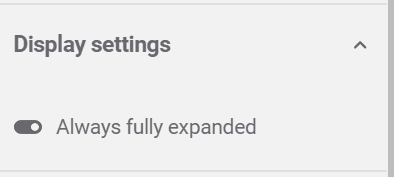
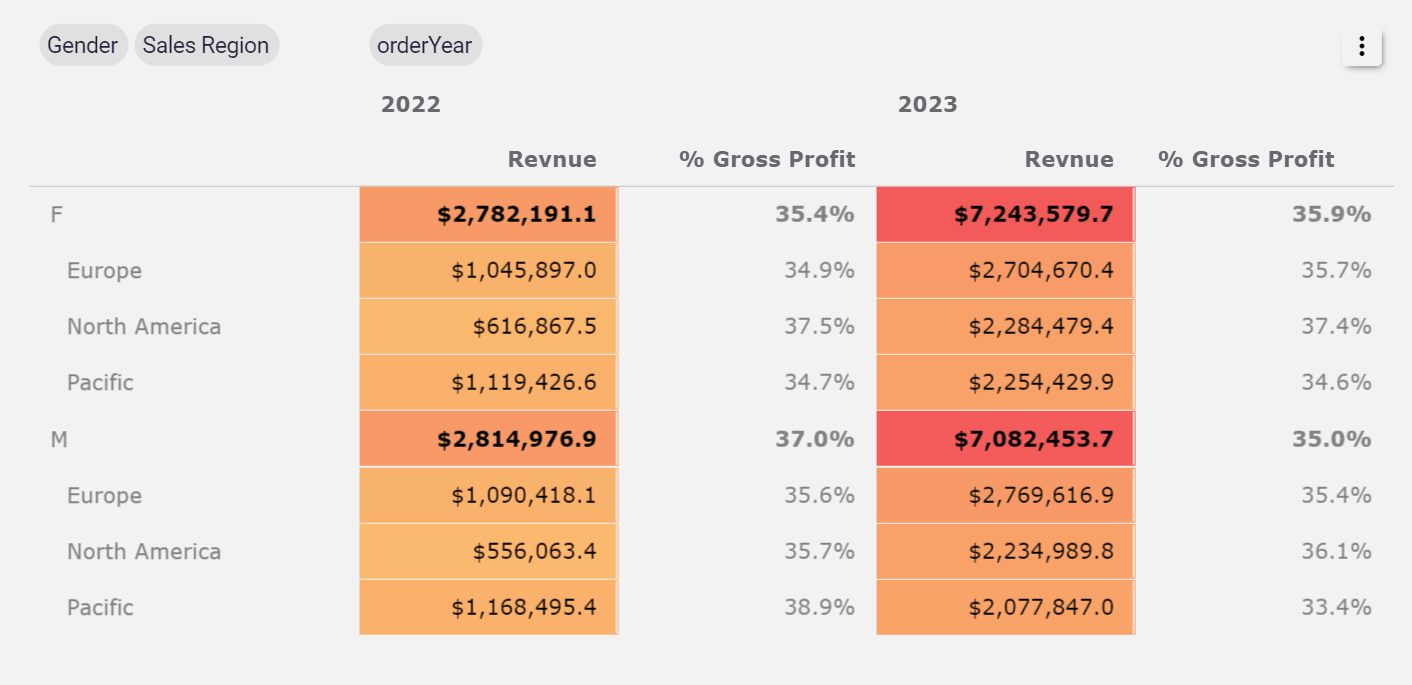
Section titled “Always Fully Expended”Enable the always fully expended mode in the Data tab of the properties panel to get a table that looks like the figure below
Measures as Rows
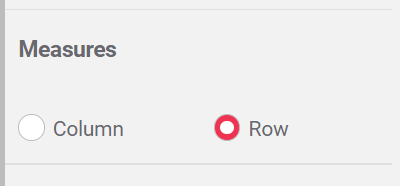
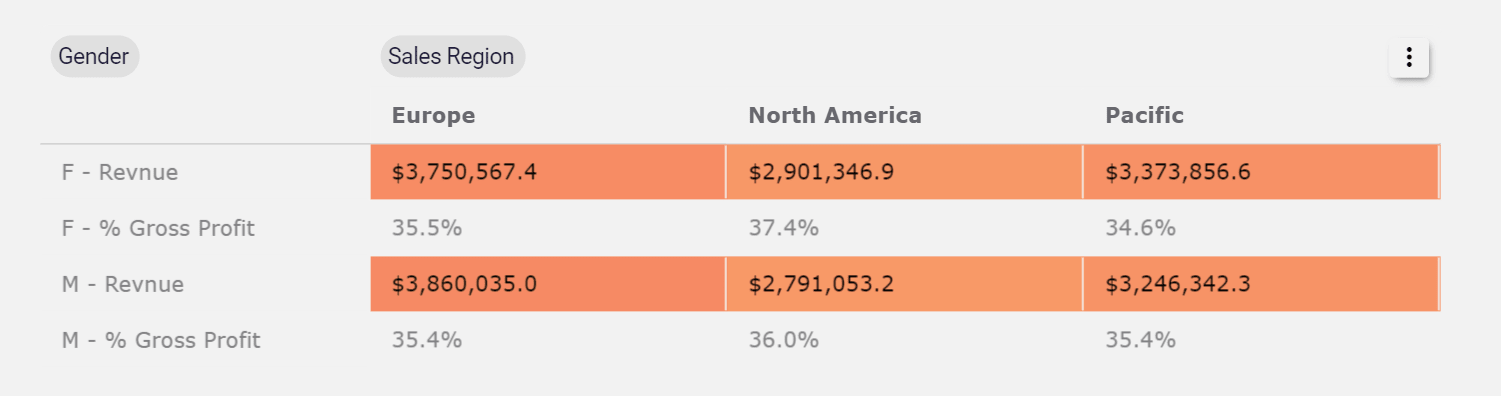
Section titled “Measures as Rows”Set the measures positions between rows and columns in the Layout tab of the properties panel.