

Narrative
A narrative is a sentence that states what the numbers show: “Sales rose 6% against last year, led by Beverages.” Every number and name in it comes from a query and follows the applied selections. It sits under the header as a page summary, in a card’s subtitle, or as the lead of a long-form section.
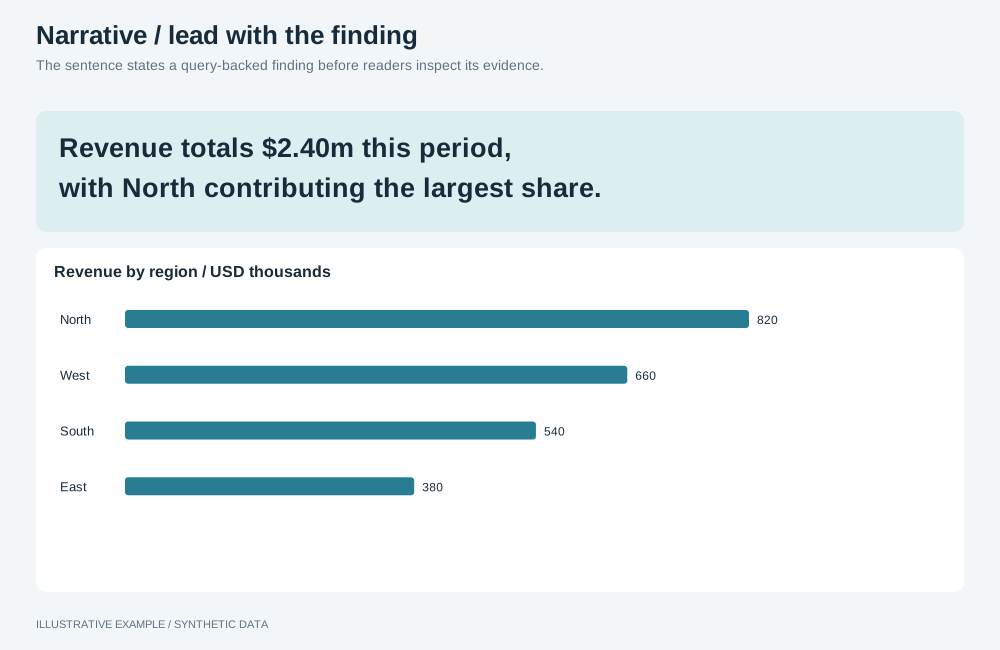
Illustrative example with synthetic data. The sentence states a query-backed finding before readers inspect its evidence.
Choose what the sentence says
Section titled “Choose what the sentence says”State the strongest thing the data supports. A finding does not need a stored comparison measure:
| The data has | The sentence can say | Example |
|---|---|---|
| A change measure | What moved, by how much and what drove it | “Sales rose 6% against last year, led by Beverages.” |
| A date field and no change measure | The latest period’s value beside the previous one’s | “Revenue 1.2M in April, down from 1.4M in March.” |
| A breakdown and no date field | Who leads and how far ahead of the next | “Germany leads net sales at 286K, ahead of France at 251K.” |
| Neither | The figure with its unit, period and coverage | “Sales 1.2M across all recorded orders.” |
Use a value only if the measure can split by that date field or dimension; a measure that cannot reach it returns its total under an empty value rather than an error. Check whether the latest period is complete before comparing it. Leave a partial period out of the sentence, or compare it like for like. State an association as an association, and a cause only when a field in the layer supports it.
Choose a placement
Section titled “Choose a placement”Use a narrative when readers need the conclusion before the chart. For one number with its change, use a KPI card; for text that holds for every selection, use the card’s static title or note.
- Does the sentence summarise the whole page? Use the page summary.
- Does it describe one chart in one line? Use the card subtitle.
- Does it introduce a long-form section? Use the section lead.
| Placement | Length | Use cases | Choose another when |
|---|---|---|---|
| Page summary | One or two sentences, two lines at most | Monthly review: total against last year and the category that drove it | The sentence is about one chart |
| Card subtitle | One short sentence | Revenue by week: “Down 4% on the previous 4 weeks” | The subtitle must also state the unit and scope, and there is no room for both |
| Section lead | Two or three sentences | A churn section: the rate, its change and the segment with the highest rate | The page is not long-form |
Markup
Section titled “Markup”<!-- Page summary: under the header, above the board --><p class="summary" id="page-summary" aria-live="polite">Sales rose 6% against last year, led by Beverages.</p>
<!-- Card subtitle --><figcaption> <h2 class="chart-title">Revenue by week</h2> <p class="chart-subtitle">Down 4% on the previous 4 weeks</p></figcaption>
<!-- Section lead, in a long-form pair --><div class="pair__text"> <h2 id="churn-title">Churn by tenure</h2> <p class="lead">Churn fell to 3.1% from 3.4% last quarter. Customers in their first year churn most.</p></div>- Use a
<p>, not a heading, so the page outline does not change with the data. - Make only the page summary a live region; cards updating together would each announce.
- Keep the card’s title static when its subtitle is a narrative.
- Write the sentence into your own element.
simpleTextObjecttakes no query data; see App limitations.
The page summary has a fixed height, which the board subtracts as a band above it. The card subtitle and the section lead use the card’s and the layout’s own rules.
:root {  /* 2 lines × 24px */  --summary-line: 24px;  --summary-h: calc(2 * var(--summary-line));}
.summary {  box-sizing: border-box;  height: var(--summary-h);  margin: var(--gap) var(--gap) 0;  overflow: hidden;  line-height: var(--summary-line);  color: var(--ink);  text-wrap: pretty;}
/* Where the layout scrolls, the summary can take the lines it needs. */@media (width < 700px) { .summary { height: auto; min-height: var(--summary-h); }}- Add
var(--summary-h) + var(--gap)to--above-boardand 64px to the scrolling threshold, for example 728 + 64 = 792. - Keep the summary short enough for two lines at the narrowest fixed-height width, and replace 700px with the width below which your layout scrolls.
- When the summary leads the page, raise its size and
--summary-lineuntil the app’s name no longer outranks it. - In a card subtitle, put the number first so a truncated sentence keeps it.
Build the sentence from rules
Section titled “Build the sentence from rules”Write one template per case and pick it with explicit rules. Format numbers with the app’s one locale; see Numbers: pin one locale.
const LOCALE = 'en-GB'; // the app's one localeconst percent = new Intl.NumberFormat(LOCALE, { style: 'percent', maximumFractionDigits: 0 });const amount = new Intl.NumberFormat(LOCALE, { notation: 'compact', maximumFractionDigits: 1 });
// Under 0.5% reads as flat; at 0.5% and above the rounded percentage is at least 1%.const FLAT = 0.005;
interface Total {  current: number | null;  previous: number | null;}interface Part {  name: string;  current: number | null;  previous: number | null;}
const capitalise = (text: string) => text.charAt(0).toUpperCase() + text.slice(1);
function changeSentence(measure: string, comparison: string, total: Total, parts: Part[]): string {  const { current, previous } = total;  if (current === null) return `No ${measure} for the current selections.`;  if (previous === null) return `${capitalise(measure)} ${amount.format(current)}; no ${comparison} to compare with.`;
  const difference = current - previous;  // A percentage of a zero or negative base misleads; state the difference instead.  if (previous <= 0) {    if (difference === 0) return `${capitalise(measure)} unchanged on ${comparison}.`;    const word = difference > 0 ? 'up' : 'down';    return `${capitalise(measure)} ${amount.format(current)}, ${word} ${amount.format(Math.abs(difference))} on ${comparison}.`;  }
  const change = difference / previous;  if (Math.abs(change) < FLAT) return `${capitalise(measure)} flat against ${comparison}.`;
const word = change > 0 ? 'rose' : 'fell'; const leader = parts .flatMap((part) => part.current === null || part.previous === null ? [] : [{ name: part.name, delta: part.current - part.previous }], ) .filter((part) => Math.sign(part.delta) === Math.sign(difference)) .sort((a, b) => Math.abs(b.delta) - Math.abs(a.delta))[0]; const led = leader && parts.length > 1 ? `, led by ${leader.name}` : ''; return `${capitalise(measure)} ${word} ${percent.format(Math.abs(change))} against ${comparison}${led}.`;}| Case | Rule | Example |
|---|---|---|
| No current value | current === null |
“No sales for the current selections.” |
| No comparison value | previous === null |
“Sales 1.2M; no last year to compare with.” |
| Zero or negative base | previous <= 0 |
“Profit 40K, up 90K on last year.” |
| Flat | |change| < 0.5% |
“Sales flat against last year.” |
| Rise or fall | Sign of the change | “Sales rose 6% against last year, led by Beverages.” |
- Direction words come from the sign, not from whether the change is good; see Deltas and indicators.
- The leader moves in the same direction as the total; leave the clause out when none does.
- Test every row of the table, including a selection that leaves no rows.
Without a change measure
Section titled “Without a change measure”Read the two rows you need with one query, ordered and limited as
Query shapes shows: newest period first, or largest value first, with
limit: 2. State both values as they arrive. Do not compute a difference or a percentage in the app;
see Show only governed figures. Format a period
before using it, because a date can arrive as epoch milliseconds; see
Reading the answer. These templates reuse amount and
capitalise from the example above.
interface Row {  name: string; // a period label or a dimension value  value: number;}
function periodSentence(measure: string, [latest, previous]: Row[]): string {  if (!latest) return `No ${measure} for the current selections.`;  const head = `${capitalise(measure)} ${amount.format(latest.value)} in ${latest.name}`;  if (!previous) return `${head}; no earlier period to compare with.`;  if (latest.value === previous.value) return `${head}, unchanged on ${previous.name}.`;  const word = latest.value > previous.value ? 'up from' : 'down from';  return `${head}, ${word} ${amount.format(previous.value)} in ${previous.name}.`;}
function leaderSentence(measure: string, [first, second]: Row[]): string {  if (!first) return `No ${measure} for the current selections.`;  const head = `${first.name} leads ${measure} at ${amount.format(first.value)}`;  if (!second) return `${head}.`;  const word = first.value === second.value ? 'level with' : 'ahead of';  return `${head}, ${word} ${second.name} at ${amount.format(second.value)}.`;}
Query on applied changes
Section titled “Query on applied changes”Query the total and the breakdown, and re-query on applied changes only; see Re-query your own objects only on applied changes.
import type { AstratoAppRuntime } from '@astrato-io/app-runtime';
declare const app: AstratoAppRuntime; // from createAstratoApp()declare const categoryKey: string; // keys looked up by namedeclare const salesKey: string;declare const salesLastYearKey: string;// The applied VALUE selections as query filters.declare function toQueryFilters(applied: readonly unknown[]): unknown;
const rowsOf = (result: unknown): unknown[][] => {  const data = (result as { response?: { data?: unknown } } | null)?.response?.data;  if (typeof data !== 'object' || data === null) return [];  return Object.values(data).filter(Array.isArray);};const numberOrNull = (value: unknown) => (typeof value === 'number' && Number.isFinite(value) ? value : null);
const summary = document.querySelector<HTMLElement>('#page-summary');if (!summary) throw new Error('Page summary not found.');
let latest = 0;
const refreshSummary = async (applied: readonly unknown[]) => {  const request = ++latest;  summary.setAttribute('aria-busy', 'true');  const calculations = [{ itemKey: salesKey }, { itemKey: salesLastYearKey }];  const filters = toQueryFilters(applied);  try {    const [totalResult, partResult] = await Promise.all([      app.client.services.engine.getData({        semanticLayerId: app.dataBinding.semanticLayerId,        query: { dimensions: [], calculations, filters },      }),      app.client.services.engine.getData({        semanticLayerId: app.dataBinding.semanticLayerId,        query: { dimensions: [{ itemKey: categoryKey }], calculations, filters },      }),    ]);    if (request !== latest) return; // superseded
// Columns by the position asked for: dimensions first, then calculations. const [totalRow] = rowsOf(totalResult); const total = { current: numberOrNull(totalRow?.[0]), previous: numberOrNull(totalRow?.[1]) }; const parts = rowsOf(partResult).flatMap((row) => typeof row[0] === 'string' ? [{ name: row[0], current: numberOrNull(row[1]), previous: numberOrNull(row[2]) }] : [], ); summary.textContent = changeSentence('sales', 'last year', total, parts); } catch (error) { if (request !== latest) return; console.error('Summary query failed', { calculations, filters }, error); summary.textContent = 'The summary could not be loaded.'; } finally { if (request === latest) summary.removeAttribute('aria-busy'); }};- Query the total separately; a margin or an average is not the sum of its parts.
- Validate the columns before use; see Reading the answer.
- Keep the previous sentence while loading, so the text does not change twice per update.
- Write with
textContent: dimension values are data, not markup. - The App has no text-generation service; build every sentence from templates. See App limitations.