

Table-first layout
A table-first page gives most of its area to one table; everything else filters it, summarises it or changes what it shows. Reflow rules, grid traps and the shared tokens are in Layout and responsiveness.
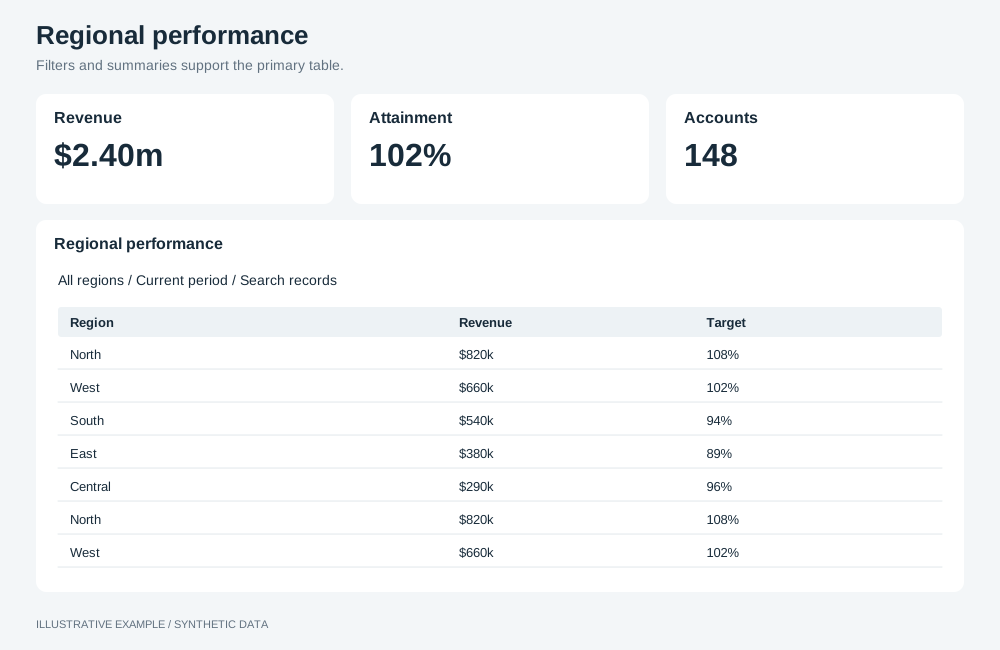
Illustrative example with synthetic data. Filters and summaries support the primary table.
When to use a table-first layout
Section titled “When to use a table-first layout”Use it when readers compare rows or look up records: league tables, quota attainment by region, purchase-order and invoice lists.
| The page is mainly | Use instead |
|---|---|
| Headline numbers, then the charts that explain them | KPI-led |
| One item at a time, picked from a list | Master–detail |
| Many identical metric or item cards | Card grid |
Choose a variant
Section titled “Choose a variant”- Does selecting a KPI change the measure the table shows? Use KPI column + table.
- Is the table a list of records that readers filter, search or export? Use report.
- Otherwise, for a fixed set of rows compared on the same measures, use scorecard.
| Variant | Layout | Use cases |
|---|---|---|
| Scorecard | One table filling the page, with sparklines, bars and deltas in the rows | League table with a form sparkline per team. Sales against quota by region |
| Report | A filter bar and a row of counts over a full-height table | Purchase orders under counts of open, awaiting approval, overdue and received |
| KPI column + table | KPIs stacked on the left, each switching the table’s measure | Product performance: revenue, margin, units or returns by product and month |
Shared structure
Section titled “Shared structure”- While the page fits the window, the table takes the rest of the board and scrolls internally.
- When the page scrolls, give the table a fixed height (
--table-min) that shows its header row and a chosen number of rows. - Fix the table’s row height with
setTableFixedRowHeightEnabledandsetTableFixedRowHeightValue(table operations), so the floor holds the rows it was calculated for. Column widths, headings and totals are in Tables.
:root {  /* Title and padding, a 40px header row, ten 36px rows: 52 + 40 + 10 × 36 = 452.     Measure the header row at your narrowest width; wrapped headings make it taller. */  --table-min: calc(52px + 40px + 10 * 36px);}
.board {  display: grid;  gap: var(--gap);}.band {  display: grid;  gap: var(--gap);  min-height: 0;}
.board takes its fixed height from Bands above the board.
Scorecard
Section titled “Scorecard”┌───────────────────────────┐│ Team P W L Pts Form │├───────────────────────────┤│ ... . . . . ╱╲╱ ││ ... . . . . ╲╱╲ │└───────────────────────────┘A scorecard is read as a whole, so size its floor for all of its rows.
.board--scorecard {  /* Twelve rows: 52 + 40 + 12 × 36 = 524 */  --table-min: calc(52px + 40px + 12 * 36px);  grid-template-rows: minmax(0, 1fr);}
/* 64 + 2 × 16 + 524 = 620 */@media (height < 620px) {  .board--scorecard {    height: auto;    grid-template-rows: var(--table-min);  }}
The table fills the board at every width; below 620px tall the page scrolls and the table is 524px tall.
Report
Section titled “Report”┌───────────────────────────┐│ Filters │├──────┬──────┬──────┬──────┤│ Open │Await │Overdu│Recvd │├──────┴──────┴──────┴──────┤│ PO Supplier Amount Due││ ... │└───────────────────────────┘- Use two or four counts, so they fold 4 → 2 in complete rows.
- To filter the table from a count, make each count a button that writes a selection on the status field; see Driving selections from your own UI.
- Keep the filter bar one row high; see Header and controls.
.board--report {  grid-template-rows: auto auto minmax(0, 1fr);}.filter-bar {  height: 52px;}.band--counts {  grid-template-columns: repeat(4, minmax(0, 1fr));  grid-auto-rows: 72px;}
/* 4 across: 64 + 2 × 16 + 52 + 16 + 72 + 16 + 452 = 704 2 across: 704 + 16 + 72 = 792 */@media (height < 704px), (width < 700px) and (height < 792px) { .board--report { height: auto; grid-template-rows: auto auto var(--table-min); }}@media (width < 700px) { .band--counts { grid-template-columns: repeat(2, minmax(0, 1fr)); }}| Width | Counts | Height |
|---|---|---|
| 700px and wider | 4 across | Fits the window from 704px tall |
| Under 700px | 2 across | Fits the window from 792px tall |
Below those heights the page scrolls and the table is 452px tall.
KPI column + table
Section titled “KPI column + table”┌───────┬───────────────────┐│ KPI ▸ │ Product Jan Feb │├───────┤ ... ││ KPI │ ... │├───────┤ ... ││ KPI │ ... │└───────┴───────────────────┘- Make each KPI a
<button>witharia-pressed. - Switch the measure on the mounted table with
changeColumnFieldrather than mounting one table per KPI, and check the result; see Check operation results.
.board--kpi-table {  grid-template-columns: minmax(0, 3fr) minmax(0, 7fr);}.kpi-stack {  display: grid;  grid-template-rows: repeat(4, minmax(0, 1fr));  gap: var(--gap);  min-height: 0;}
/* Width: a 640px table, 15 for a classic scrollbar: 640 / 0.7 + 2 × 16 + 16 + 15 ≈ 977.3. Height: the taller column decides; the table's 452 beats the KPIs' 4 × 96 + 3 × 16 = 432. 64 + 2 × 16 + 452 = 548. */@media (width >= 978px) and (height < 548px) { .board--kpi-table { height: auto; grid-template-rows: var(--table-min); }}@media (width < 978px) { .board--kpi-table { height: auto; grid-template-columns: minmax(0, 1fr); grid-template-rows: auto var(--table-min); } .kpi-stack { grid-template-rows: none; grid-template-columns: repeat(4, minmax(0, 1fr)); grid-auto-rows: minmax(var(--kpi-h), auto); }}@media (width < 700px) { .kpi-stack { grid-template-columns: repeat(2, minmax(0, 1fr)); }}| Width | KPIs | Table | Height |
|---|---|---|---|
| 978px and wider | Stacked in the left 30% | Right 70% | Fits the window from 548px tall |
| 700–977px | 4 across above the table | Full width, 452px tall | Scrolls |
| Under 700px | 2 across | Full width, 452px tall | Scrolls |