

Map
@astrato-io/visualizations has no map type: map is a Workbook-only object; see
Limitations and Visualization types.
No base map, tiles, pan, zoom, point markers, geocoding or region shapes come from the platform.
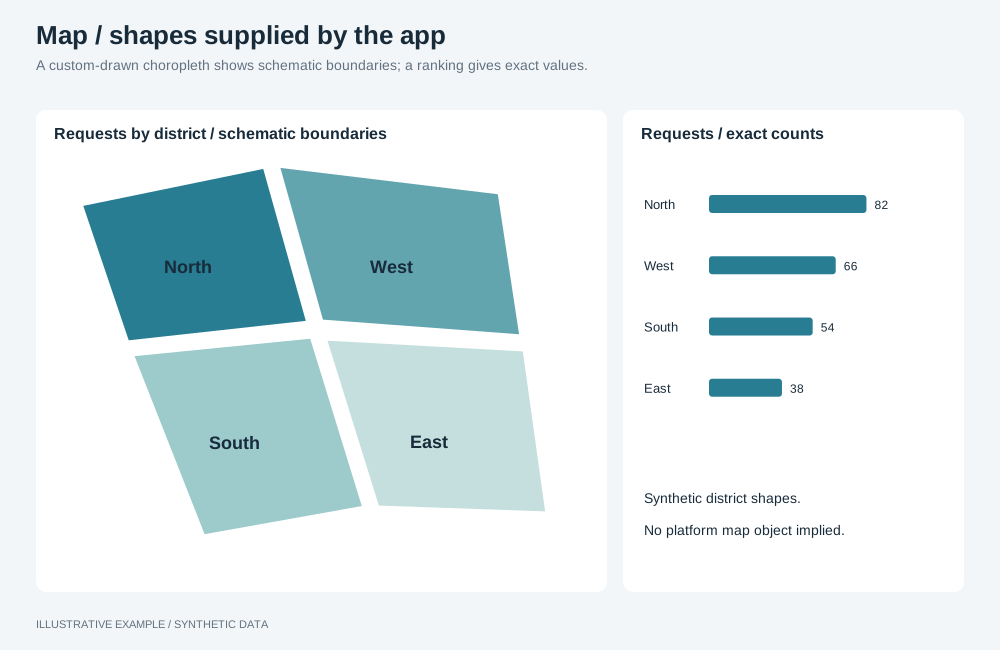
Illustrative example with synthetic data. A custom-drawn choropleth shows schematic boundaries; a ranking gives exact values.
Choose a component
Section titled “Choose a component”- Does the reader need ranks and exact values by place? Use a sorted bar chart or a table.
- Is the question where, across regions with boundaries, and can your app ship the region shapes? First verify current Astrato support and follow Chart rendering policy. Use the custom choropleth recipe below only after its exception requirements are met.
| Use | Common use cases | Choose another component when |
|---|---|---|
| Bar chart or table | Top ten regions by sales; every district with its change | The reader must see neighbours and clusters |
| Choropleth you draw | Requests by district; incidents per 1,000 residents by county | Regions differ so much in size that small ones cannot be seen or clicked |
Colour a rate or a share rather than a raw total when region populations differ.
Draw a choropleth yourself
Section titled “Draw a choropleth yourself”This recipe requires an authorized custom rendering exception under Chart rendering policy. The availability notes above do not replace verification against the installed package or your permission.
A map your app draws is one of your own objects: the platform supplies the data through a query you build; see Querying the engine. Put it in a card, as an SVG sized to the host, with the region shapes shipped as a static file.
- Query the region field and the measure; see Query shapes. Translate the applied selections into filters, leaving out the map’s own field, so selecting a region does not blank the others.
- Re-query on applied changes and ignore superseded results; see Re-query your own objects only on applied changes. Show loading and errors with object states.
- Match the shapes to the data. Key each shape by the value the query returns for the region field, and log rows with no matching shape during development.
- Use fixed bins chosen from the unfiltered data, so a colour means the same value after filtering. Draw the legend from the same bins.
- Write a selection on click with
selectValues, building the full value list first, and draw the selected state from the selection state, so selections from other controls show on the map; see Driving selections from your own UI. - Make every region reachable. Give each region an accessible name with its value. Offer the same regions as a list or table on the page, so small regions can be selected without aiming.
- Colour from CSS tokens, such as
fill: var(--map-1), so a theme switch recolours the map without script. Check the steps’ contrast in both themes; see Measure contrast.
declare const REGION: string; // field key, looked up by namedeclare const SALES: string; // stored measure item keydeclare function toQueryFilters(applied: readonly unknown[]): unknown;declare function selectionFieldKey(selection: { field?: { fieldKey?: string }; fieldKey?: string }): string | undefined;
const mapQuery = (applied: readonly { field?: { fieldKey?: string }; fieldKey?: string }[]) => ({  dimensions: [{ fieldKey: REGION, name: 'Region' }],  calculations: [{ itemKey: SALES }],  filters: toQueryFilters(applied.filter((selection) => selectionFieldKey(selection) !== REGION)),});