

Visual essay style
A visual essay is a story the reader takes in by scrolling. Full-bleed sections alternate between two backgrounds, a playful display face sets the headings and a serif body face carries the text. Charts stay in view while short steps of text scroll past and change what the chart shows. It is modelled on the traits of interactive data essays such as those published by The Pudding. It does not use that publication’s name, logo or fonts.
Pair it with the long-form layout: its sticky chart with steps variant owns the step markup, CSS and script. This page covers colour, type, chrome and chart settings.
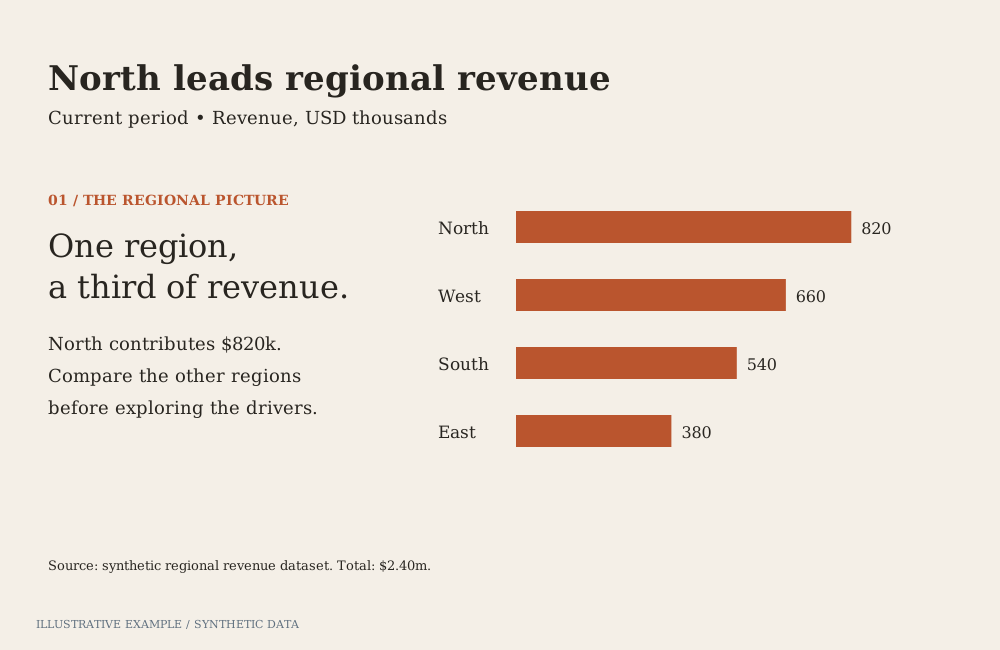
Illustrative example with synthetic data. A narrative composition with generous transitions.
When to use this style
Section titled “When to use this style”Use it when the page is read once, in order, by a broad audience, and the story needs a few charts that build on each other.
| The page is mainly | Use instead |
|---|---|
| Several chart forms to browse, in no fixed order | Information is Beautiful |
| Charts for a business audience, one takeaway each | Storytelling with data |
| Dense, sourced analysis in standard chart forms | Economist or Financial Times |
| Indicators read beside prose, without a narrative | Explainer |
| A dashboard that looks like the tenant’s Workbooks | Astrato default |
| Read again, compared section by section, or printed | Any other style on the long-form sections variant |
Use cases
Section titled “Use cases”| Use case | Example | Steps |
|---|---|---|
| Cultural data story | What a city streamed this year, by genre | All genres; then weekends only; then the top five |
| Public product-launch results | Sign-ups and activation by week since launch | Sign-ups alone; then with activation; then one region |
| Yearly review | A community’s year in five findings | One section per finding; steps inside a section narrow it to the months it covers |
Tokens
Section titled “Tokens”Define light and dark in one block; see Define colour tokens.
--band is the second section background; --highlight is the colour a step brings forward and
--context the colour of every other measure. Spacing (--gap, --header-h, --chart-min) comes
from the long-form layout.
:root {  --page: #fdf8f0;  --band: #f1e6d4;  --line: #c9b89c;  --ink: #1f1a14;  --muted: #5e5548;  --highlight: #bf1d53;  --context: #8a8174;
  --font-display: 'Bricolage Grotesque', system-ui, sans-serif;  --font-body: 'Source Serif 4', Georgia, serif;
  --bleed-pad: clamp(48px, 10vh, 120px);  --measure: 38rem;  --radius: 12px;}:root[data-theme='dark'] {  --page: #16131b;  --band: #27212f;  --line: #4a4257;  --ink: #f5efe6;  --muted: #b8afa3;  --highlight: #ff5c8a;  --context: #7b7386;}
Bricolage Grotesque and Source Serif 4 are openly licensed and served by Google Fonts; see Load visualization fonts.
| Role | Font | Size and weight |
|---|---|---|
| Essay title | --font-display |
clamp(44px, 8vw, 112px), 800 |
| Section title | --font-display |
clamp(28px, 4vw, 44px), 700 |
| Byline and chart note | --font-display |
15px, 500, --muted |
| Body and steps | --font-body |
19px, 400, line height 1.6 |
For charts that colour by category, use this palette; the first colour is --highlight.
export const series = { light: ['#bf1d53', '#1f6f8b', '#a65400', '#5b3fa8'], dark: ['#ff5c8a', '#4cc3e0', '#ffa347', '#b89cff'],};Page and card chrome
Section titled “Page and card chrome”Sections run the full width of the window; their text keeps a readable measure. Step cards are the only cards: a thin border, a radius and the section’s background, with no shadow.
body {  margin: 0;  background: var(--page);  color: var(--ink);  font: 400 19px / 1.6 var(--font-body);}
.bleed {  background: var(--section-bg, var(--page));  padding: var(--bleed-pad) max(var(--gap), calc((100% - 72rem) / 2));}.bleed--tint {  --section-bg: var(--band);}.bleed > .prose {  max-width: var(--measure);  margin-inline: auto;}
.display {  margin: 0;  font: 800 clamp(44px, 8vw, 112px) / 0.95 var(--font-display);  letter-spacing: -0.02em;}.section-title {  margin: 0 0 12px;  font: 700 clamp(28px, 4vw, 44px) / 1.05 var(--font-display);}.byline,.chart-note {  color: var(--muted);  font-family: var(--font-display);  font-weight: 500;  font-size: 15px;}.mark {  color: var(--highlight);  font-weight: 700;}
/* The long-form step card, restyled. Load after the long-form CSS. */.step__card { max-width: 24rem; padding: 20px 24px; background: var(--section-bg, var(--page)); border: 1px solid var(--line); border-radius: var(--radius);}.step[data-active] .step__card { border-color: var(--highlight);}- Alternate
.bleedand.bleed.bleed--tintdown the page. The tint sets--section-bgonce, and the section and its step cards read it. - Round chart hosts on the host with
overflow: hidden; see Rounded corners. Keepoverflowvisible on the sticky chart’s ancestors, as the long-form variant explains.
Change a chart as the reader scrolls
Section titled “Change a chart as the reader scrolls”Use sticky chart with steps. Each step applies a selection, operations or both, and carries the chart’s complete state. Good step changes in this style:
- Narrow the data with a selection: one period, one region, one group.
- Bring a measure forward:
setMeasureGraphColorwith--highlighton that measure and--contexton the others. - Show values with the type’s data-label operation once the reader should read them.
Write each step so it states its finding in words, so a reader who does not see the chart change
still gets the story. Transitions the page adds sit inside
@media (prefers-reduced-motion: no-preference); do not add scroll-behavior: smooth or scroll
snapping outside it.
Charts
Section titled “Charts”Charts start in the built-in light theme; colour each with its own operations. On every chart that
has them, set axis and legend text to --muted and axis lines to --line with setAxisLabelColor,
setAxisTitleColor, setAxisLineColor, setAxisTickColor and setLegendItemLabelFill.
| Type | Use it for | Operations to set |
|---|---|---|
bar |
Categories | setColoringColor --context for one measure, or setMeasureGraphColor per measure; setBarChartBarRadius; setMeasureDataLabelsShow; setShowAxisTicks false |
line |
Change over time | setMeasureGraphColor --highlight on the key measure, --context on the others; setMeasureLineSize; setLineType; setMeasureDataLabelsShow with setMeasureDataLabelDensity |
scatter |
Items on two measures | setColoringType categorical, setCustomPaletteColors with the series palette; setShowDataLabels; setDataLabelDensity; setDataLabelTextColor |
dot |
Before-and-after or two-group comparisons | setColoringType categorical, setCustomPaletteColors with the series palette; setOrientation |
pie |
A share of one whole, two or three parts | setColoringType categorical, setCustomPaletteColors; setPieChartType donut; setBorderColor with the section’s background (--page or --band); setPieLabelColor; setPieMeasureLabelFormat percentage |
number |
A headline figure between sections | setNumberFontFamily Bricolage Grotesque; setNumberFontWeight; setNumberFontColor --highlight |
Titles, labels and annotation
Section titled “Titles, labels and annotation”- Title each section with its finding, in the display face.
- Name series in the text. Colour the words that name the highlighted measure with
.mark, and turn the legend off when the text names every coloured series. - Annotate in the steps. Each step is one or two sentences pointing at one part of the chart.
- Label values directly with data labels, instead of relying on tooltips.
- Put the source and method in a
.chart-noteafter the section, or in one closing section.
Contrast
Section titled “Contrast”WCAG ratios from Measure contrast, on both section backgrounds.
Text needs 4.5:1, series and --context 3:1; the surfaces are checked against the 1.15 and 1.4 guides.
| Pair | Light, --page |
Light, --band |
Dark, --page |
Dark, --band |
|---|---|---|---|---|
--page against --band |
1.17 | — | 1.18 | — |
--line against the background |
1.84 | 1.57 | 1.93 | 1.64 |
--ink |
16.33 | 13.99 | 16.07 | 13.66 |
--muted |
6.92 | 5.93 | 8.48 | 7.21 |
--highlight (text and series 1) |
5.65 | 4.84 | 6.25 | 5.32 |
--context |
3.63 | 3.11 | 4.06 | 3.45 |
| Series 2 | 5.36 | 4.59 | 8.91 | 7.58 |
| Series 3 | 5.11 | 4.37 | 9.26 | 7.87 |
| Series 4 | 7.30 | 6.25 | 8.08 | 6.87 |
Not available
Section titled “Not available”See App limitations: no colour for a named category value, so a step cannot highlight one bar or one category; no notes or reference lines on the plot; chart text stays in Roboto; no animated transition between chart types.
Use chart animation controls to apply reduced motion and line-end labels on vertical, unstacked line charts.
Pairs well with
Section titled “Pairs well with”| Kind | Page | Why |
|---|---|---|
| Layout | Long-form: sticky chart with steps | The step pattern this style dresses |
| Layout | Long-form: reveal on scroll | Charts mount just before they are reached |
| Expert | Kirk | Framing a story for its audience and choosing what to annotate |
Related
Section titled “Related”- Theming: tokens, chart palettes, fonts and contrast.
- Hidden means unmounted: mount charts as the reader approaches them.
- Visualization operations: every operation per type.