

Ops wall layout
An ops wall is a screen on a large display, read from across a room: status tiles with counts, small trend charts and, where operators act on events, a table of the latest ones. It fits one viewport and does not scroll. The sizing rules are in Layout and responsiveness.
An unattended, always-on page is not supported: mounted objects have no periodic refresh, and hosted sessions are limited in length. See App limitations and Hosted app sessions.
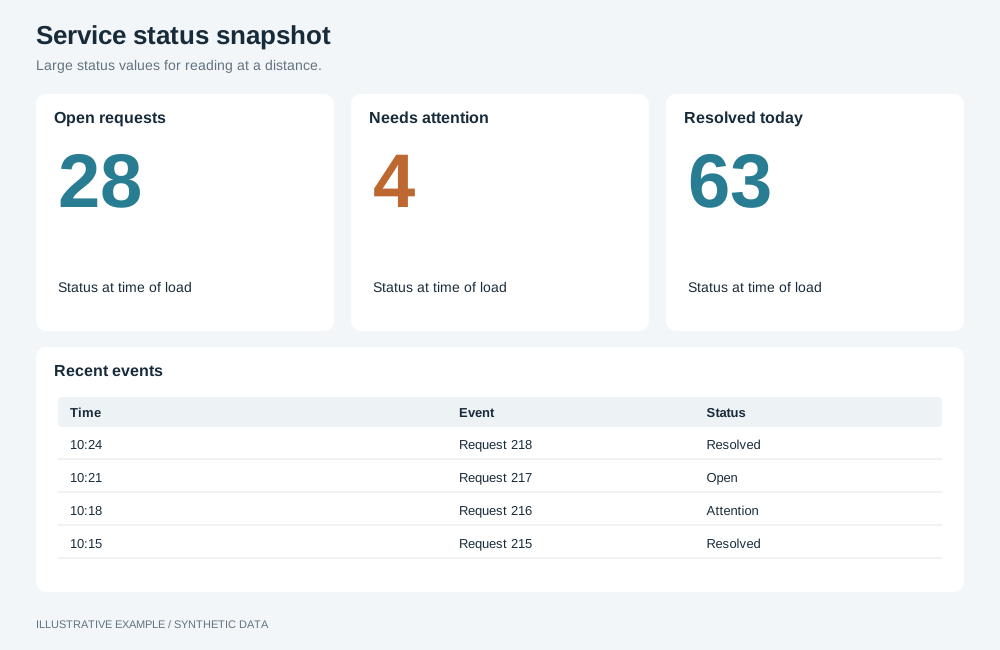
Illustrative example with synthetic data. Large status values for reading at a distance.
When to use an ops wall layout
Section titled “When to use an ops wall layout”Use it for a shared display that shows where things stand now: a service desk wall, a logistics control room, a booking status board.
| The page is mainly | Use instead |
|---|---|
| Headline numbers and charts, read at a desk | KPI-led |
| Many identical cards to browse | Card grid |
| Rows of records to read, sort or export | Table-first |
Choose a variant
Section titled “Choose a variant”- Do operators act on individual events as they arrive? Use status grid + event feed.
- Otherwise, use status grid.
| Variant | Layout | Use cases |
|---|---|---|
| Status grid | Eight status tiles in two rows of four, then two trend charts | Service desk: open tickets, SLA breaches and unassigned tickets, with tickets opened per hour |
| Status grid + event feed | Six tiles and three trend charts on the left, the latest events on the right | Logistics: late shipments and open exceptions, with the latest exceptions by time and carrier |
Shared structure
Section titled “Shared structure”- Fit one viewport. Scale one composition to the display; see Scale one composition.
- Nothing depends on hover. Put everything a reader needs in the tile itself.
- Do not show status by colour alone. State it as a word and a shape icon beside the colour; see Deltas and indicators.
- Set the wall’s scope as configuration, in static filters in the definitions, not in selections; see Filters: how selections reach the query.
- Choose KPI presentation for the wall’s needs: native number objects or ordinary app UI. The app-rendered card example shows the latter. Trend charts and analytical tables follow the chart rendering policy.
- Size object text with operations. The root font size does not reach text inside objects. Set
it per type, for example
setTableBodyFontSizeon a table orsetNumberFontSizeon a number; see the operations reference. Line and bar axis labels have no font-size operation; see App limitations. - Show the age of the data. Record when each of your responses arrives and show the oldest in the header, for example “Data as of 14:32”.
/* Drawn at 1920 × 1080: 0.8333vw = 16 / 1920, 1.4815svh = 16 / 1080.   The 32px cap is reached at 3840 × 2160. */html {  font-size: clamp(10px, min(0.8333vw, 1.4815svh), 32px);}
:root {  /* The shared 16px, 64px and 252px, in rem so they scale. */  --gap: 1rem;  --header-h: 4rem;  --chart-min: 15.75rem;  /* Example sizes; check them from the back of the room. */  --type-value: 3.5rem;  --type-label: 1.375rem;  --type-status: 1.25rem;}
.board {  display: grid;  gap: var(--gap);}
.tile {  display: grid;  grid-template-rows: auto minmax(0, 1fr) auto;  gap: 0.5rem;  padding: var(--gap);  border-left: 0.5rem solid var(--tile-status);  color: var(--ink);}.tile[data-status='normal'] {  --tile-status: var(--status-normal);}.tile[data-status='warning'] {  --tile-status: var(--status-warning);}.tile[data-status='breach'] {  --tile-status: var(--status-breach);}.tile__label {  margin: 0;  font: 600 var(--type-label) / 1.2 var(--font-ui, system-ui);}.tile__value {  align-self: center;  margin: 0;  font: 700 var(--type-value) / 1 var(--font-ui, system-ui);  font-variant-numeric: tabular-nums;}.tile__status {  margin: 0;  font: 600 var(--type-status) / 1.2 var(--font-ui, system-ui);}.tile__icon {  margin-right: 0.5rem;  color: var(--tile-status);}
.board takes its fixed height from Bands above the board.
Define the three status colours with the style’s colour tokens and
measure their contrast.
This schematic example shows an app-rendered tile with synthetic data. When using this approach, fill its value and status from live results.
<article class="tile" data-status="breach"> <h2 class="tile__label">Open P1 incidents</h2> <p class="tile__value">7</p> <p class="tile__status"><span class="tile__icon" aria-hidden="true">◆</span>Breach · target 0</p></article>Status grid
Section titled “Status grid”┌────────┬────────┬────────┬────────┐│ Tile │ Tile │ Tile │ Tile │├────────┼────────┼────────┼────────┤│ Tile │ Tile │ Tile │ Tile │├────────┴────────┼────────┴────────┤│ Trend A │ Trend B │└─────────────────┴─────────────────┘.board--status { grid-template-columns: repeat(4, minmax(0, 1fr)); grid-template-rows: minmax(0, 1fr) minmax(0, 1fr) minmax(0, 2fr);}.board--status > .trend { grid-column: span 2;}
/* The root reaches its 10px floor below 10 / 16 × 1920 = 1200 wide or 10 / 16 × 1080 = 675 tall. Show the reference size instead and let the page scroll. */@media (width < 1200px), (height < 675px) { html { font-size: 16px; } .board--status { height: auto; grid-template-columns: repeat(2, minmax(0, 1fr)); grid-template-rows: none; } .board--status > .trend { grid-column: 1 / -1; min-height: var(--chart-min); }}| Viewport | Tiles | Trend charts | Height |
|---|---|---|---|
| At least 1200 × 675px | 4 across in two rows | 2 across | Fits the window, scaled |
| Smaller, such as a laptop preview | 2 across | 1 across | Scrolls |
Status grid + event feed
Section titled “Status grid + event feed”┌──────┬──────┬──────┬─────────────┐│ Tile │ Tile │ Tile │ Latest │├──────┼──────┼──────┤ events ││ Tile │ Tile │ Tile │ Time Sev … │├──────┼──────┼──────┤ Time Sev … ││Trend │Trend │Trend │ Time Sev … │└──────┴──────┴──────┴─────────────┘- Sort the table by event time, descending, with a query limit of the rows that fit; definitions
support
sortingandquery-limit, see Definitions. For example, a 984px feed with 52px of title and padding, a 48px header row and 40px rows holds (984 − 52 − 48) ÷ 40 = 22 rows. - Fix the row height with
setTableFixedRowHeightEnabledandsetTableFixedRowHeightValue, so the limit holds. - Show each event’s status as text in its own column, not only as a cell colour.
<div class="board board--feed"> <div class="status"><!-- six tiles, then three trend cards with class="trend" --></div> <section class="feed" aria-labelledby="feed-title"><!-- title, then the table host --></section></div>.board--feed { grid-template-columns: minmax(0, 3fr) minmax(0, 2fr); grid-template-rows: minmax(0, 1fr);}.status { display: grid; grid-template-columns: repeat(3, minmax(0, 1fr)); grid-template-rows: minmax(0, 1fr) minmax(0, 1fr) minmax(0, 2fr); gap: var(--gap); min-height: 0;}
/* The same floor as the status grid. */@media (width < 1200px), (height < 675px) { html { font-size: 16px; } .board--feed { height: auto; grid-template-columns: minmax(0, 1fr); grid-template-rows: none; } .status { grid-template-columns: repeat(2, minmax(0, 1fr)); grid-template-rows: none; } .status > .trend { grid-column: 1 / -1; min-height: var(--chart-min); } /* 52px of title and padding, a 48px header row and ten 40px rows: 500px. */ .feed { height: 31.25rem; }}| Viewport | Tiles and trend charts | Feed | Height |
|---|---|---|---|
| At least 1200 × 675px | Left three-fifths, 3 across | Right two-fifths, full height | Fits the window, scaled |
| Smaller | Tiles 2 across, trend charts 1 across | Below, 500px tall | Scrolls |