

Alberto Cairo
Alberto Cairo’s approach treats a chart as an explanation that must not mislead, even when every number on it is correct. Books: The Functional Art (2012), The Truthful Art (2016) and How Charts Lie (2019).
Use it for pages that explain a finding to readers who did not do the analysis, such as reports shared outside the team. For other pages, see Choose an expert.
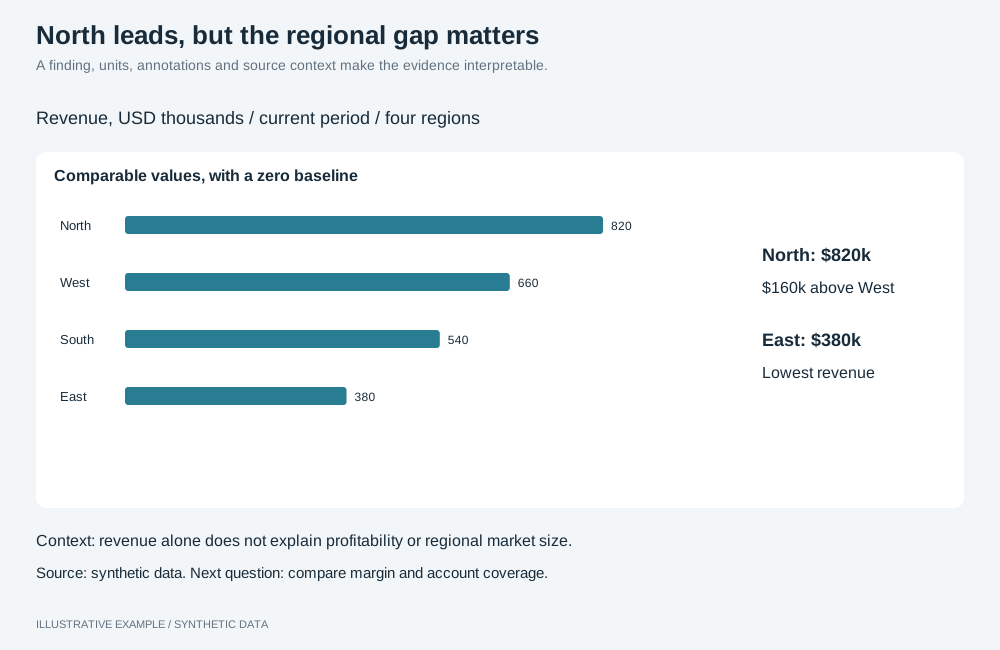
Illustrative example with synthetic data. A finding, units, annotations and source context make the evidence interpretable.
Check five qualities, in order
Section titled “Check five qualities, in order”A chart should be truthful, functional, beautiful, insightful and enlightening. A chart that is not truthful fails regardless of the rest.
| Quality | Check |
|---|---|
| Truthful | The data is sound and the encoding does not distort it |
| Functional | The form fits the reader’s task |
| Beautiful | One style throughout the App |
| Insightful | The chart shows something a table would not |
| Enlightening | The text beside the chart states what follows from the finding |
Choose the form from the task
Section titled “Choose the form from the task”| Task | Forms |
|---|---|
| Compare or rank categories | Sorted bar, dot |
| Change over time | line |
| Distribution | histogram |
| Two measures against each other | scatter, with a note on how to read it |
| Part of a whole | Stacked bar; pie for two or three parts |
| One value and its change | number with a comparison |
Guard against misleading charts
Section titled “Guard against misleading charts”| Risk | Check |
|---|---|
| Scale | Bars start at zero; check the rendered axis, and where it does not, show the values as a dot chart, which encodes position, not length. Compared measures share one axis; do not use changeMeasureAxis. |
| Units | Every value has its unit: setMeasureFormatType, setMeasureCurrency, and setAxisTitle where the chart title does not say it (bar). |
| Aggregation | The subtitle states the aggregation and grain. Change it with changeMeasureAggregation; show a share with setMeasureAdvancedCalculationType shareTotal (bar). |
| Selection | Show enough history to judge a change. When Top N hides items, group them with setTopNShowOthers (bar). Show gaps with setDataGapsHandling show (line). |
| Hidden filters | State each static filter (setStaticFilterGroup) in the note under the chart. |
| Uncertainty | State the range of an estimate in the note. Charts cannot draw an interval band. |
Annotate in layers
Section titled “Annotate in layers”Place each layer above the next, as the long-form layout does:
- Headline: the finding as a sentence, in host HTML or a text object.
- Subtitle: measure, unit, aggregation and period.
- Chart: labelled directly where a legend would need matching.
- Annotation: what to look at, beside the chart.
- Note: method, caveats, filters, uncertainty and source.
- Detail on demand: tooltips and a detail page.
Default to forms the audience already reads, and do not rely on colour alone; see Deltas and indicators.
Pairs with long-form and hub layouts, and the explainer, visual essay and storytelling with data styles.
Not available
Section titled “Not available”Annotations anchored to a data point, uncertainty intervals that follow a series and error bars are not available; see App limitations. Use axis ranges and fixed shaded bands and line-end labels where they fit the explanation.