

Storytelling with data style
This style draws every measure in grey except the one that carries the takeaway, which takes a single accent colour. The title states the takeaway or the action it calls for, and legends and axes go wherever a direct label does the job. It follows the approach of Cole Nussbaumer Knaflic’s Storytelling with Data (2015).
Titles and annotations are host HTML; the chart is styled with operations. See Colour visualizations with operations.
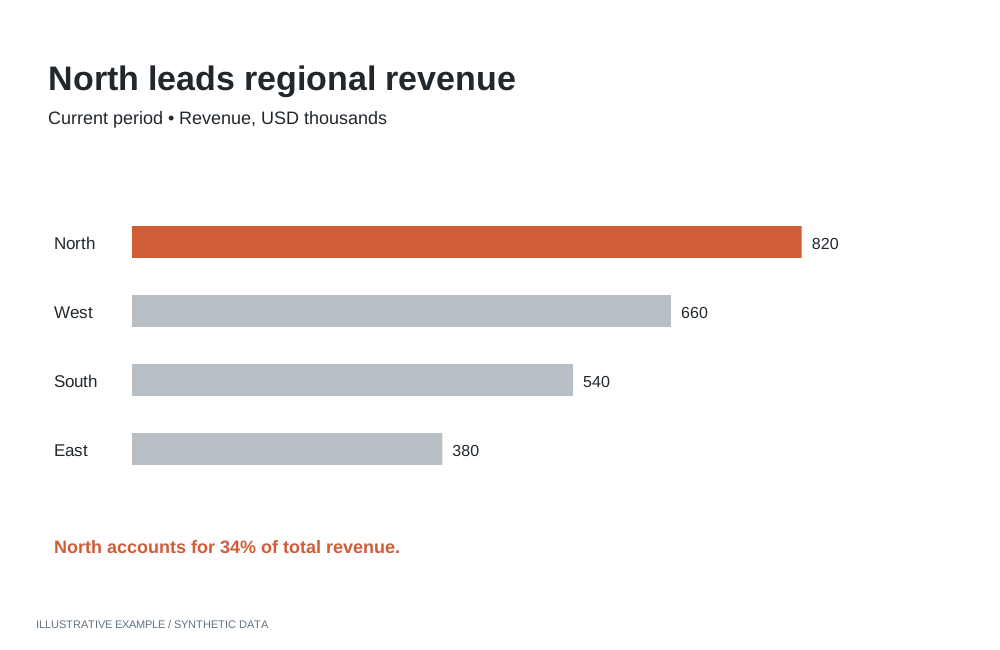
Illustrative example with synthetic data. Use one highlight to direct attention to the finding.
When to use the storytelling with data style
Section titled “When to use the storytelling with data style”Use it when each chart supports one decision and the reader should see the point before the detail: executive presentations, internal reporting and review meetings.
| The page is mainly | Use instead |
|---|---|
| Several series of equal weight, each chart titled with its finding | Economist or Financial Times |
| Indicators read beside prose | Explainer |
| Many items compared at a glance, colour carrying categories | Information is Beautiful |
| A long narrative read by scrolling | Visual essay |
| Exploration, where the reader decides what matters | Astrato default |
Use cases
Section titled “Use cases”| Use case | What the page shows |
|---|---|
| Executive presentation | Actual against target by region, with actual in the accent and the title naming the gap |
| Budget review | Spend against budget by department, with spend in the accent |
| Project status | Planned against actual over time, with actual in the accent and plan as a thin dashed grey line |
| Headline figure | One number in the accent above grey supporting charts |
Tokens
Section titled “Tokens”Define the tokens once and redefine them for dark; see Define colour tokens.
:root {  --page: #ffffff;  --surface: #ffffff;  --ink: #262626;  --muted: #666666;  --line: #d4d4d4;
  /* Every measure that is not the point. */  --baseline: #8f8f8f;  /* The one measure that is. Pick one accent per page. */  --accent: #1f5fb8;  /* Alternative accent for a negative takeaway. */  --accent-alert: #c2410c;
  --font: 'Source Sans 3', Arial, sans-serif;
  --space-1: 4px;  --space-2: 8px;  --space-3: 16px;  --space-4: 32px;}:root[data-theme='dark'] {  --page: #17191c;  --surface: #17191c;  --ink: #ededed;  --muted: #a6a6a6;  --line: #383b40;
--baseline: #6e6e6e; --accent: #5c9ef0; --accent-alert: #f08a4b;}- One accent per page. Use
--accentor--accent-alert, not both. - Font. Source Sans 3 is openly licensed and served by Google Fonts; see Load visualization fonts.
- White space.
--space-4separates charts in place of borders.
Page and card chrome
Section titled “Page and card chrome”No card borders, fills or shadows; page and chart share one background. The Card supplies structure; this style sets its tokens and type.
<figure class="chart"> <figcaption> <h2 class="chart-title"><span class="accent">Actual revenue</span> missed target by 12%</h2> <p class="chart-subtitle">Revenue against target, Q3, by region</p> </figcaption> <div class="chart-host"></div></figure>:root { /* The Card's tokens; see /app-components/object-frame/#css. */ --panel-border: 0; --radius: 0; --panel-shadow: none; --frame-pad-x: 0px; /* 1px more than the Card's 6px, because there is no border. */ --frame-pad-y: 7px; --frame-title-h: 26px; --frame-subtitle-h: 18px; /* 7 + 26 + 18 + 7 = 58px of card around a 200px plot. */ --chart-min: 258px;}
body { background: var(--page); color: var(--ink); font-family: var(--font);}.chart-title { font-family: var(--font); font-weight: 600; font-size: clamp(16px, 3.8cqi, 22px);}.chart-title .accent { color: var(--accent);}.chart-subtitle { font-family: var(--font); font-size: clamp(13px, 3cqi, 15px);}- Set font longhands only; a
fontshorthand resetsline-heightand moves the text out of its row. --chart-minis 6px more than the Card’s default. Add the difference per chart row to the scrolling threshold; see Calculate a scrolling threshold.
Charts
Section titled “Charts”Read token values from script, pass them as payloads, and re-apply them when the theme changes; see Switch themes in place.
Accent one measure
Section titled “Accent one measure”| The chart has | Operation | Value |
|---|---|---|
| Two or more measures (bar, line or combo) | setMeasureGraphColor |
--accent on the key measure, --baseline on each other |
| One measure on a bar chart | setColoringColor |
--baseline, or --accent when the whole chart is the point |
The accent follows a measure, not a category: one bar or one line of a single measure cannot be coloured on its own; see App limitations.
Declutter, bar and line
Section titled “Declutter, bar and line”The axis operations take an axisName; bar and line use dimension and primaryMeasure.
| Setting | Operation | Value |
|---|---|---|
| No value axis when bars carry their values | setShowAxisLabels, setShowAxisLine |
{ axisName: 'primaryMeasure', showLabels: false }, { axisName: 'primaryMeasure', showAxisLine: false } |
| No ticks | setShowAxisTicks |
{ axisName, showAxisTicks: false } for each axis |
| Axis line and labels | setAxisLineColor, setAxisLabelColor |
dimension: --line; each axis: --muted |
| No axis titles when the subtitle gives the unit | setShowAxisTitle |
{ axisName, showAxisName: false } for each axis |
| No legend when the title names the series | setLegendEnabled |
false |
| Setting | Operation | Value |
|---|---|---|
| Horizontal bars for long category names | setBarChartOrientation |
horizontal |
| Square bar ends | setBarChartBarRadius |
0 |
| Values at the bar ends, no backdrop | setMeasureDataLabelsShow, setMeasureDataLabelBarPlacements, setMeasureDataLabelShowBackdrop |
true; [{ "position": "outside" }]; false |
| Measures in different units side by side | setBarChartLayout |
groups |
| Setting | Operation | Value |
|---|---|---|
| Straight segments | setLineType |
straight |
| The key line heavier | setMeasureLineSize |
strokeWidth: 3 on the key measure, 1.5 on the others |
| Plan or target dashed | setMeasureLineStyle |
dashed |
| Labels on the key line only, in its colour | setMeasureDataLabelsShow, setMeasureDataLabelDensity, setMeasureDataLabelIsColored |
true on the key measure, low, true |
Number and table
Section titled “Number and table”| Setting | Operation | Value |
|---|---|---|
| Figure font and weight | setNumberFontFamily, setNumberFontWeight |
Source Sans 3, 600 |
| The takeaway figure | setNumberFontColor |
--accent on one number, --ink on the rest |
| Horizontal dividers only, no outer border | setTableColumnBorders, setTableBorderEnabled |
showHorizontal, false |
| Body and header text | setTableAllColumnsFontColor, setTableHeaderFontColor |
--muted |
| The key column | setColumnFontColor |
--accent |
Titles, labels and annotation
Section titled “Titles, labels and annotation”- Action title. State the takeaway or the action: “Revenue missed target by 12%; review pricing”, not “Revenue by region”.
- Colour words as the legend. Colour the words that name the key measure with the same token
(
.chart-title .accent), then turn the legend off. - Subtitle. Measure, unit and period, in
--muted. - Annotation. One or two sentences beside the chart in host HTML, with the key figure in
--accent.
Contrast
Section titled “Contrast”WCAG ratios against --surface, from Measure contrast. Text
needs 4.5:1, series 3:1; --line is checked against the 1.4 surface guide.
| Token | Light | Ratio | Dark | Ratio |
|---|---|---|---|---|
--ink |
#262626 |
15.13 | #ededed |
15.05 |
--muted |
#666666 |
5.74 | #a6a6a6 |
7.24 |
--line |
#d4d4d4 |
1.48 | #383b40 |
1.57 |
--baseline |
#8f8f8f |
3.23 | #6e6e6e |
3.45 |
--accent |
#1f5fb8 |
6.20 | #5c9ef0 |
6.38 |
--accent-alert |
#c2410c |
5.18 | #f08a4b |
7.08 |
--baseline passes for graphics, not text; label grey series in --muted.
Not available
Section titled “Not available”See App limitations: no colour for a named category value, so one category cannot take the accent; no data label on one category alone; no annotations, reference lines or gridline styling in the plot; chart text stays in Roboto.
Use line-end labels on vertical, unstacked line charts.
Pairs well with
Section titled “Pairs well with”Related
Section titled “Related”- Theming: tokens, dark theme, fonts and chart palettes.
- Visualization operations: every operation per chart type.
- Mounting objects: grouped bars for measures with different units.