

Scheduled Dashboard Reporting
Real-Time Monitoring with a Twist
Section titled “Real-Time Monitoring with a Twist”Scheduled dashboard reporting isn’t just a relic of the past; it’s the espresso shot in your data-driven morning. Imagine you’re running a 24/7 operation. Real-time dashboards are great, but what you need is a snapshot at specific intervals to see trends, anomalies, or even the calm before the storm.
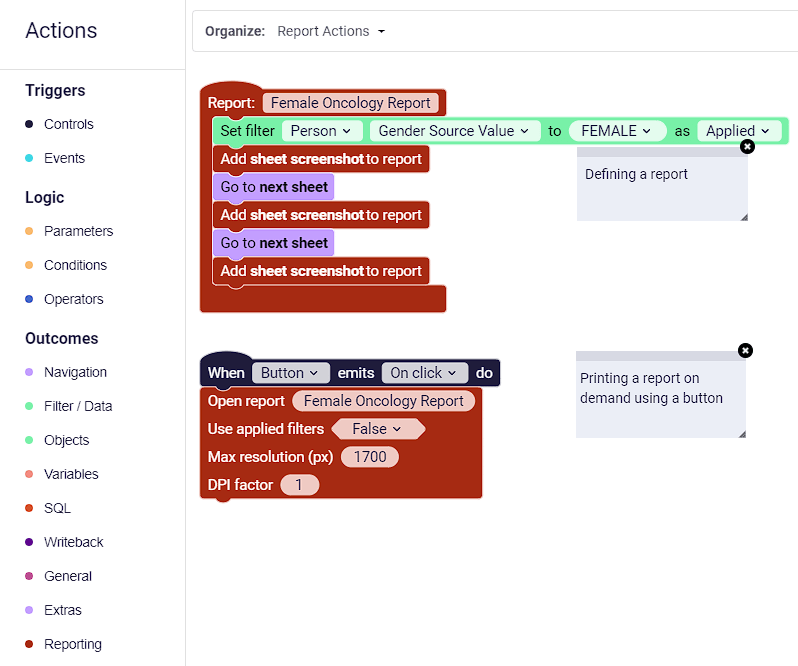
👨🎓 Actions are used in reporting to define reports and can also be used to download reports on demand. See the action blocks below for examples.
Reports defined in published workbooks are later presented in the scheduled reporting area in the Astrato Lobby.
Learn about per-user reporting, looping through data per user
How to set up a scheduled report
Section titled “How to set up a scheduled report”Navigate to reporting in Astrato.
New Schedule: Set up automated schedules for reporting and exporting data.
General Tab
Section titled “General Tab”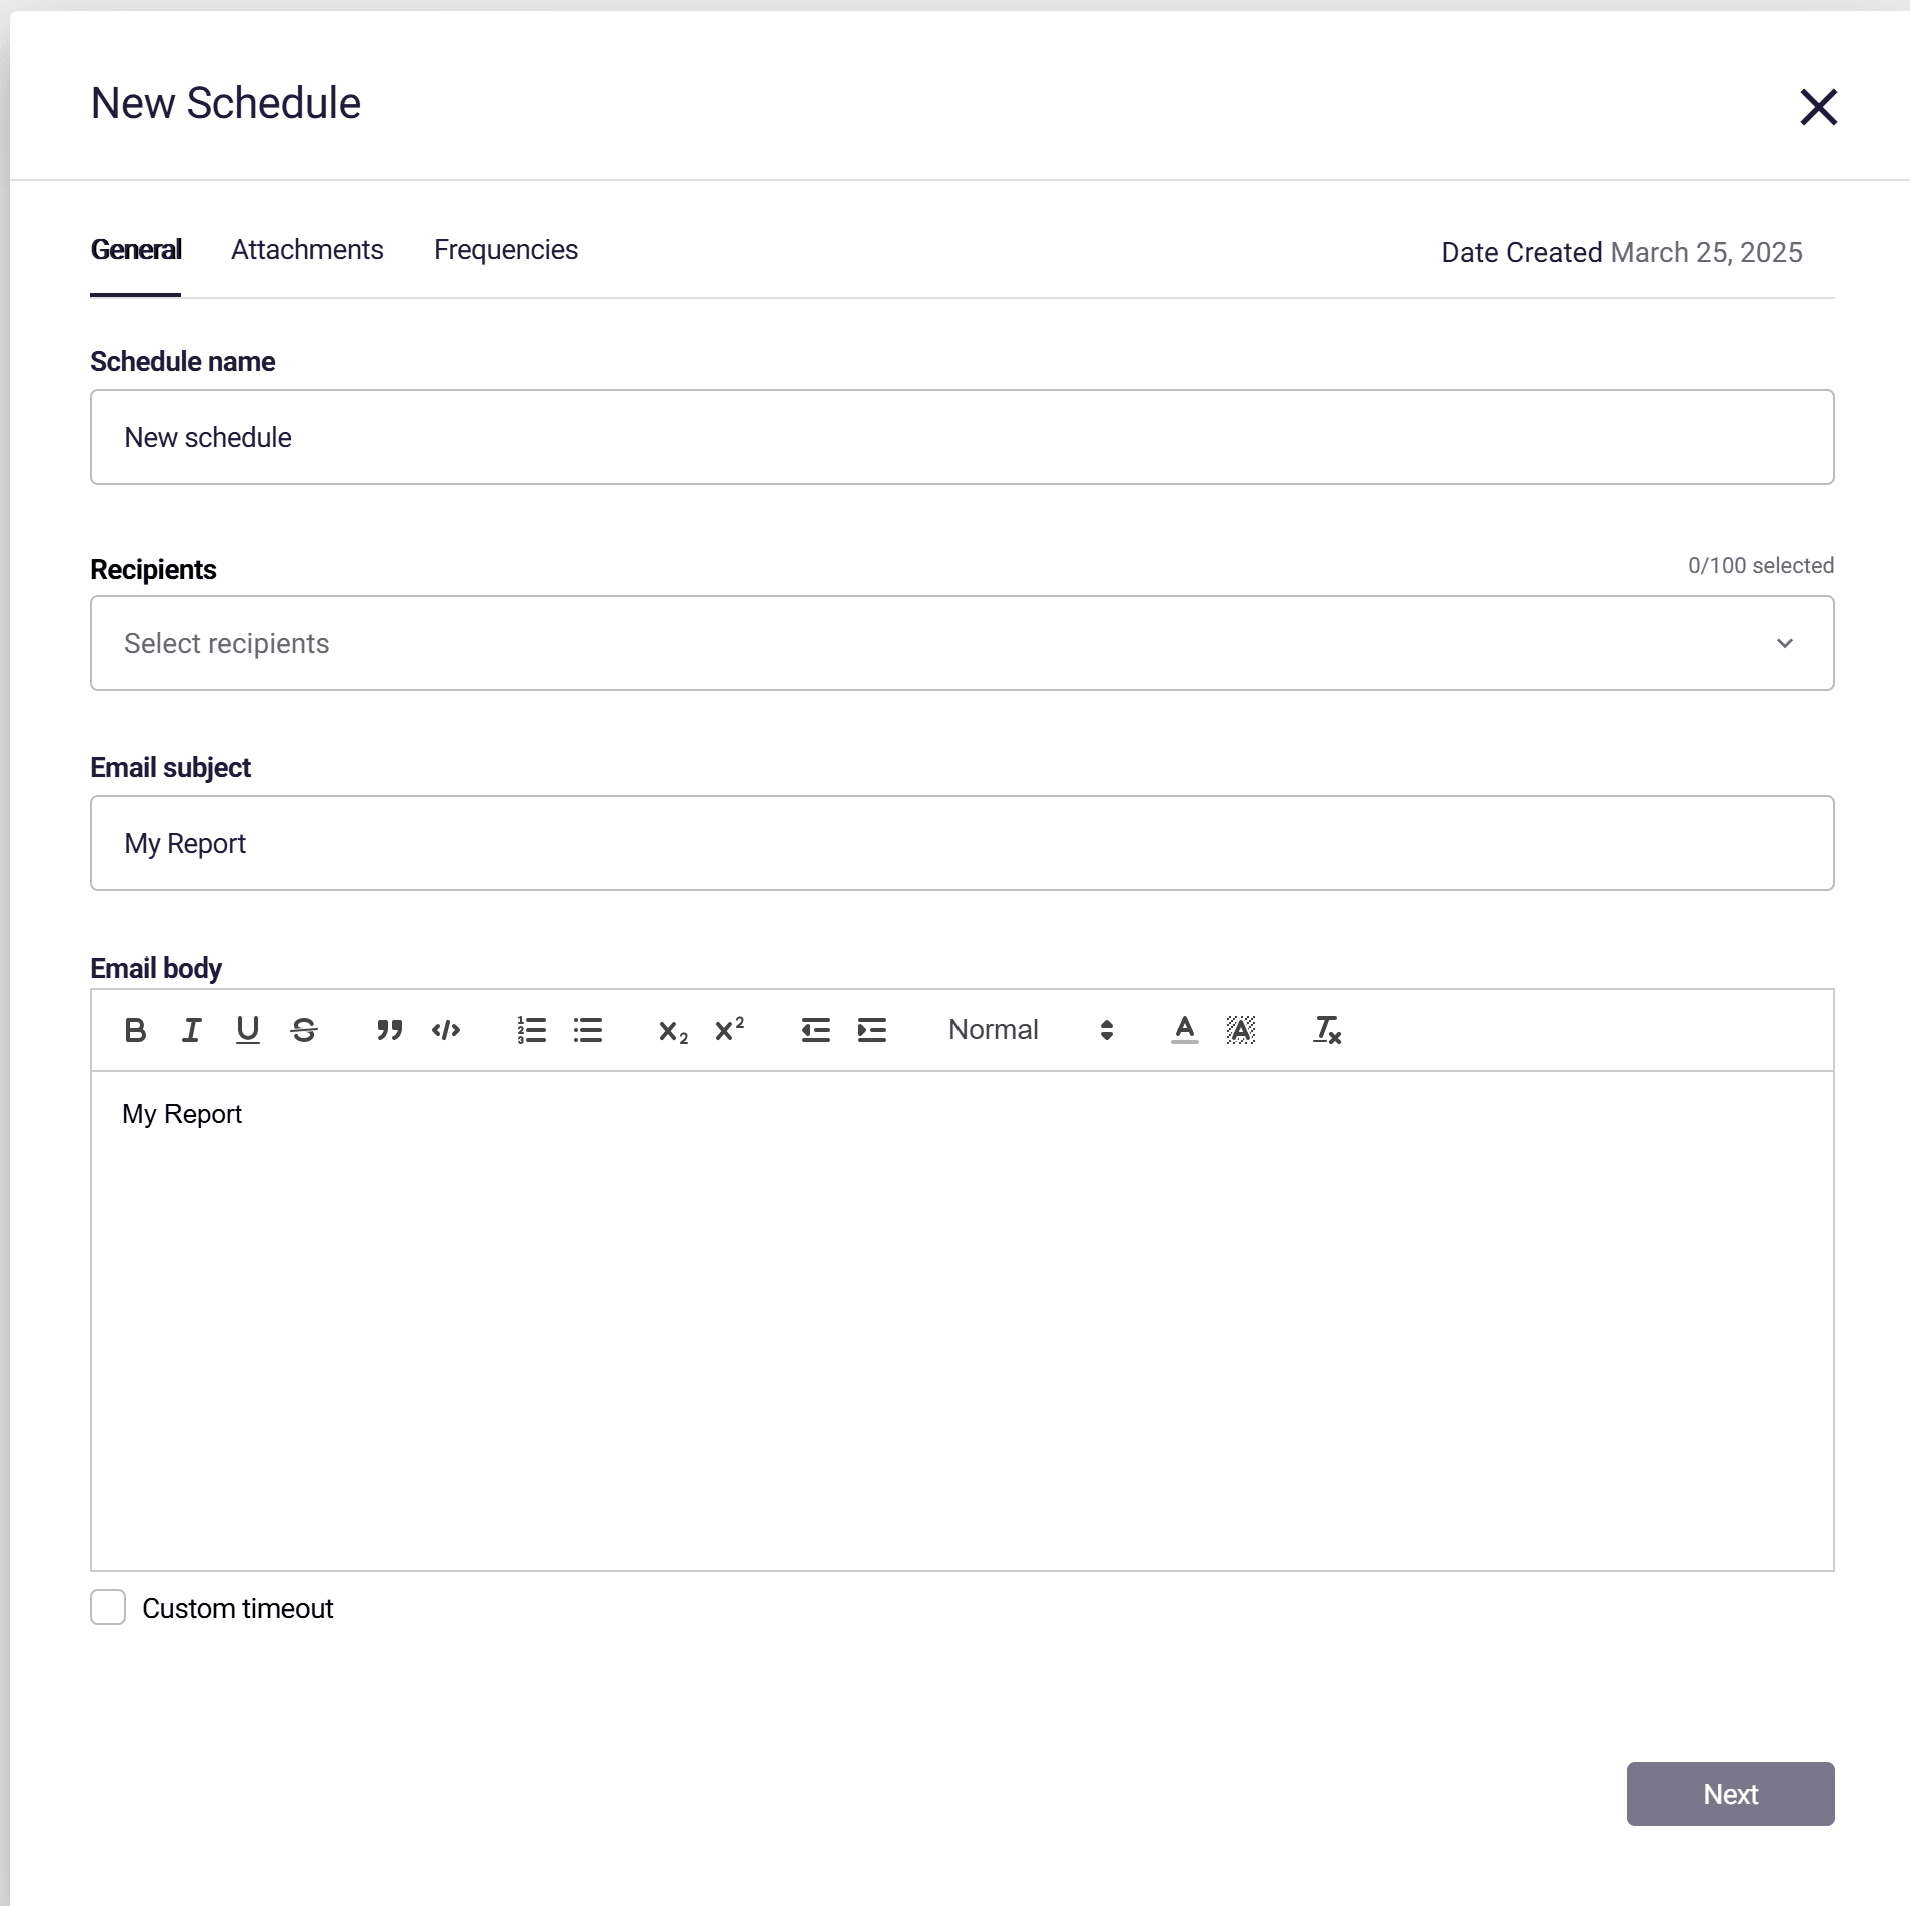
Schedule Name: Enter a unique name for the schedule.
Recipients: Input the email addresses of the recipients. Please ensure the correct email addresses are entered for successful delivery.
By default, only the emails of the Astrato Tenant users are available.
To allow sending reports to external emails, define your own SendGrid account in the Reporting section of the administration.
✉ We currently have a limit of 100 recipients per email/schedule - you may want to consider using email groups so that updating the recipients can be managed in your company directory.
Please get in touch with support if you wish to increase this limit.
ℹ Ensure that Automated Reporting is enabled in the admin settings.
This is required for Astrato to be able to mimic the access of a given user, a necessary security setting.
Subject: Enter the subject of the email.
Email Body: Type the content or message accompanying the report.
Custom timeout: Set the timeout to run the schedule.
Attachments Tab
Section titled “Attachments Tab”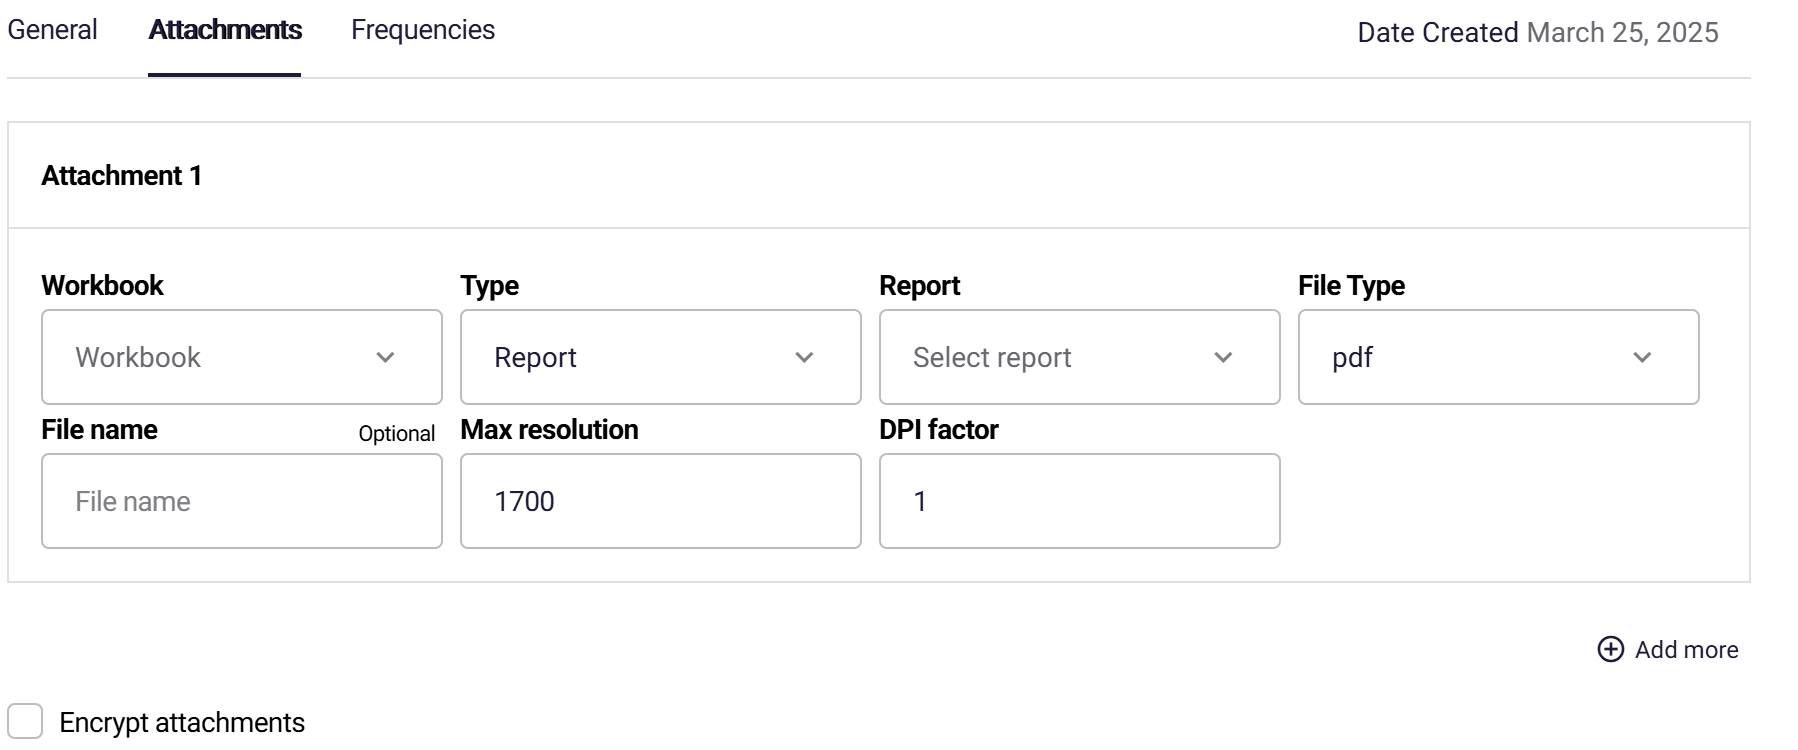
Workbook: Select the desired workbook from the dropdown.
Type:
-
Report: Standard reporting.
-
Export: Data extraction in specified formats.
File Type (only available when ‘Type’ is ‘Export’):
-
PDF: Standard document format.
-
CSV: Delimited text file for tabular data.
-
Image: Graphical representation of data.
Report: Choose the specific report based on the selected workbook.
ℹ A report can be setup with actions, found in the workbook editor, within the left hand side toolbar.
Using actions means that you can setup flows as if you were a user, and decide how reports are captured. Include filters, set variables, show and hide objects, all using actions.
File name: set custom file name.
Max Resolution: Set the maximum resolution for the schedule. A higher value will result in better quality and a larger attachment file.
DPI factor: set the DPI factor for the schedule.
Encrypt attachments: encrypt all the attachment files that are sent in the schedule.
Frequencies Tab
Section titled “Frequencies Tab”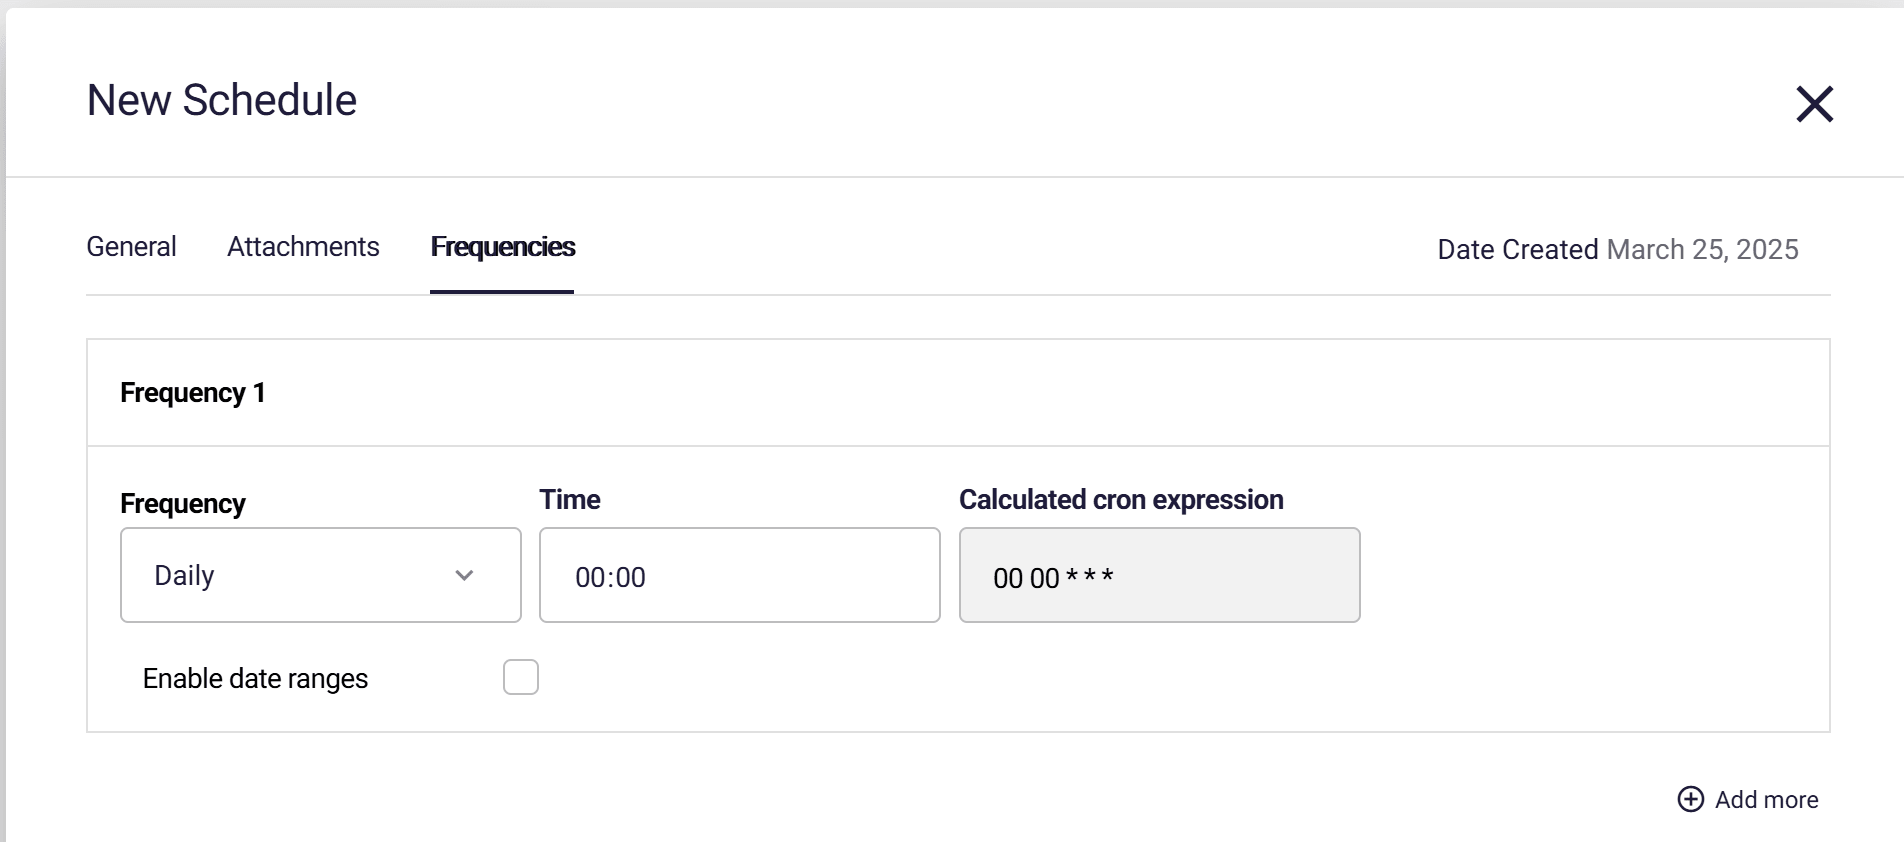
Frequency and Time:
-
Frequency: Set how often the report will be sent.
-
Time: Set the specific time for report dispatch.
-
Calculated CRON expression: See the CRON expression in the schedule.
There is an option to set the schedule using a CRON expression by selecting Custom frequency. -
Enable date ranges: set the start and end dates for the schedule.
Report Subscriptions
Section titled “Report Subscriptions”The subscription option allows users to subscribe to distribution schedules, ensuring they receive data at a time that suits them and aren’t overwhelmed by too many reports. Subscribing to reports is as simple as enabling a switch.
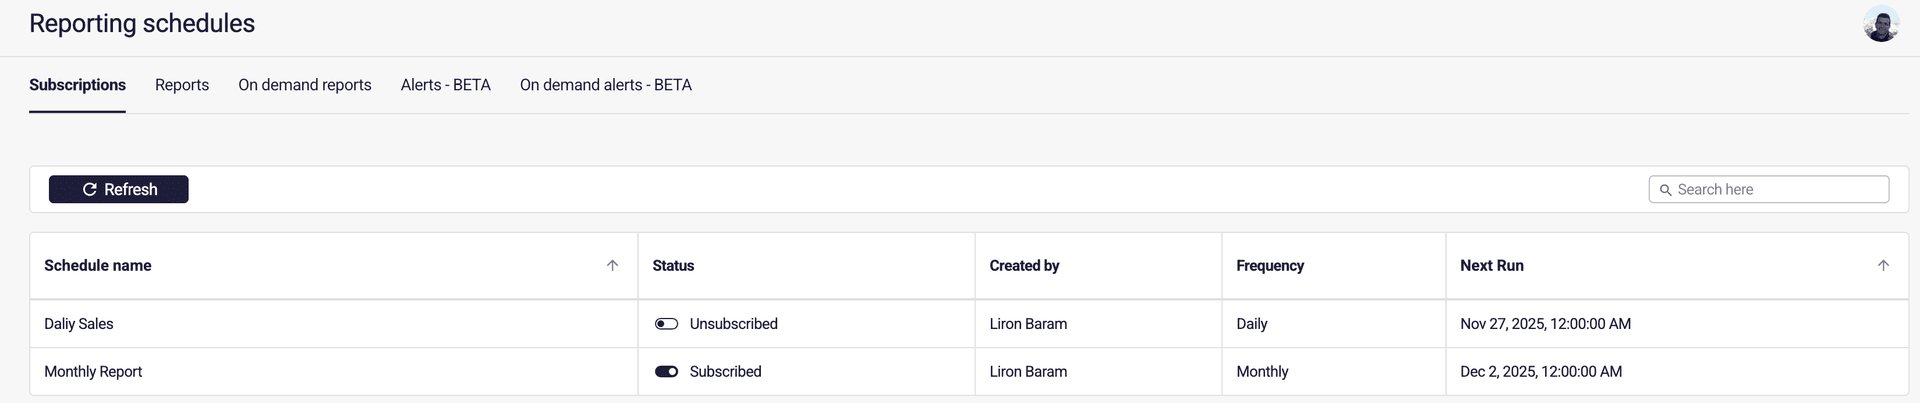
Users have a clear view of the reports they subscribed to, and they can opt out at any time.
Scheduled Report Monitoring
Section titled “Scheduled Report Monitoring”
Schedule name: The schedule name.
Status: Schedule status, enabled or disabled.
Created: The date the schedule was created.
Last Run: The date and time of the last run of the schedule.
Last Run Status: the result of the last run.
Last Run Duration: The duration it took to run the schedule.
Next Run: The date and time of the next scheduled run.
Astrato Report limits
Section titled “Astrato Report limits”Reporting limit includes everything that isn’t a standard export from the context menu, or from an object container button. A report/workflow that is defined with actions will count toward the reporting limit.
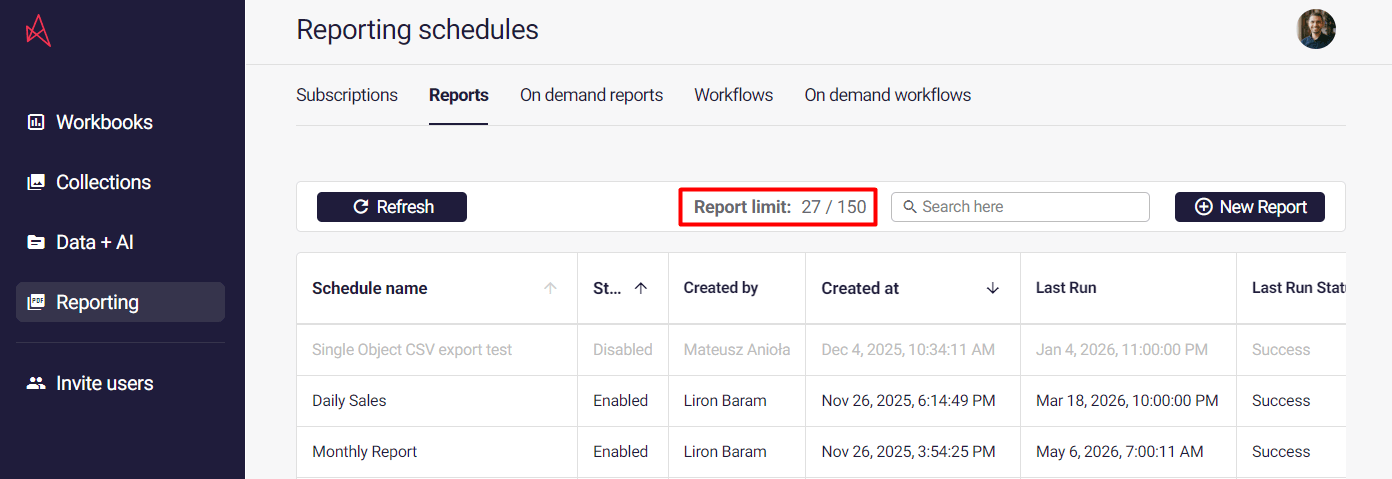
Cycling through filters & sheets
Section titled “Cycling through filters & sheets”Many use cases require cycling through filters and/or sheets.
Let’s say you want to have a report for each value within a field, such as location. There are several ways to achieve this.
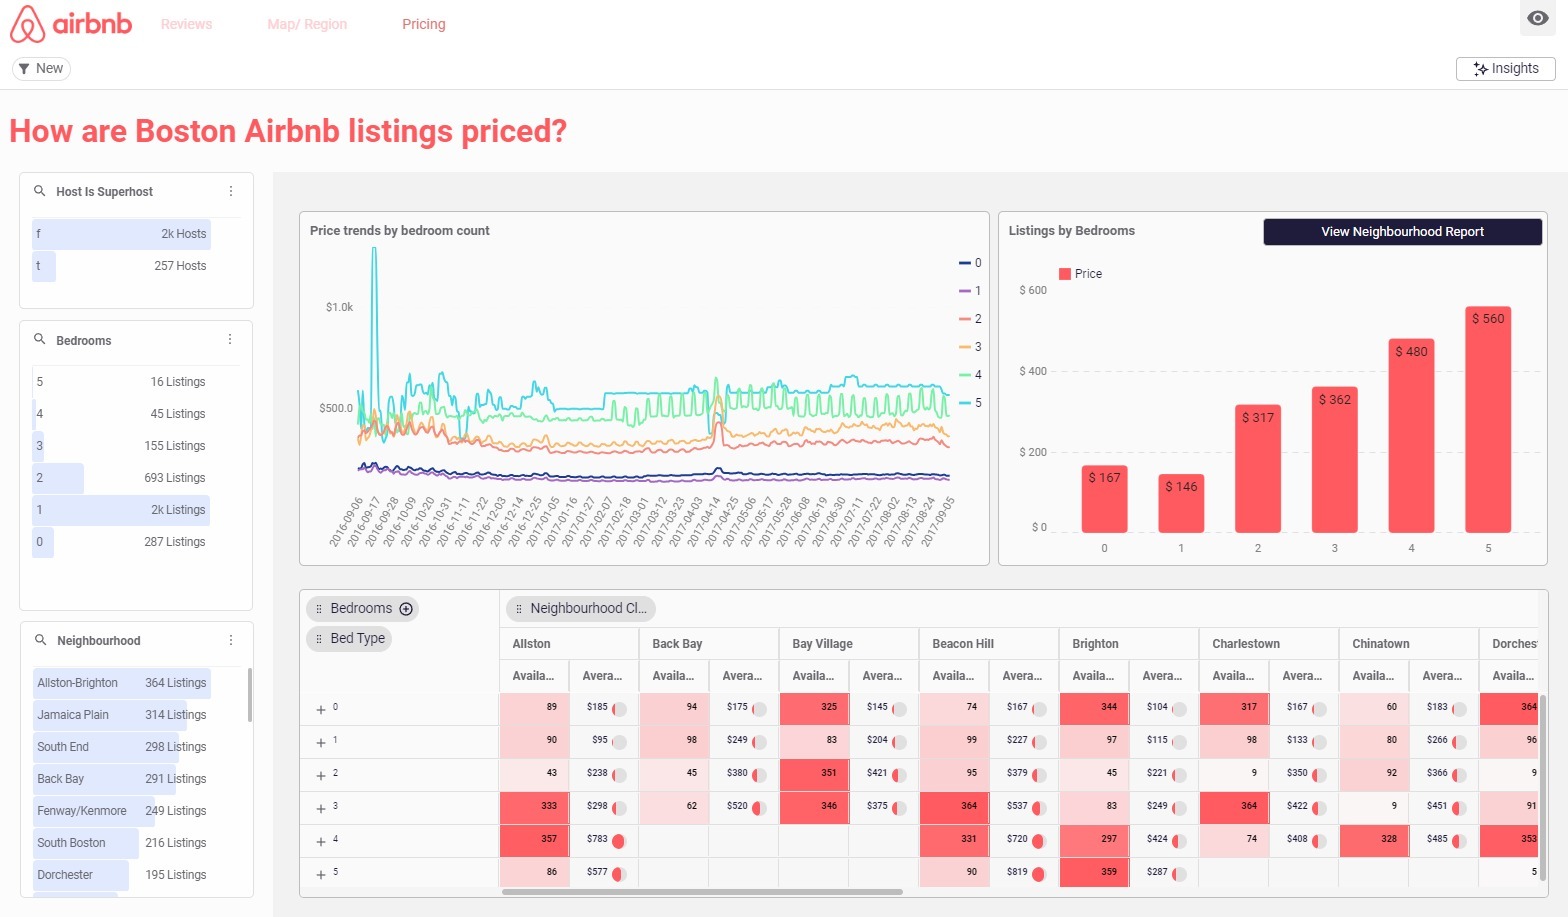
I want to take my top Neighbourhood locations (see bottom left in the image) and have a report generated for some of those, for end users.
Automatically loop through field values.
Section titled “Automatically loop through field values.”I have specified which field to filter and loop through, and replaced the filter to ensure the data is exclusively set to that value when the report is generated.
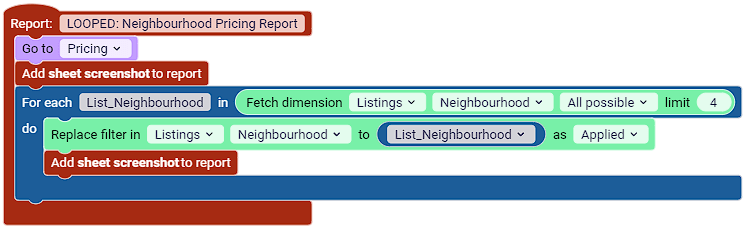
⚠ Be aware of the field chosen, since each value will be looped through and selected
Manually specifying values
Section titled “Manually specifying values”I have specified which field values to filter through and replaced the filter to ensure the data is exclusively set to that value when the report is generated.
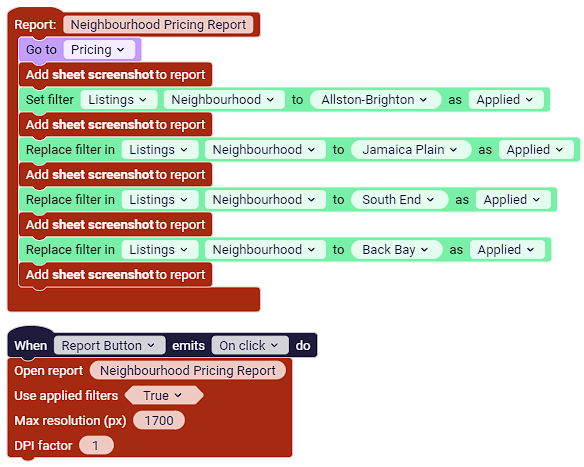
Example output of “Neighbourhood Pricing Report”
Generated in a 1:1 aspect ratio: Neighbourhood Pricing Report.pdf
Viewer access
Section titled “Viewer access”Viewers can receive scheduled reports and manage subscriptions, but cannot create or manage report schedules. Existing Viewer-owned schedules continue running and can be managed by administrators, tenant owners, and Creators in the same tenant. The Public checkbox and workbook filter-bar Reports picker have been retired. Existing report blocks continue to work without conversion.
Use cases
Section titled “Use cases”Financial Reporting: The Monthly Ritual
Section titled “Financial Reporting: The Monthly Ritual”Every finance team lives for (or dreads) the end-of-month reports. Scheduled dashboard reporting can automate this process, ensuring that the right people get the right numbers at the right time. No more scrambling, just actionable insights.
Customer Success: NPS Scores & More
Section titled “Customer Success: NPS Scores & More”Customer success teams can schedule weekly or monthly reports to track Net Promoter Scores, customer engagement, and other KPIs. This keeps everyone in the loop and allows for timely interventions.
DevOps: The Heartbeat of Your System
Section titled “DevOps: The Heartbeat of Your System”Scheduled reports can serve as a regular health check for your systems. Whether it’s server uptime, error rates, or resource utilization, getting a scheduled report can be like a regular check-up for your infrastructure.
Sales and Marketing: The Pulse and the Push
Section titled “Sales and Marketing: The Pulse and the Push”Sales and marketing teams often operate on different rhythms. A scheduled dashboard can sync up these departments by providing a regular snapshot of leads, conversions, and other metrics that fuel the revenue machine.
Compliance: Keeping It Tight
Section titled “Compliance: Keeping It Tight”In industries where compliance is key, scheduled reporting can be a lifesaver. Regular reports can ensure that you’re meeting all regulatory requirements, giving you one less thing to worry about.
Dashboards are not just mirrors reflecting real-time data; they’re time machines capturing the essence of your business at critical moments.
Unsupported action blocks
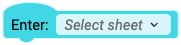
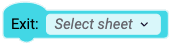
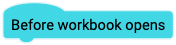
Section titled “Unsupported action blocks”The following action blocks will not be run during report generation:
Action block | Name |
 | |
 | |
 | |
 | |
 | |
 | |
 | |
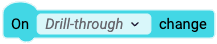
 | On [Table].[Field] filter change within [Applied/Pending] state |
 |
Known Limitations
Section titled “Known Limitations”-
Fetch dimensionblock does not work with “Custom Data” -
The user ID of the user who created the report schedule, is used for identity federation to ensure users receive the same report