

Historical release notes
4.16.1 - 27 July 2026
Section titled “4.16.1 - 27 July 2026”KPI Tree
Section titled “KPI Tree”Customizable color rules for sub-measures
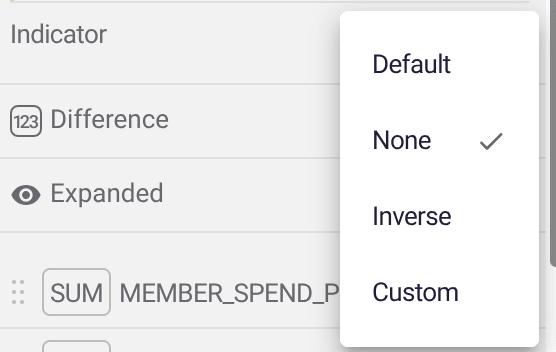
Section titled “Customizable color rules for sub-measures”Sometimes lower is better, think churn rate and costs. Per-measure, you can choose to have colors on KPI Tree measures, inverted to reflect the direction of change you require.
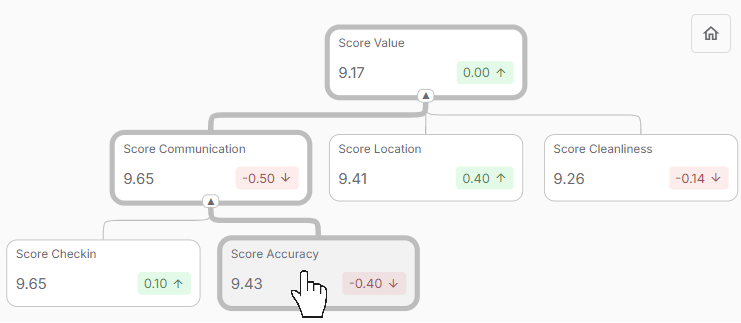
Highlight critical paths
Section titled “Highlight critical paths”The KPI tree visually highlights the critical path, making it easier to trace the factors with the greatest influence on the overall metrics.
Align non-hierarchical measures to a grid
Section titled “Align non-hierarchical measures to a grid”KPI Trees without hierarchies can better organise meaure cards/nodes into grid formats for easy reading. A great way to make a vertical KPI card stack.
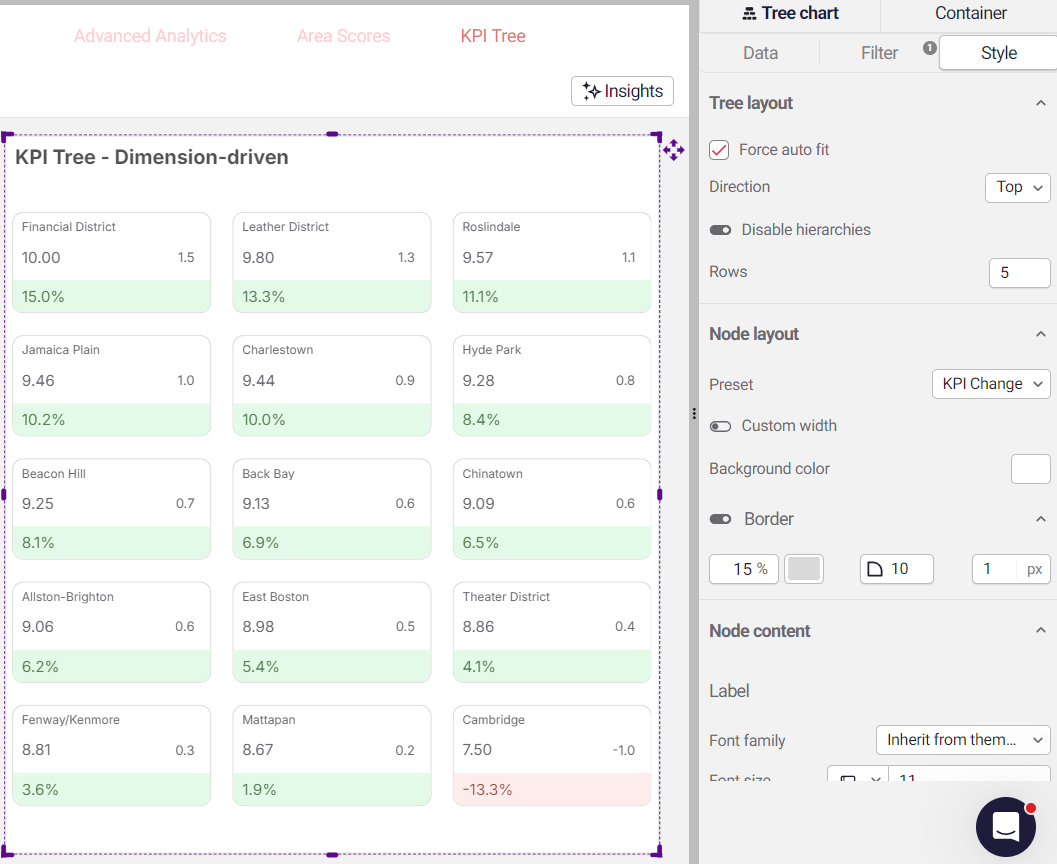
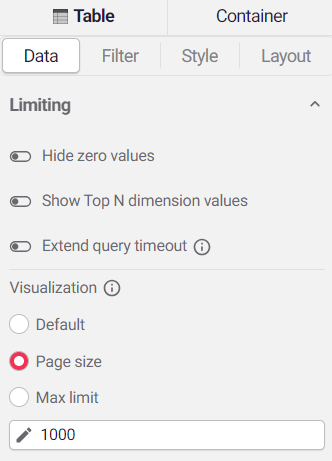
Table - configurable Data Paging Size
Section titled “Table - configurable Data Paging Size”A new Page size setting is available in the Limiting section:
-
Load default fetches 2,000 rows per page, preserving existing behaviour.
-
Custom supports values from 1 to 100,000 rows.
Increasing the page size can reduce the number of fetches during scrolling, while smaller values can limit the initial data load. Additional pages continue to load as users scroll beyond the fetched range.
Page size limits the rows fetched from the database by the Astrato engine. It does not correspond directly to the number of visible rows in pivot or expandable tables, where aggregation and expansion can change the displayed row count.
Existing tables remain unchanged and continue to use the default of 2,000 rows per page.
Conditional coloring - color by list of values
Section titled “Conditional coloring - color by list of values”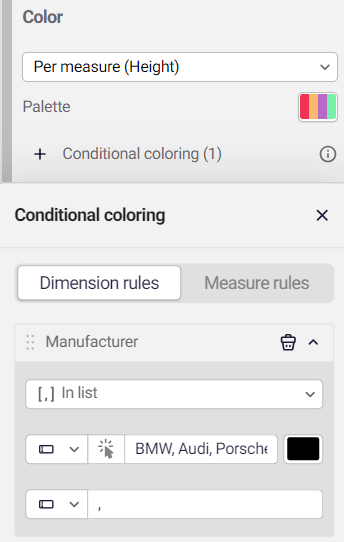
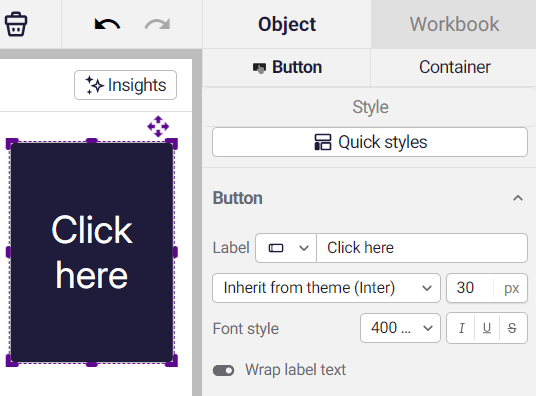
Button text wrapping
Section titled “Button text wrapping”Long text on buttons can appear on multiple liones using the wrap label text option.
Dataset selection for custom report (variables)
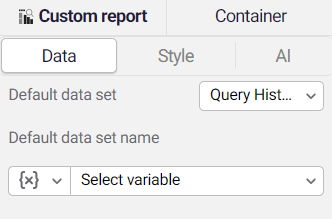
Section titled “Dataset selection for custom report (variables)”Custom reports can now use a variable to determine their dataset.
Set a variable for the Default data set name in the Custom report’s Data settings, then update that variable with a dropdown or an action. This lets viewers switch the dataset used by a custom report without editing the report itself.
4.16 - 20 July 2026
Section titled “4.16 - 20 July 2026”See which workbooks use a theme
Section titled “See which workbooks use a theme”You can now view the workbooks associated with a theme directly from its menu. When saving theme changes, Astrato also identifies which workbooks will be updated, helping you understand the impact before applying changes.
Could not display content
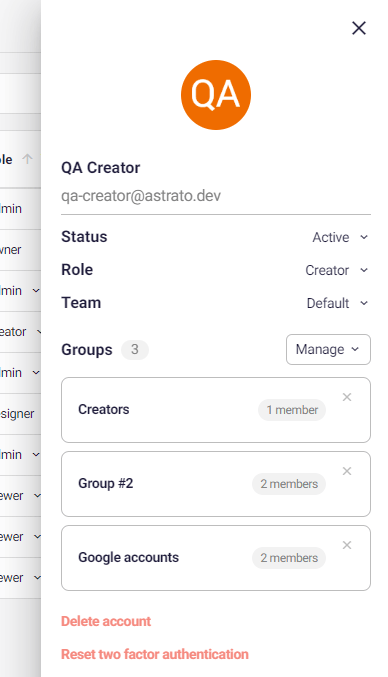
View and manage groups for each user
Section titled “View and manage groups for each user”Administrators can view and update the groups assigned to a user directly from the user administration screen, making access management simpler and more transparent.
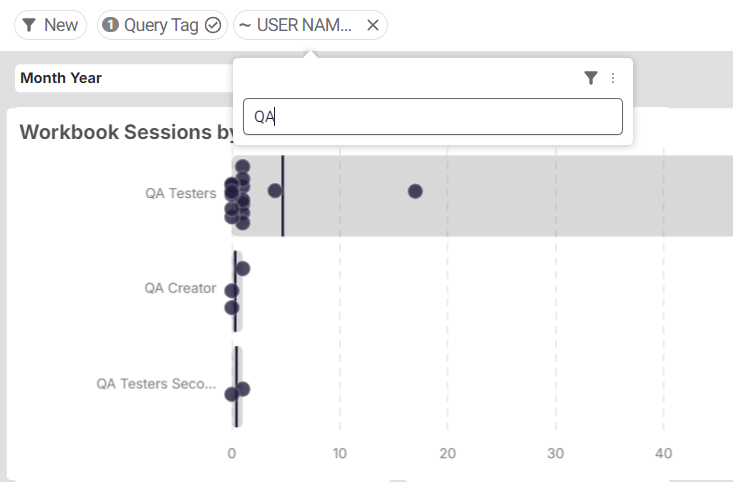
Filter large dimensions with new “Like” text mode
Section titled “Filter large dimensions with new “Like” text mode”You can now filter large dimensions even when not all selectable values have been loaded.
When a search term cannot be matched through the standard value-selection list, the filter can switch to a text-based Like expression instead of displaying a blocking error. The search term remains editable, and you can change the operator to options such as Contains, Starts with, or Ends with.
Text filters also work with Exclude, supporting conditions such as Does not contain and Does not start with.
This update does not change the standalone filter object, and pasting fewer than 1,000 values from Excel continues to work as before.
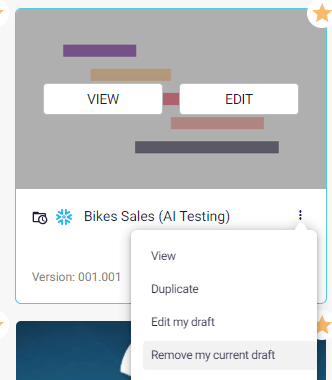
Remove current workbook drafts
Section titled “Remove current workbook drafts”You can now remove drafts even when only one draft remains for a workbook. This helps keep the My Drafts area focused on work that is genuinely in progress.
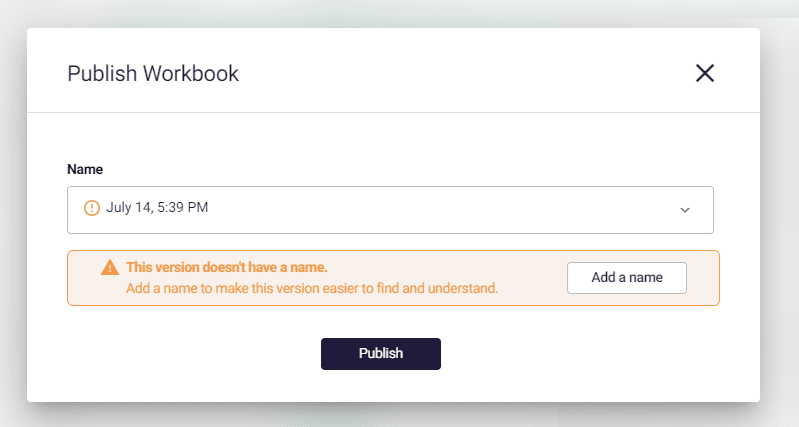
Suggested version names when publishing
Section titled “Suggested version names when publishing”When publishing a new workbook version, Astrato now suggests a version name to help teams maintain a clearer and more consistent version history.
Action improvements
Section titled “Action improvements”Filter using NULL values
Section titled “Filter using NULL values”Actions now support filtering for NULL values, giving you more control when working with incomplete or missing data.

Get the browser zoom level
Section titled “Get the browser zoom level”A new Action block can retrieve the browser’s current zoom level, enabling more responsive and context-aware workflows.

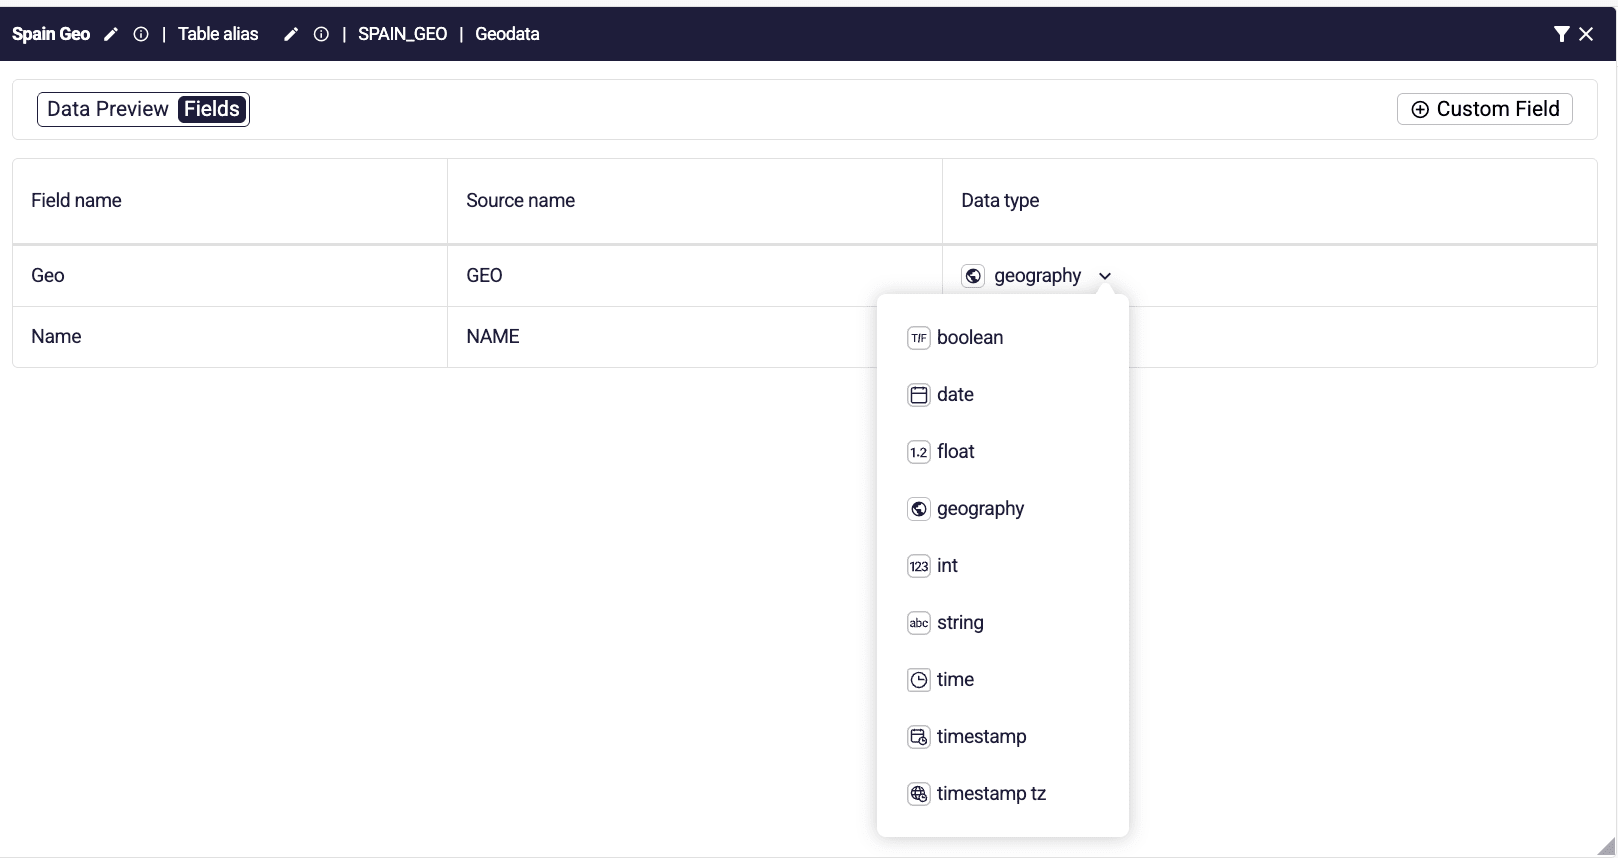
Expanded support for geographic data
Section titled “Expanded support for geographic data”Geography fields are now supported in custom SQL tables and can be selected when casting or setting a field type in the Semantic Layer Editor.
Top N for grouped hierarchies
Section titled “Top N for grouped hierarchies”Top N analysis now supports grouped hierarchies, providing more flexibility when exploring and presenting ranked data.
4.15 - 07 July 2026
Section titled “4.15 - 07 July 2026”Nash AI - Semantic layer measures
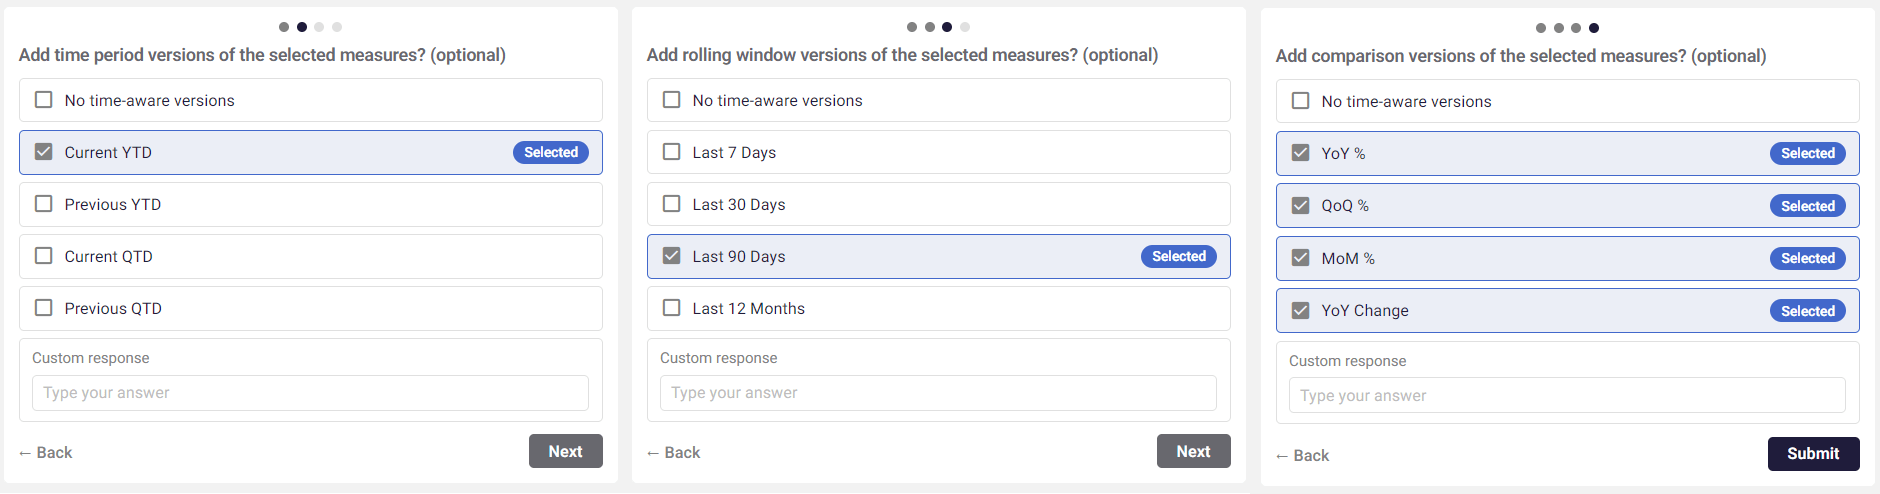
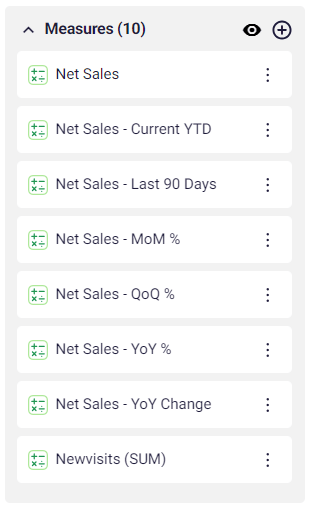
Section titled “Nash AI - Semantic layer measures”Nash can now add multiple versions of the same measure, to suit time-aware requirements. Example below.
✨NASH
Great news! I created 7 time-aware Net Sales measures for you, all wired to the Order Date field on the Sales table:
Net Sales (base measure)
Net Sales - Current YTD
Net Sales - Last 90 Days
Net Sales - YoY %
Net Sales - QoQ %
Net Sales - MoM %
Net Sales - YoY Change
You’re now set to slice and compare Net Sales across year-to-date, trailing 90 days, and period-over-period trends. Go build something awesome! 🚀
Nash AI - General improvements:
Section titled “Nash AI - General improvements:”-
Nash now labels visual inspection steps with a Vision indicator, making it clear when your sheet is being visually analyzed.
-
Messages and image attachments are briefly paused while Nash prepares the sheet context, preventing requests from being sent before the chat is ready.
-
Improved reliability when opening or switching between Nash conversations.
-
Nash can now configure Date Picker objects, including date fields, single-date or range selection, quick select, presets, labels, time options, colors, and responsive behavior.
-
Chart filters can now use any field available to a visualization - even when that field is not displayed - making static and measure filtering more reliable across supported charts.
-
Filter objects can now switch between manual and data-driven sources.
-
Date grouping automatically applies an appropriate date format for clearer results.
Actions - Optionally enable always one selected
Section titled “Actions - Optionally enable always one selected”You can now enable Always One Selected on supported actions. When enabled, users cannot clear their current selection, ensuring there is always an active value.
Use cases:
-
Keep dashboards focused on a default selection.
-
Ensure dependent charts, filters, and actions always have a valid context.
-
Prevent empty states and accidental deselection.
-
Leave this disabled when users need to clear selections to view all data or compare multiple categories, regions, or other values.

Rich text editing - Insert Variable button
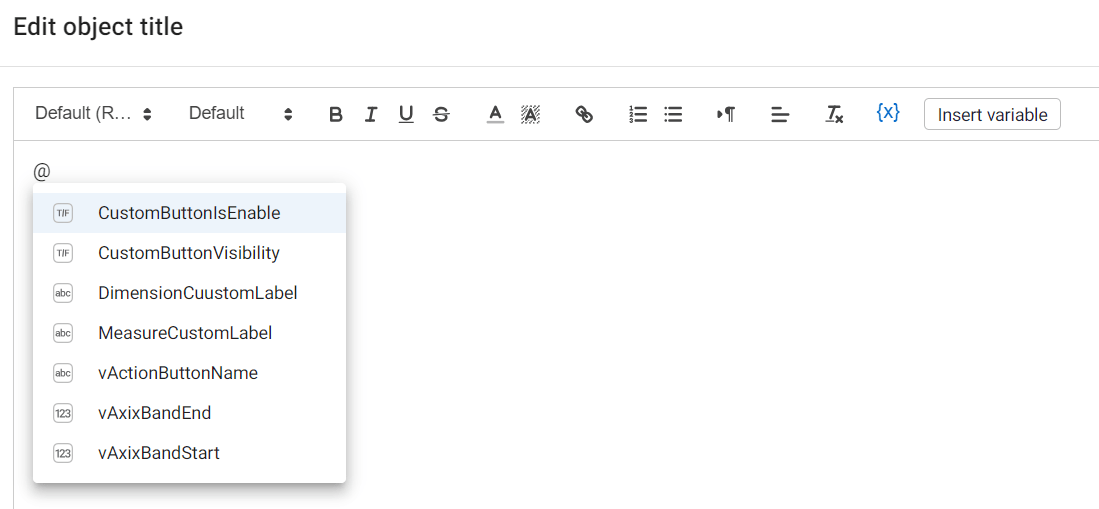
Section titled “Rich text editing - Insert Variable button”A new Insert Variable button has been added to the text editor, making it easier to add dynamic text and values to titles and text objects. You can still type @ to open the variable picker, but the dedicated button makes the feature easier to discover.
KPI Tree - Improve Autofit
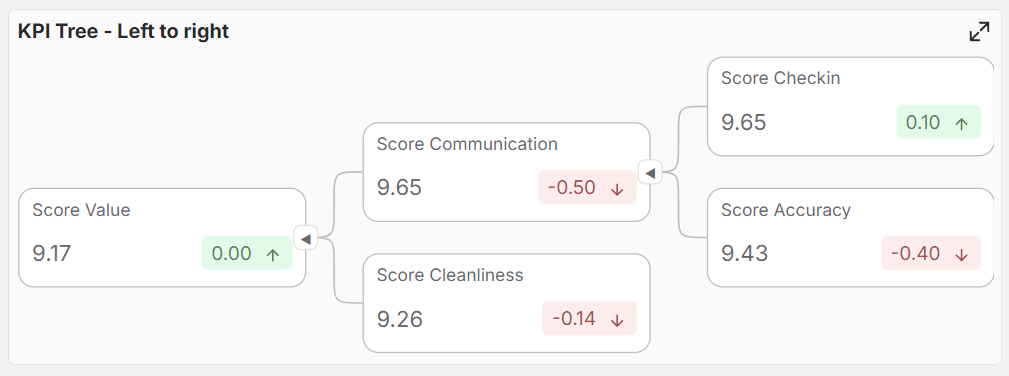
Section titled “KPI Tree - Improve Autofit”The chart takes up more of the available area, instead of using whitespace.
4.14 - 30 June 2026
Section titled “4.14 - 30 June 2026”Nash AI – Agentic Dashboard Builder & BI Assistant
Section titled “Nash AI – Agentic Dashboard Builder & BI Assistant”Work with multiple AI agents at once
Section titled “Work with multiple AI agents at once”You can now run multiple Nash agents in parallel, each in its own tab, all working on the same sheet or semantic layer simultaneously. This means you no longer have to wait for one request to finish before starting the next.
- Multi-tab agents— open several conversations side by side and let them work concurrently.

- “Send in new chat”— branch any prompt into a fresh agent tab with a single click.

-
Smart prompt queuing— prompts are scheduled and processed automatically based on available capacity, so nothing gets lost.
-
Available in both the Workbook Editor and the Semantic Layer (SLE)experiences.
Introduction of Vision - Nash AI can now “see” your sheet
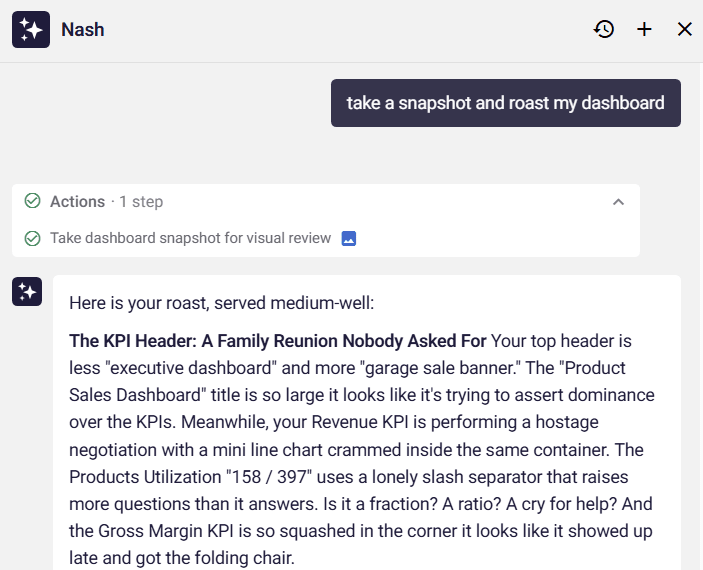
Section titled “Introduction of Vision - Nash AI can now “see” your sheet”Nash can now visually inspect the current sheet, giving it a reliable, true-to-life view of what your dashboard actually looks like. This helps Nash make better, more accurate decisions when you ask it to adjust layouts, styling, or charts.
-
Visual inspection of the live sheet for more grounded AI assistance.
-
You can preview the images Nash captured directly from the activity card.
-
Automatically enabled only where supported, ensuring consistent behavior.
Broader and more reliable chart & filter editing
Section titled “Broader and more reliable chart & filter editing”Nash AI now handles filters and inputs more consistently across the full range of visualizations — bar, line, combo, pie, scatter, gauge, radar, sankey, treemap, waterfall, word cloud, tables, and more.
-
Add, set, and clear filters(static, measure, and result filters) through natural language across many more chart types.
-
Atomic Input support - Nash can now configure input objects, including their operations and values (Slider, Text Input, Text area input etc..
-
More consistent filter operations andstronger validationto prevent invalid or empty changes.
Style containers with Nash AI
Section titled “Style containers with Nash AI”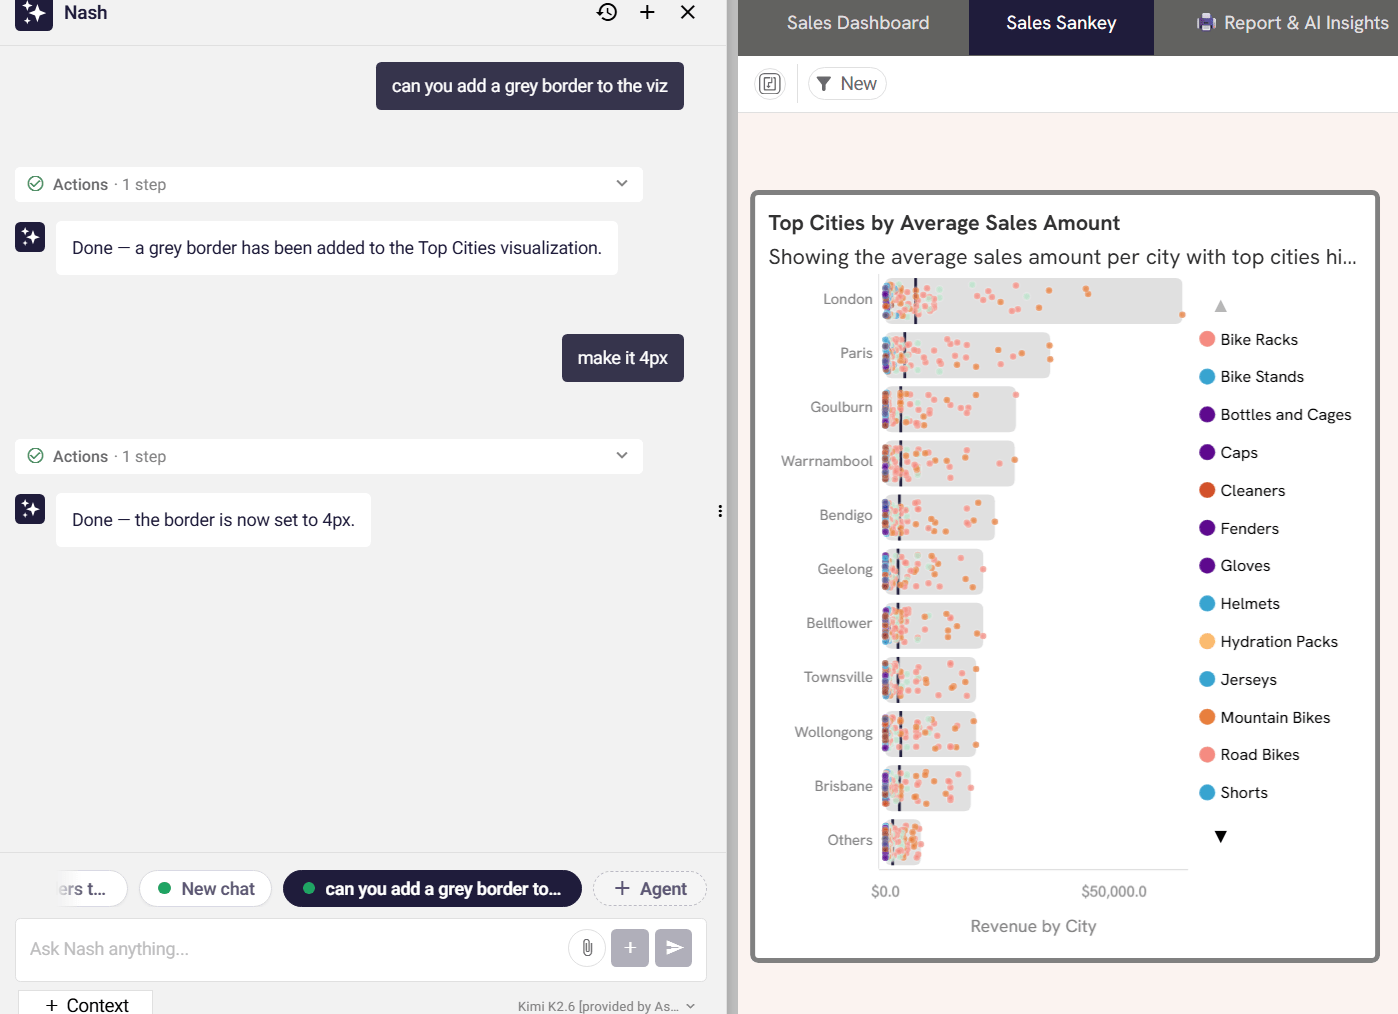
Nash can now configure container borders — set the color, thickness, style, and visibility — directly from a prompt, with improved validation so your styling changes apply reliably.
Nash AI – Semantic layer - Measure & dimension labels
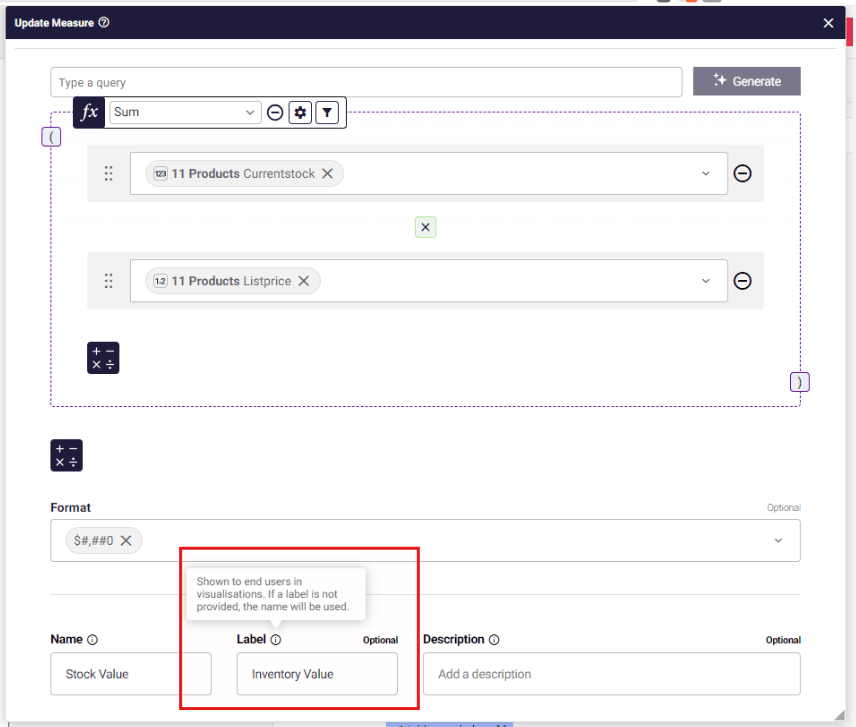
Section titled “Nash AI – Semantic layer - Measure & dimension labels”You can now define a Chart Label for measures, dimensions, drill-down dimensions, and columns without changing the underlying field name.
This makes it easier to present business-friendly names to end users while keeping semantic layer definitions, charts, and workbook logic intact. Previously, changing a field name often required updating individual charts or re-adding fields to preserve relationships.
Chart Labels are inherited automatically throughout the workbook, reducing maintenance and helping teams keep naming consistent across dashboards. Local chart-level labels can still be used when a specific visual needs a different label.
We’ve also improved guidance around field metadata with clearer descriptions for Name, Chart Label, and Description, making it easier to understand how each property is used throughout the platform.
Preview Sheet in Workbook Editor
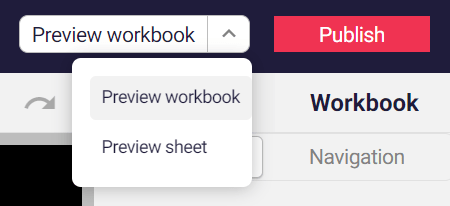
Section titled “Preview Sheet in Workbook Editor”The Preview button in the workbook editor now previews the currently selected sheet rather than always jumping to the first sheet. This eliminates a common point of confusion for creators building multi-sheet workbooks.
Button spacing around Publish and Data Refresh has also been tightened up.
Row-Level Security: System Parameter Filters
Section titled “Row-Level Security: System Parameter Filters”Admins can now use dynamic system parameters when defining global data reduction rules. In the filter rule modal, a new System Parameter input type lets you filter by $userEmail or $userGroupName directly — no manual value entry needed.
For group-based rules, a dropdown shows all groups the creator has access to. Groups can also be added by name for cases where access is limited. Deleted groups remain in the list for visibility, consistent with how manual strings behave. Selecting a parameter auto-populates the name field.
PAT Token Management: Admin Controls and RBAC
Section titled “PAT Token Management: Admin Controls and RBAC”Admins now have full control over Personal Access Token (PAT) usage across the tenant. From System Settings > General, a new PAT management section lets admins enable or disable PATs entirely, and restrict creation to specific roles (Admin, Creator, Designer, or Viewer).
A Revoke All Tokens action lets admins instantly invalidate every PAT in the tenant. When PATs are disabled, the PAT menu item is hidden from the user dropdown — unless a user has an existing token, in which case they can view and delete it, but not create new ones.
Could not display content
OEM API: Null and Undefined Filter Parameter Support
Section titled “OEM API: Null and Undefined Filter Parameter Support”OEM filterParameters now support null and undefined as valid filter types, end-to-end — from the OEM API through validation to the Admin UI.
-
Passing
undefinedclears the filter entirely (select all) -
Passing
nullfilters for null values
Previously, validation upstream of the engine was blocking these values even though the engine itself could handle them. All existing parameter types continue to work as before.
This clears filter parameter entierly:
"filterParameters": { "[segmentation_id].[undefined]": null }This filters by null value:
"filterParameters": { "[segmentation_id].[null]": null }Workbooks Preserved When Removing Data Connections or Semantic Layers
Section titled “Workbooks Preserved When Removing Data Connections or Semantic Layers”Deleting a data connection or semantic layer no longer removes associated workbooks. Instead, workbooks are preserved and a modal prompts the user to resolve the missing dependency before accessing the workbook.
This prevents accidental data loss caused by users overlooking deletion warnings.
Reporting
Section titled “Reporting”Minor updates to our reporting engine improve the display of fine text and details in report images.
4.13 - 22 June 2026
Section titled “4.13 - 22 June 2026”✨ Nash AI in the Workbook Editor 🚀
Section titled “✨ Nash AI in the Workbook Editor 🚀”Nash (public preview) is now available as a panel in the Workbook Editor. Access it via the AI icon at the bottom of the left toolbar.
Dashboard Generation
-
Generate a full dashboard from scratch by describing your goal in plain language
-
Nash reads the connected semantic model and recommends a dashboard focus before building
-
Guided intent flow asks up to two questions to align on scope (e.g., sales performance vs product breakdown)
-
Step-by-step build plan is shown in the panel so you can follow every action Nash takes
-
Generated dashboards include filters, KPI cards, charts, and detail tables placed and configured automatically
Dashboard Updates
-
Ask Nash to update any part of an existing dashboard in plain language
-
Supports adding new chart types including Sankey diagrams and heatmaps
-
Cross-visual formatting changes applied in a single action (e.g., changing currency across all charts)
-
Layout relayout supported: Nash repositions components to accommodate additions
-
Measure and dimension binding handled automatically based on semantic model context
✨ Nash AI in the Semantic Layer 🚀
Section titled “✨ Nash AI in the Semantic Layer 🚀”Nash (public preview) is now available inside the Semantic Layer editor as a conversational assistant for your data model.
Model Discovery
-
“Describe my semantic layer” produces a structured summary of tables, joins, dimensions, and measures
-
Relationship map narrated in plain language, including table groups and join patterns
-
Quick observations highlight potential issues such as incomplete joins or non-standard aggregations
-
Nash keeps context across follow-up questions within a session
Measure Intelligence
-
“Give me an overview of all measures” returns a full catalogue grouped by type
-
Each measure described with formula, source table, filters applied, and analytical purpose
-
Time intelligence measures identified and explained (MTD, QTD, YTD, YoY)
-
Nash flags bootstrap metrics and non-standard aggregations so you know what to watch
AI Suggestions on the Model Canvas
-
Measure Suggestions available from the canvas toolbar
-
Dimension Suggestions available from the canvas toolbar
-
Field Alias Suggestions for cleaner naming across the model
-
Join Suggestions to help complete the model relationship web
Learn more:
AstratoNash AI | Astrato’s AI Assistant | Astrato Help & Documentation
Publish workbooks and semantic layers between environments
Section titled “Publish workbooks and semantic layers between environments”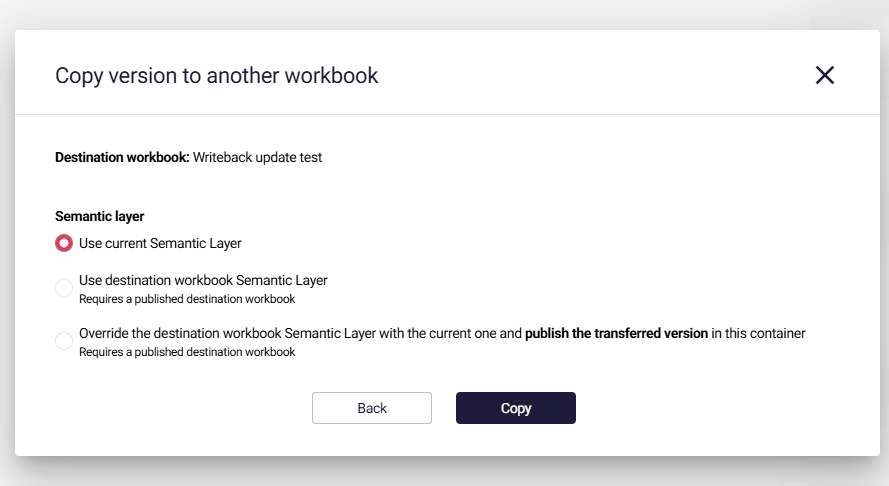
When copying a workbook version to another workbook, you can now choose how the Semantic Layer is handled:
-
Use Current Semantic Layer
- Transfer the workbook version and keep using the source workbook’s Semantic Layer.
-
Use Destination Workbook Semantic Layer
- Transfer the workbook version and automatically connect it to the Semantic Layer already used by the destination workbook.
-
Override Destination Semantic Layer
- Replace the destination workbook’s Semantic Layer with the source workbook’s Semantic Layer and publish the transferred version into the destination workbook.
Moving content between development, testing, and production environments is now much simpler:
-
Promote workbook changes between environments faster.
-
Reuse existing Semantic Layers where appropriate.
-
Keep workbook and Semantic Layer changes aligned during deployments.
-
Reduce manual setup and configuration errors.
Requirements
Some Semantic Layer transfer options require the destination workbook to already have a published version available. Unsupported options will be disabled until this requirement is met.
Workbooks | Duplicate workbooks directly from the lobby
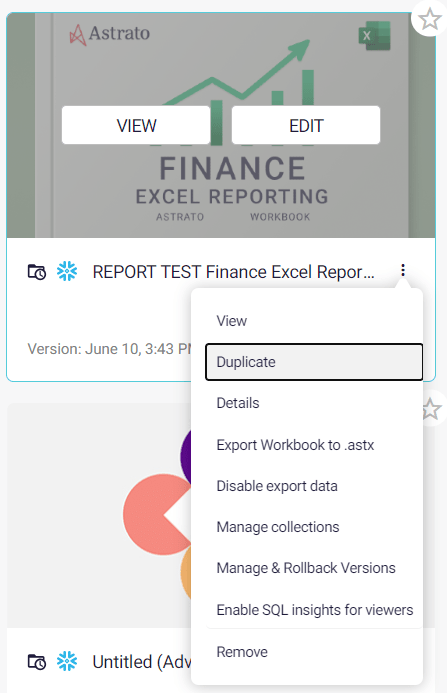
Section titled “Workbooks | Duplicate workbooks directly from the lobby”A new Duplicate Workbook option has been added directly to the workbook menu for published workbooks.
Selecting this option will create a new workbook using the currently published version as the source.
Performance | Pageload improvements ⚡
Section titled “Performance | Pageload improvements ⚡”Shared assets (fonts, css etc) load more quickly, across the workbook editor, published and embedded workbooks.
Multi-level / Hierarchical Collections
Section titled “Multi-level / Hierarchical Collections”Collections can now be organised into multi-level hierarchies using a simple path structure.
Instead of managing all collections in a flat list, you can create nested collection structures to better organise content across teams, departments, projects, or business areas.
Examples:
Collection Name
| Visible Structure
|
Marketing/Advertising
| Marketing → Advertising
|
Marketing/Email-CRM
| Marketing → Email-CRM
|
Marketing/Advertising/Performance
| Marketing → Advertising → Performance
|
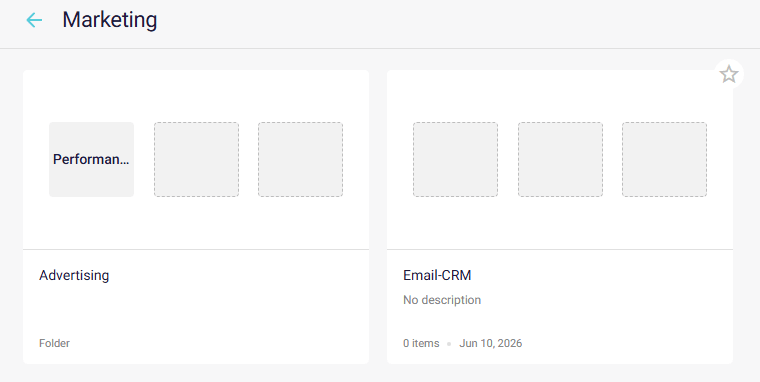
Hierarchical collections are created automatically from the collection path. No additional steps are required.
Permissions Clarification
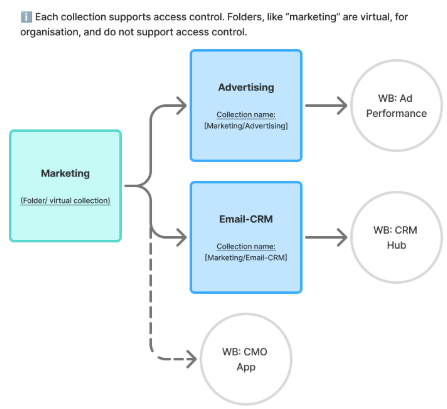
Section titled “Permissions Clarification”To avoid confusion when using collection hierarchies, collection permissions now clearly indicate that access control is managed at the collection level.
Virtual folders do not have permissions, and permissions are not inherited between collections.
For example:
-
Marketing/Advertising can have one set of members
-
Marketing/Email-CRM can have a different set of members
-
Access to Marketing/Advertising does not automatically grant access to Marketing/Email-CRM
An informational message is displayed within collection permission management to make this behaviour clear.
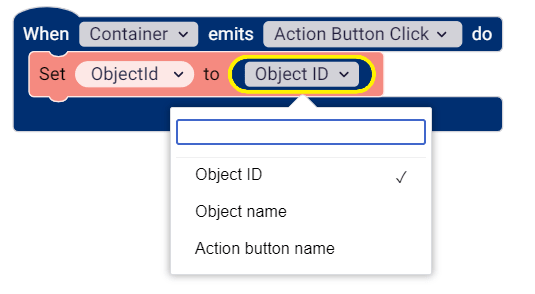
Actions | Get object name/object ID
Section titled “Actions | Get object name/object ID”-
-
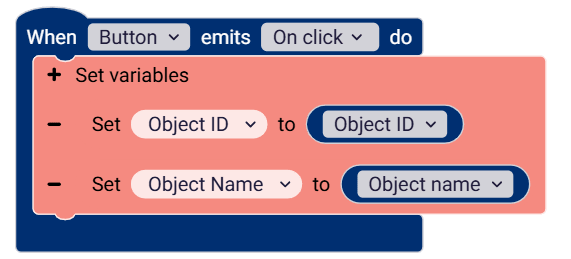
When a user clicks on a button, chart, or custom action button in the container, Astrato can share the name or ID of the object. Helpful when working with object specific parameters, such as storing and retrieving objects for favouriting.
-
Actions | Reset variable action block
Section titled “Actions | Reset variable action block”-
-
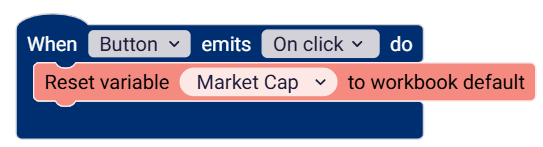
Variable values, if designed this way, can be changed by users. This action block resets the variable value to the default set in the variables panel.
-
Extended Number Formatting
Section titled “Extended Number Formatting”CSV & XLSX exports respect number & date formats set in Astrato charts and tables.
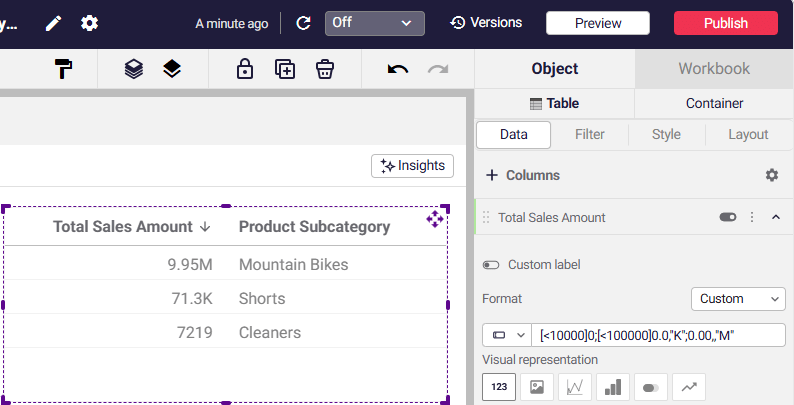
Number formatting has been extended to allow more complex formats, supporting multi-format options, such as choosing multiple/dynamic formats, for example, for use as abbreviations:
Example
[<10000]0;[<100000]0.0,"K";0.00,,"M"
Value | Output |
999 | 999 |
9,999 | 9999 |
10,000 | 10.0K |
45,500 | 45.5K |
99,999 | 100.0K |
100,000 | 0.10M |
1,250,000 | 1.25M |
Week Formatting
As part of number formatting updates, we have updated our existing week number formatting to use ISO Week, to standardise our output.
Check permissions on publishing workbooks
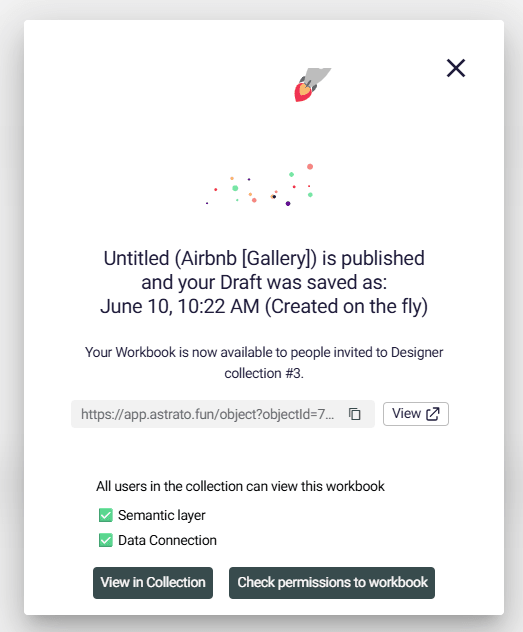
Section titled “Check permissions on publishing workbooks”Editors can now check permissions when publishing a workbook. Feedback will be shown if users/groups in the collection, do not have access to the semantic layer or data connection. This check begins when clicking the Check permissions to workbook button.
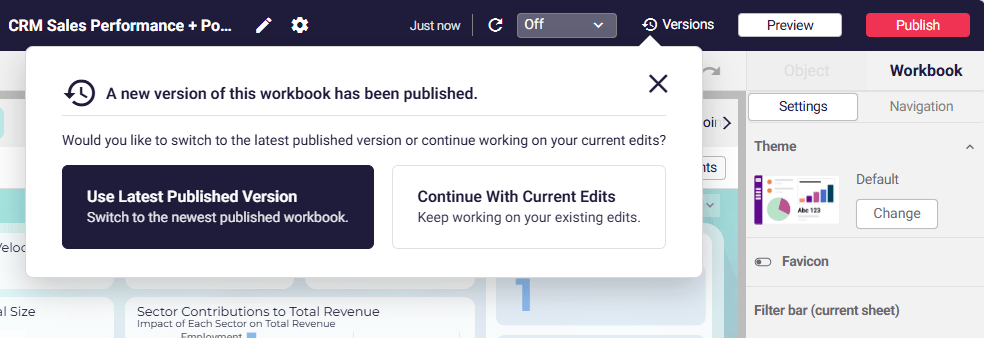
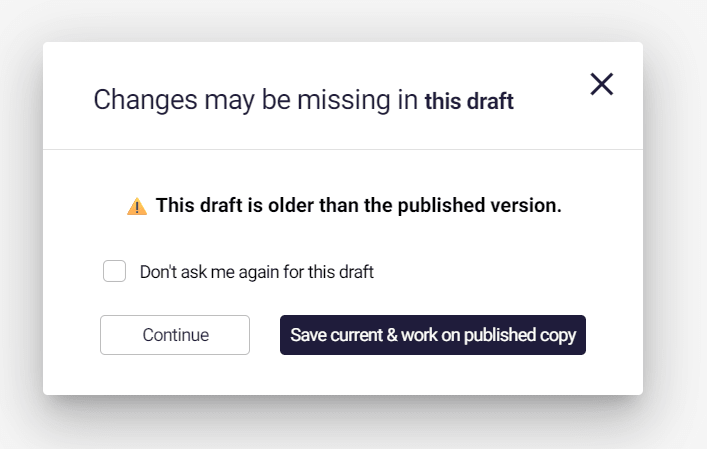
Updated UI to notify editors if the current draft is older than the latest published version
Section titled “Updated UI to notify editors if the current draft is older than the latest published version”Our new UI is smaller, and does not block your session. If you use the latest published version, Astrato will automatically capture a version of your current draft, in case there are any edits you want to revisit.
Semantic Layer | Custom SQL Fields - Parameter Support
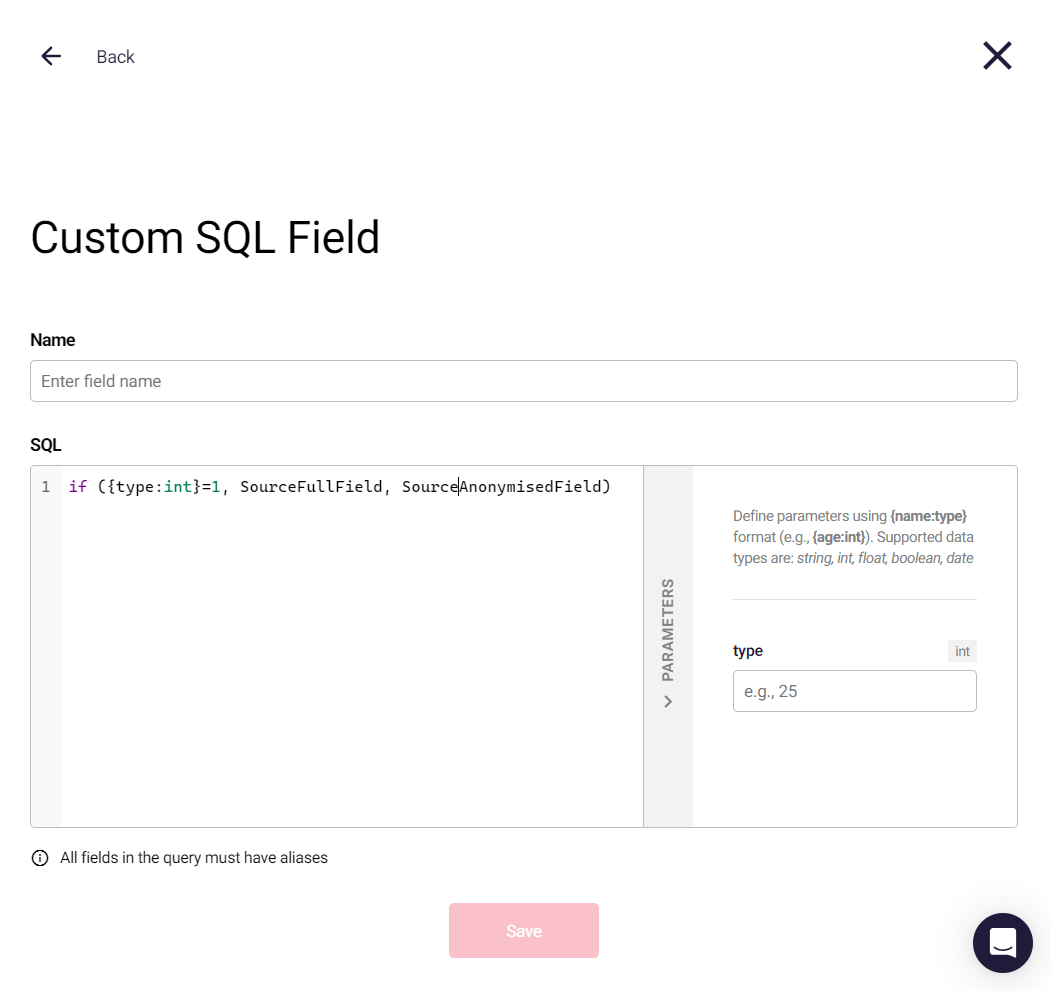
Section titled “Semantic Layer | Custom SQL Fields - Parameter Support”Enable Custom SQL Fields to reference parameters, allowing dynamic logic to control which fields are returned. This supports use cases like anonymisation, user-based visibility, and conditional display directly in-query.
Why you may want to use custom SQL fields:
-
Show anonymised vs full data based on user type
-
Limit/obfuscate data for certain users
-
Switch fields dynamically without duplicating logic
-
Drive UI behaviour indirectly (e.g. blanking fields → hiding visuals)
Workflows | Access to workflow scheduler for Creators
Section titled “Workflows | Access to workflow scheduler for Creators”Creators can now access workflow scheduling: https://app.astrato.io/reporting?tab=SCHEDULED_WORKFLOWS
Workbook | SQL Insights Access Controls
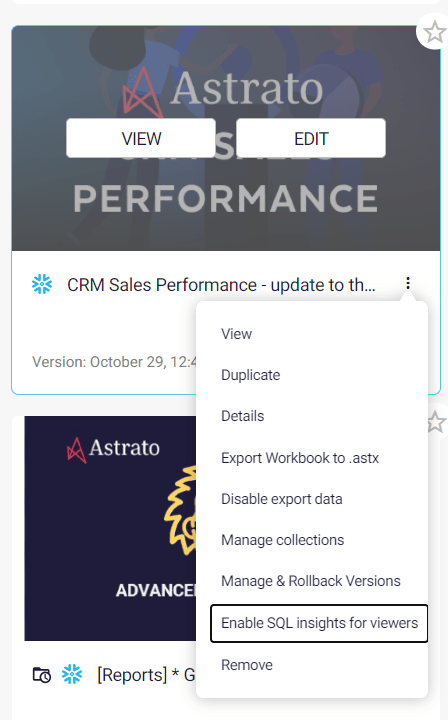
Section titled “Workbook | SQL Insights Access Controls”We’ve updated SQL Insights permissions to make debugging easier for workbook editors while keeping viewer access controlled.
What’s changed?
-
Users with edit permissions on a workbook can now always access Data Query Insights.
-
Viewers will continue to be blocked from Data Query Insights when the setting is disabled.
-
The setting Enable SQL Insights has been renamed to Enable SQL Insights for Viewers to better reflect its purpose.
Why?
Workbook creators, editors, admins, and owners often need access to SQL Insights to troubleshoot and validate queries. This access is now always available to users with edit permissions.
The setting now clearly controls whether workbook viewers can access SQL Insights, making its purpose easier to understand.
Actions | Get object ID, Name, Button name from interacted object
Section titled “Actions | Get object ID, Name, Button name from interacted object”A new action trigger (found in Controls/triggers), helpful for providing user feedback or logging object interactions.
Return single object from embed
Section titled “Return single object from embed”Individual objects from embeds can be presented by calling the URL with the given object ID. An example of how to call an individual object from an embed, is shown below.
ℹ️ If using “scoped variables” and passing variable values over URL parameter, the scoped variables for the object specified in the URL parameter will also be set.
https://app.astrato.io/embed/<embed-id>?objectId=<object-id>
4.12.1 - 03 June 2026
Section titled “4.12.1 - 03 June 2026”Improved Data Picker
Section titled “Improved Data Picker”Focusing on specific date ranges and comparing different periods is essential in any data analytics process. Simplifying the process of selecting different periods enhances users’ self-service capabilities
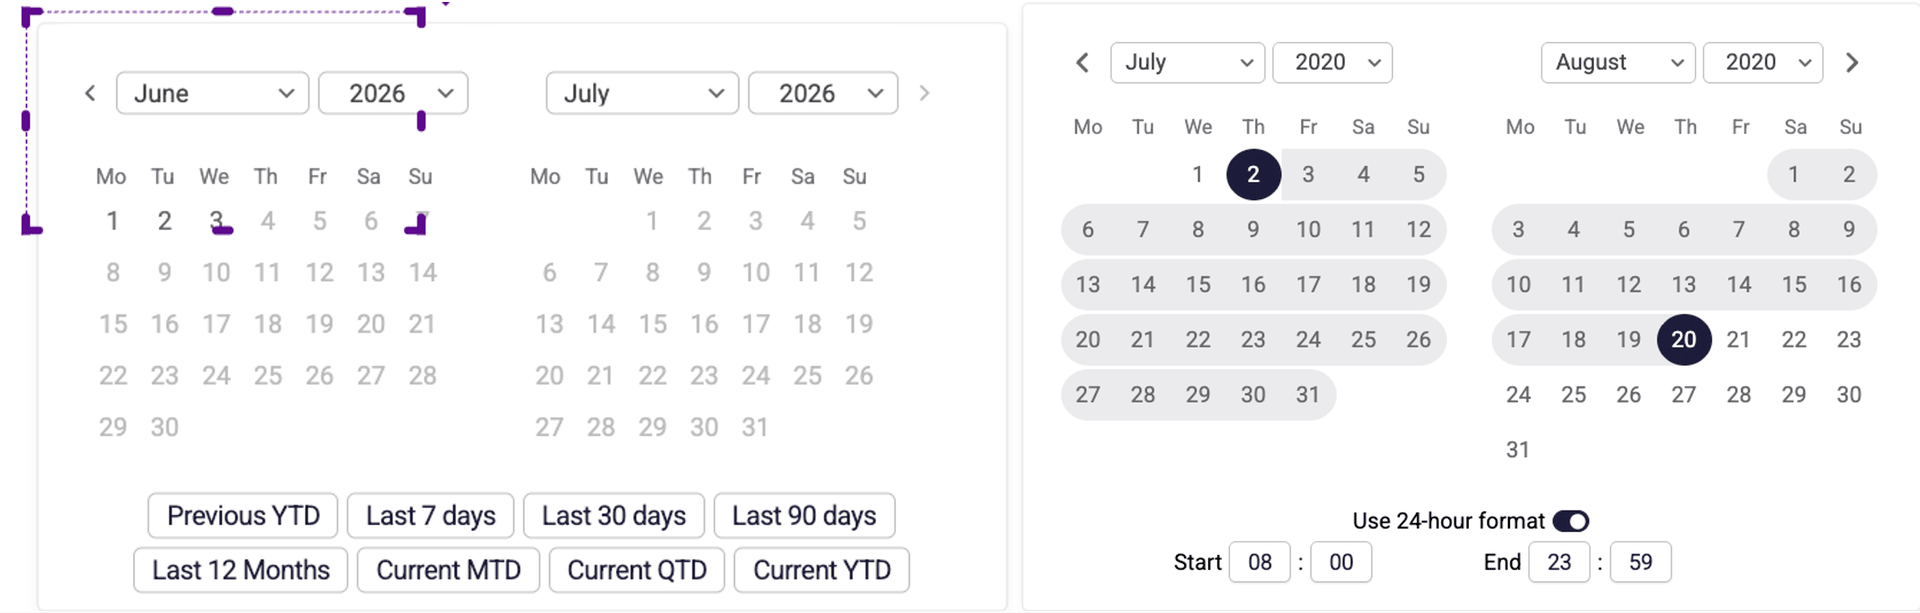
What’s new
-
Display predefined period selection options (last X days, year to date), as part of the date picker object
-
Select ranges including hours for timestamp fields.
-
Improved responsiveness
What this means
-
Simpler and quicker data analysis with time periods
-
Simpler maintenance of data apps, time filtering
Example
quickly focus on the last 90 days of activity in one click.
Select the 24-hour period between yesterday’s 6 AM and today’s 6 AM
Pivot Table- Improved Self-Service Analytics
Section titled “Pivot Table- Improved Self-Service Analytics”A pivot table is one of the most powerful tools for data analytics. It allows users to answer multiple business questions by drilling into different dimensions and reordering them to view the data from different angles.
What’s new
-
Drill-through dimension directly in the pivot table.
-
Control sorting of the different dimensions.
-
Filter any dimension values
What this means
-
More options for data exploration for users, and more business questions can be answered
-
Simpler maintenance and building of powerful pivot tables.
4.12 - 31 May 2026
Section titled “4.12 - 31 May 2026”User Action Required for Scheduled Reporting Users
Section titled “User Action Required for Scheduled Reporting Users”Next release – failed reports will be flagged more strictly
In the next Astrato release, report delivery becomes stricter so you can trust what reaches recipients. The release is planned for Thursday 4th June AM UTC.
What’s changing
Today, a report can be delivered even when an error occurred during generation, and still show as “completed” in report administration – though the PDF, XLSX, or other file may be incomplete. After this release, any generation error marks the execution as failed, and the incomplete report is not sent.
ℹ️ If you have one failed object (i.e. the query failed/it did not render the chart), then the report is marked as a failed report and will not be sent.
Why it matters
Recipients will not receive partially rendered/incomplete reports, meaning you get a truly accurate view of report reliability.
What you may notice
Some reports that show as successful today may show as failed afterwards. Nothing has broken – this more strictly identifies a report that was not 100% completed.
What to do
After the release, please open report administration and review any reports newly marked as failed. Resolving them fixes issues that were previously going unnoticed.
We’ve also improved error handling in report actions, so you can choose whether an error should stop a report or be handled so it continues.
Writeback Astrato Metadata for Telemetry/Governance (Private Preview)
Section titled “Writeback Astrato Metadata for Telemetry/Governance (Private Preview)”You can now writeback the Astrato Metadata (workbooks, users, groups, collections, sheets, objects, and semantic layers) directly to your database. Admins can navigate to the export page here.
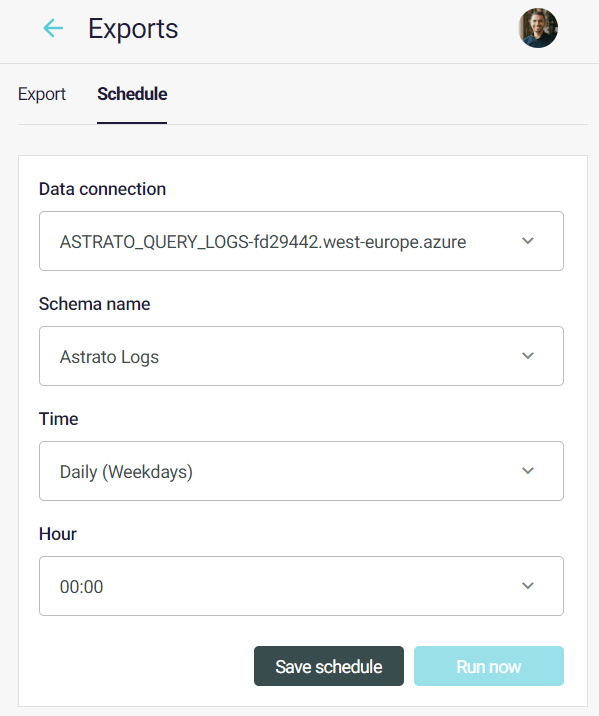
Container Format Painter
Section titled “Container Format Painter”The Container Format Painter is a time-saving capability that lets you copy formatting (such as background color, opacity, radius, border, padding and margin) from one object and instantly apply it to another.
Actions | Access OEM / Session-Context Parameters
Section titled “Actions | Access OEM / Session-Context Parameters”Customers embedding Astrato often pass context through parameters over API (user type, region, flags). By reading the parameters via actions, Astrato can respond instantly enableing true personalized, session-based experiences.
Actions | Reset object state
Section titled “Actions | Reset object state”Re-render objects by using the reset object state action.

4.11.10 - 19 May 2026
Section titled “4.11.10 - 19 May 2026”Collection Management | Smarter Sorting & Faster Discovery
Section titled “Collection Management | Smarter Sorting & Faster Discovery”Managing collections is faster and more predictable with sorting and improved search capabilities.
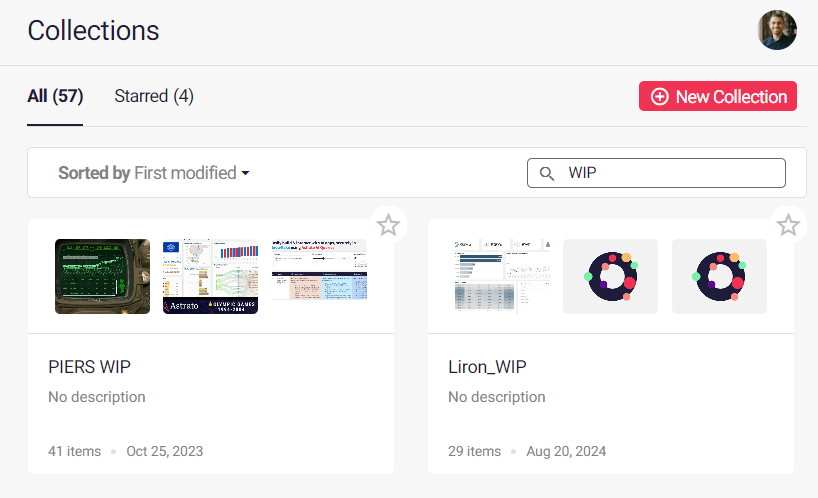
What’s new:
-
Sort by:
-
Updated date
-
Created date
-
Name (A–Z / Z–A)
-
-
Search collections by name with live filtering
4.10.5 - 12 May 2026
Section titled “4.10.5 - 12 May 2026”Additional measure tooltips (via supporting measures)
Section titled “Additional measure tooltips (via supporting measures)”Charts can display extra measures directly inside tooltips using Supporting Measures.
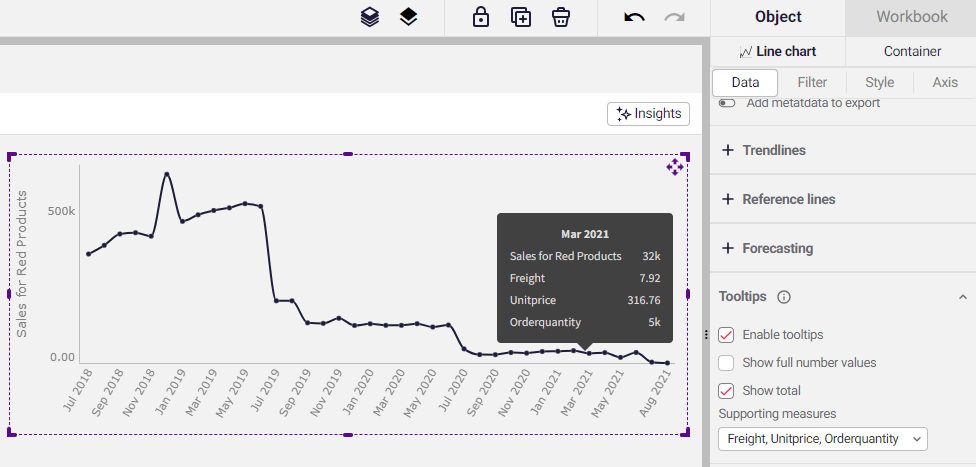
This allows builders to give users more context without cluttering the visual itself. Instead of adding more series, labels, or secondary charts, additional metrics can appear only when needed during hover interactions.
Common use cases include:
-
Revenue + margin + units sold in a single tooltip
-
Showing freight, discounts, or tax alongside sales
-
Adding operational KPIs without overcrowding charts
-
Keeping dashboards cleaner while still exposing detailed context
Supporting Measures are configured directly in the chart object and can be selected to appear in tooltips across supported visualizations.
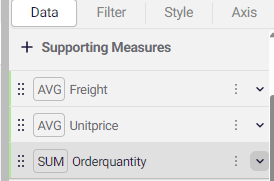
This improves:
-
Data exploration
-
Hover-level detail
-
Dashboard readability
-
Executive reporting experiences
Containers - Custom Buttons for workflows/actions
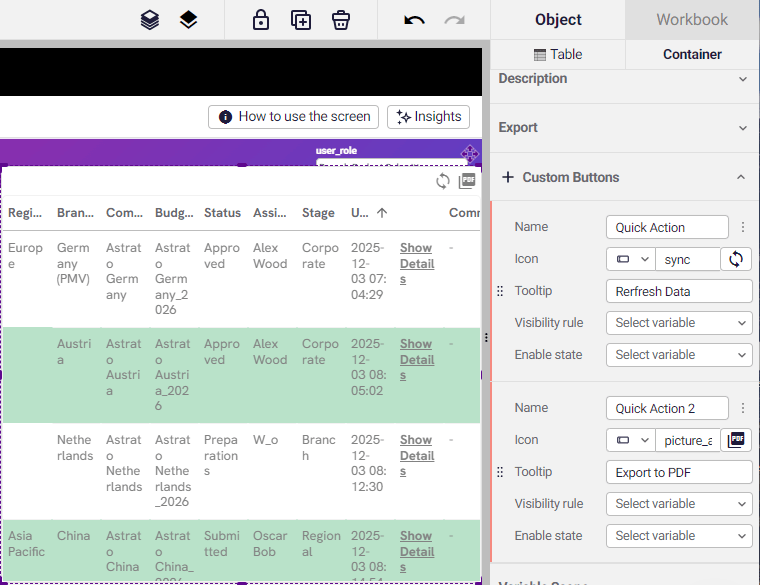
Section titled “Containers - Custom Buttons for workflows/actions”You can add custom action buttons directly into object headers, alongside native controls like Export, Description, and Maximize.
This makes it much easier to build clean, interactive dashboards without adding extra floating buttons or layout work around charts and KPIs.
Common use cases include:
-
Show/hide data labels
-
Toggle dimensions or views
-
Trigger “Email me this chart” flows
-
Change sorting
-
Enable annotations or reference lines
Custom buttons fully support Astrato Actions, including:
-
On Click
-
On Hover
-
On Hover Exit
Buttons inherit native Astrato styling automatically, including theming, hover states, dark mode support, accessibility, and responsive overflow behavior on smaller containers.
Builders can configure:
-
Icon
-
Dynamic icon states
-
Tooltip
-
Visibility rules
-
Enabled/disabled states
-
Button ordering
Active/Disabled State styles for Buttons
Section titled “Active/Disabled State styles for Buttons”Buttons support dedicated Active, Hover, and Disabled styling states, giving builders much more control over interactive experiences without needing to show or hide separate buttons.
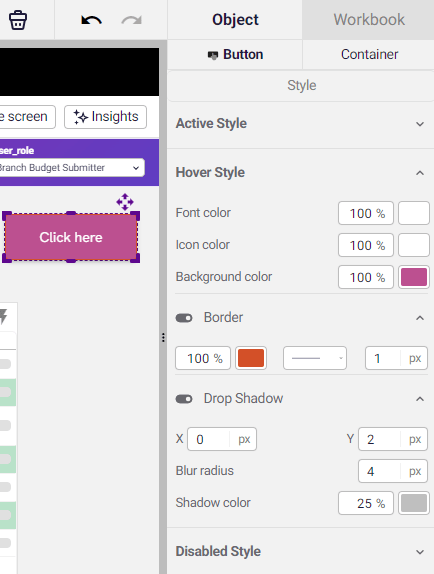
You can now visually communicate:
-
Available vs unavailable buttons
-
Selected or active states
-
Hover feedback for clearer interactions
-
Toggle-style experiences using a single button
This makes workflows cleaner, reduces layout complexity, and avoids the need for duplicate “enabled/disabled” button setups across dashboards and apps.
Supported styling includes:
-
Background color
-
Font color
-
Icon color
-
Borders
-
Drop shadows
4.9.15 - 06 May 2026
Section titled “4.9.15 - 06 May 2026”Collection - Edit/View permissions control
Section titled “Collection - Edit/View permissions control”Collections support separate View and Edit permissions per user or group.
This allows teams to give broader access to shared content, while keeping editing rights controlled. For example, a user can view both Sales and Marketing collections, but only have edit access to Marketing.
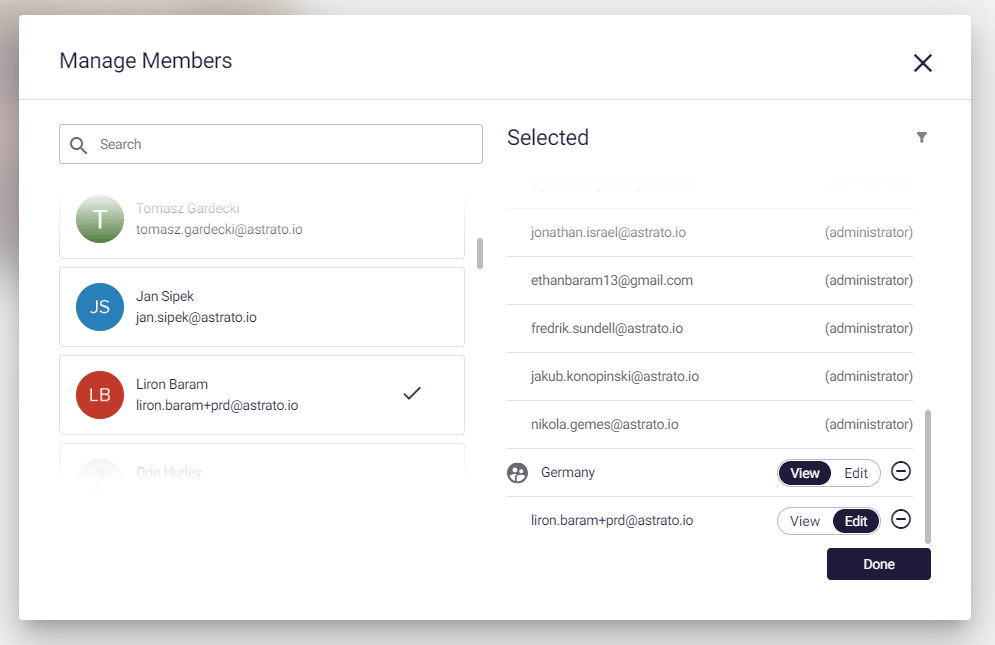
What’s new
-
Set permissions individually for each collection
-
Assign either: View / Edit access
-
Configure permissions for both: Individual users; User groups
What this means
-
Better governance across departments
-
Safer collaboration without over-granting access
-
Easier management of shared workspaces and embedded content
-
Supports mixed access models for cross-functional teams
Example
A regional sales manager may:
-
View global executive dashboards
-
Edit only their regional collection
-
View/Access marketing reports without being able to modify them
Workbook Editor Layers - Move object in/out of groups
Section titled “Workbook Editor Layers - Move object in/out of groups”Object can be moved nin and out of groups seamlessly without breaking your flow. Groups are a great way to keep objects together, or under a shared title, background, and even sizing options like maximise.
Microsoft 365 Encrypted Email Support
Section titled “Microsoft 365 Encrypted Email Support”Astrato email connectors now support Microsoft 365 Message Encryption and Purview policies.
Emails sent through supported Office 365 connectors can now follow existing customer encryption rules, sensitivity labels, and transport policies automatically.
The connector test flow also detects whether encrypted sending is supported and safely falls back to standard Office 365 delivery when unavailable.
4.8.3 - 27 April 2026
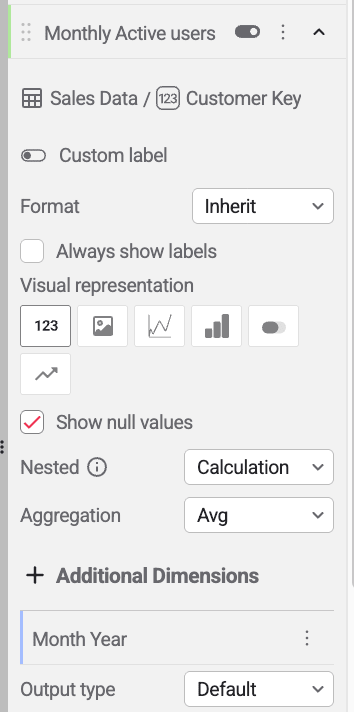
Section titled “4.8.3 - 27 April 2026”Nested calculations in the pivot table
Section titled “Nested calculations in the pivot table”The pivot table now carries nested calculations. Build a deeper layer of results from the measures you already have, without writing fresh SQL.
Use it for:
-
Percentile of a measure
-
Average daily result of a measure
-
Period over period, with a nested time dimension
ℹ️ Note: nested calculations work on every level only when the pivot table has no column dimensions.
Nested calculations now reach UDFs and Percentile
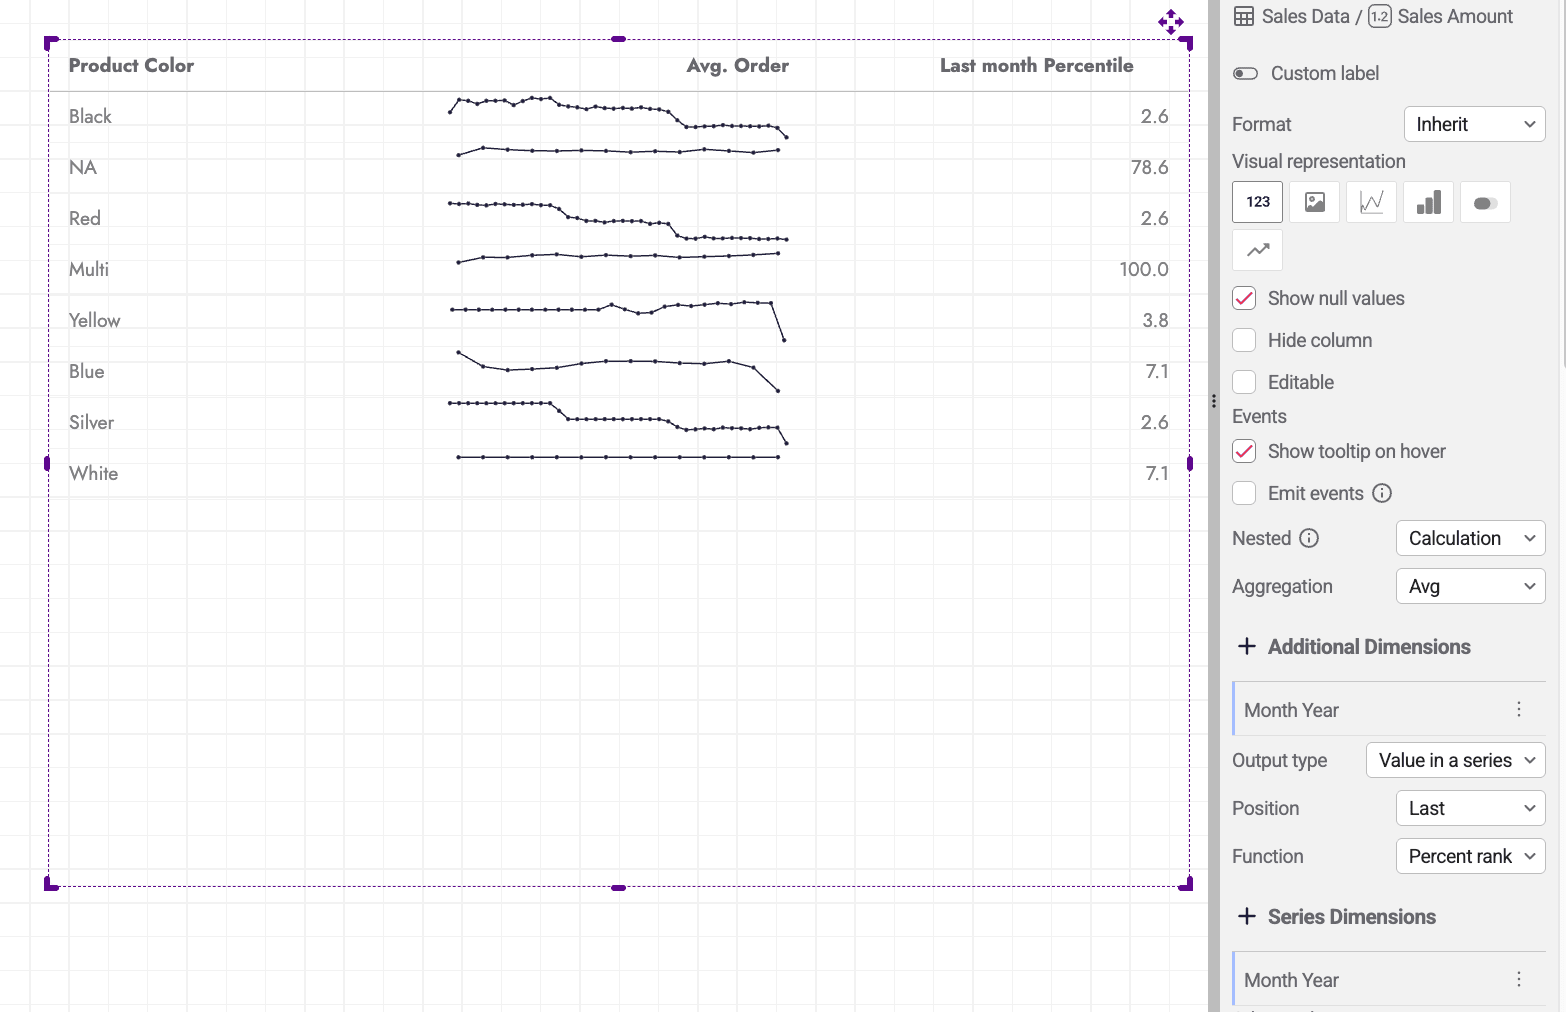
Section titled “Nested calculations now reach UDFs and Percentile”The new result types of nested calculations are open to nested User-Defined Functions (UDFs) and to the Percentile function.
Why it matters: take a measure shaped by a UDF, then lay a percentile, an average daily, or a period-over-period on top. The same logic that drives the pivot now reaches into your custom measures.
4.8 - 22 April 2026
Section titled “4.8 - 22 April 2026”Workbook Search by description in Astrato Lobby
Section titled “Workbook Search by description in Astrato Lobby”Finding the right workbook shouldn’t mean scrolling through endless lists.
We’ve expanded search to go beyond just names — making it much easier to locate the content you need, even when you don’t remember the exact title.
Looking for a sales dashboard but can’t remember its name?
Just type “sales” to find it instantly by description.
What’s changed
-
Search now includes workbook descriptions as well as names
-
Results update instantly as you type
-
Improved relevance when using broader or partial keywords
Why this matters
-
No more guessing exact workbook names
-
Faster navigation across large environments
-
Easier discovery of shared or older content
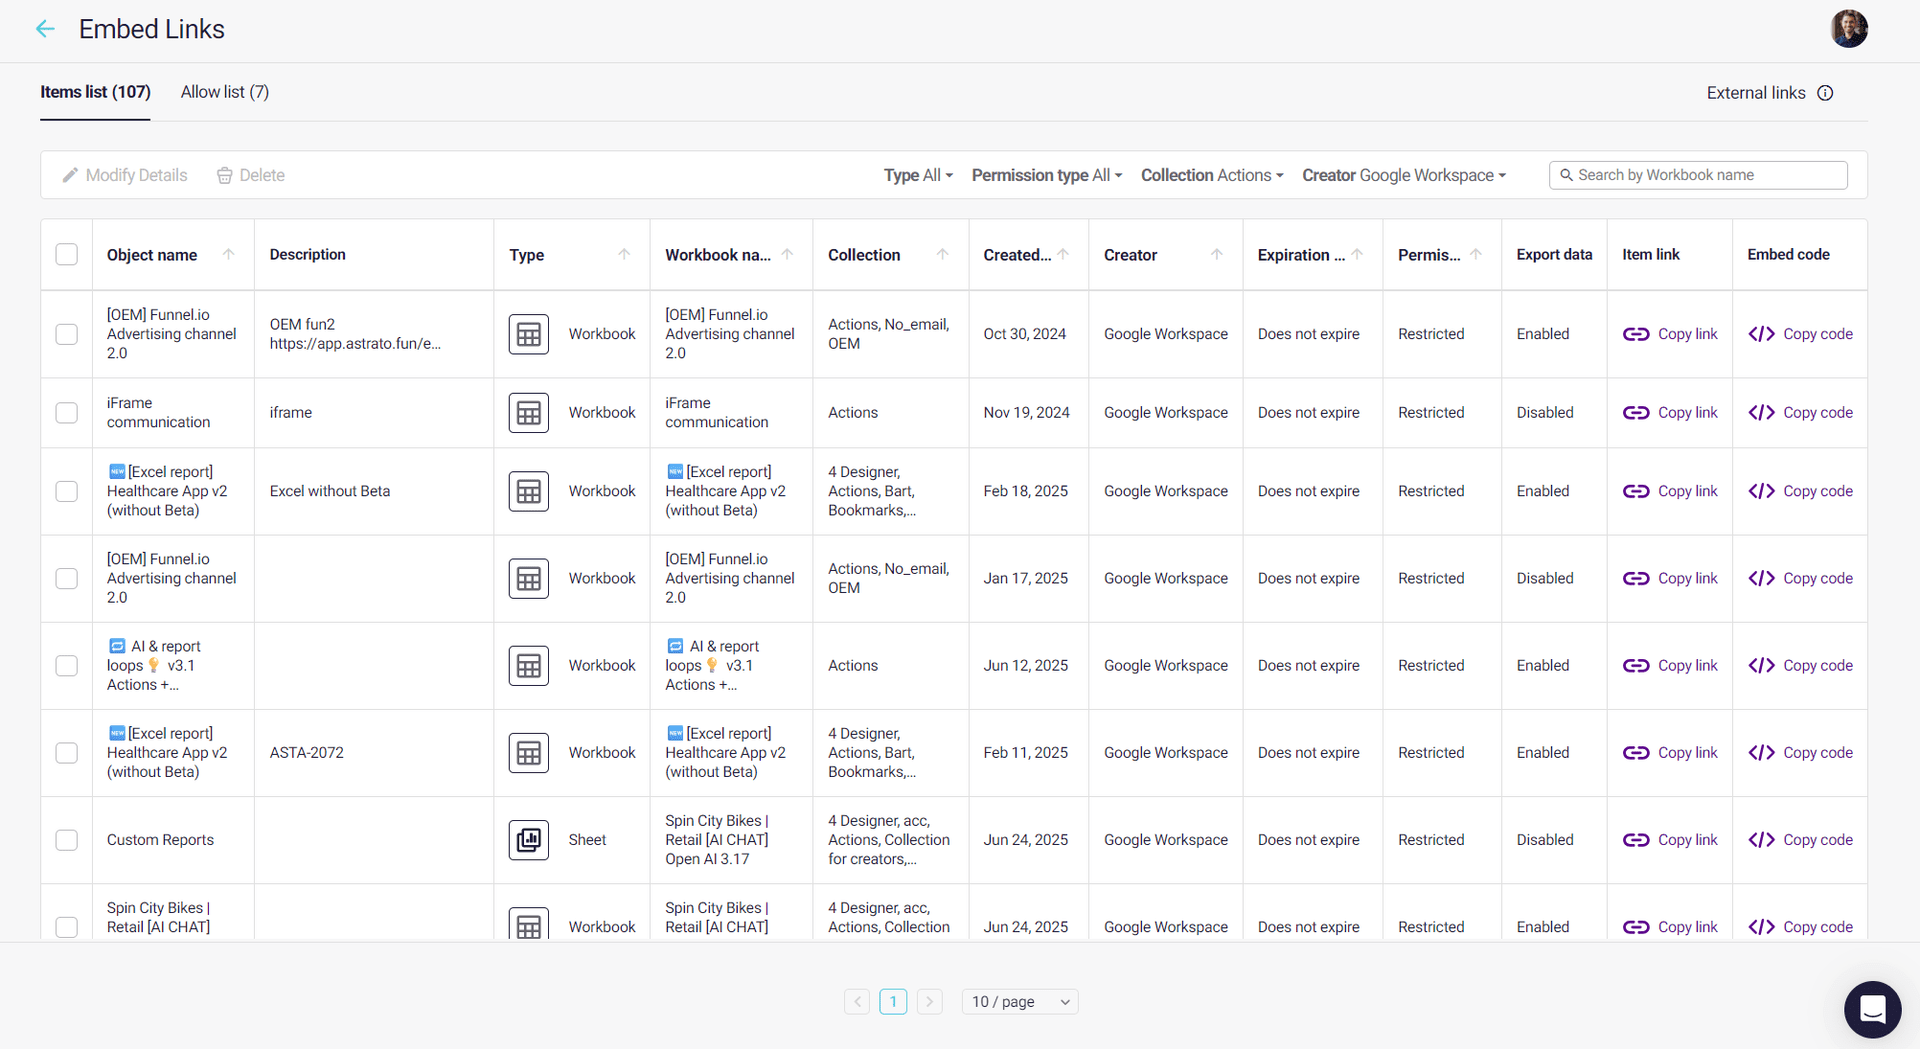
Embeds management
Section titled “Embeds management”Embeds data is now richer and easier to navigate
4.7.8 - 15 April 2026
Section titled “4.7.8 - 15 April 2026”Container Opacity
Section titled “Container Opacity”Object containers have a dedicated Opacity setting. You can control visibility directly from the container panel, and change it at runtime using actions.
A new Opacity field is available in the Container Settings panel for every object container and group. It accepts a value from 0% (fully transparent) to 100% (fully opaque), defaulting to 100%.
Action: SetContainerOpacity
In any action flow, add Set Container Opacity, then set your target container and the opacity value. Parameters:
-
Target Container — the container or group to affect
-
Opacity Value — the % to set
Could not display content
Common Use Case
-
User clicks a button that triggers a writeback or custom SQL action
-
A
SetContainerOpacityaction fires first, fading the affected container to 0% -
The data updates complete
-
A second action restores opacity to 100% — optionally with a fade-in transition
Could not display content
Microsoft Entra ID Federation Support
Section titled “Microsoft Entra ID Federation Support”Astrato now supports user federation with Microsoft Entra ID (Azure AD) — letting enterprise users sign in through their existing Microsoft identity, with Snowflake federation flowing through automatically.
Astrato’s existing OAuth/OIDC federation layer has been validated and extended to support Entra ID as a fully configured identity provider — per tenant, with no compromise on token security.
What’s included:
-
OIDC login flow through Microsoft Entra ID, validated end-to-end
-
Per-tenant federation config — issuer, client ID, tenant ID, and redirect URI all configurable independently
-
Email and display name claims mapped and supported out of the box
-
JIT provisioning — users are created or linked automatically on first login
-
Full token validation — signature, issuer, audience, and expiry all checked
-
Federation from Entra ID through to Snowflake, mirroring the existing OAuth pattern
Setup
Entra ID federation is configurable directly from the Astrato admin UI. No code changes needed on your side — set up your enterprise app in Entra ID, point Astrato at your tenant, and your users are in.
Full docs: AstratoAzure AD / Entra ID & Snowflake Federated Identity Setup Guide | Astrato Help Center
Rich text editing - color picker
Section titled “Rich text editing - color picker”In our rich text editor, used in text objects, titles and more, we’ve added a custom color picker which support RGB, HSL and HEX coloring. Get artsy🎨.
4.6.5 - 01 April 2026
Section titled “4.6.5 - 01 April 2026”🆕 Charts | Tree Chart: KPI Tree / KPI Row
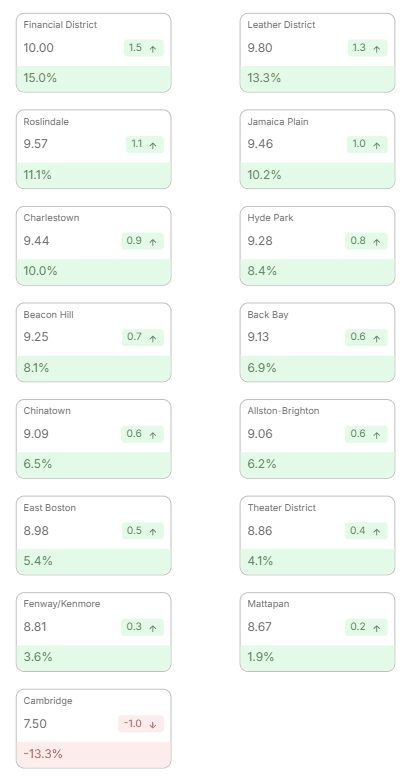
Section titled “🆕 Charts | Tree Chart: KPI Tree / KPI Row”KPI Tree is a visual that breaks a top metric into its drivers, showing what changed and why. This guide covers how to analyse KPIs, compare performance across dimensions, and use KPI Tree, KPI Trellis / KPI Rows for clearer, connected reporting.
KPI Row
Use when you just need a fast read of KPIs, with minimal setup.

KPI Tree
Use when you need to explain change or drivers behind a metric.
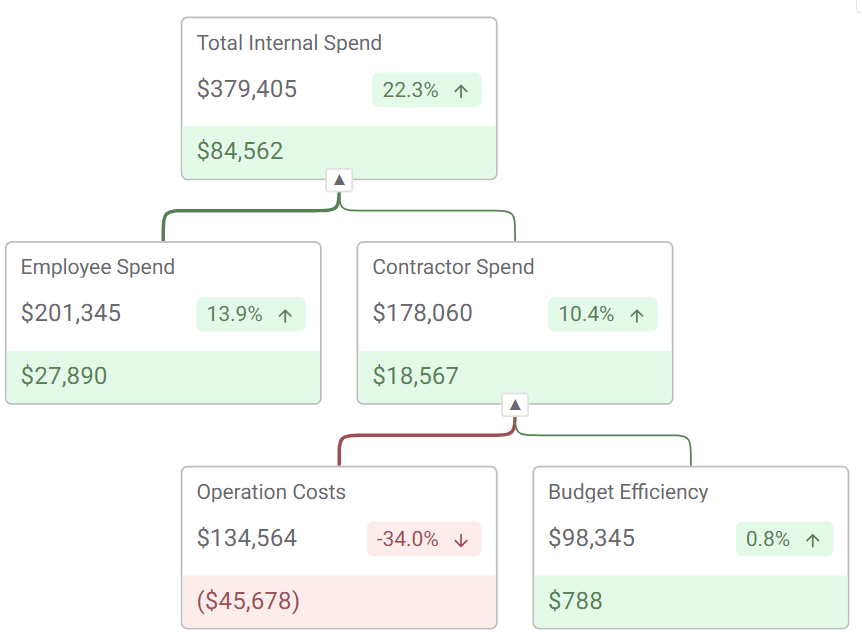
KPI Trellis
Show a single KPI, split by dimension for easy comparison.
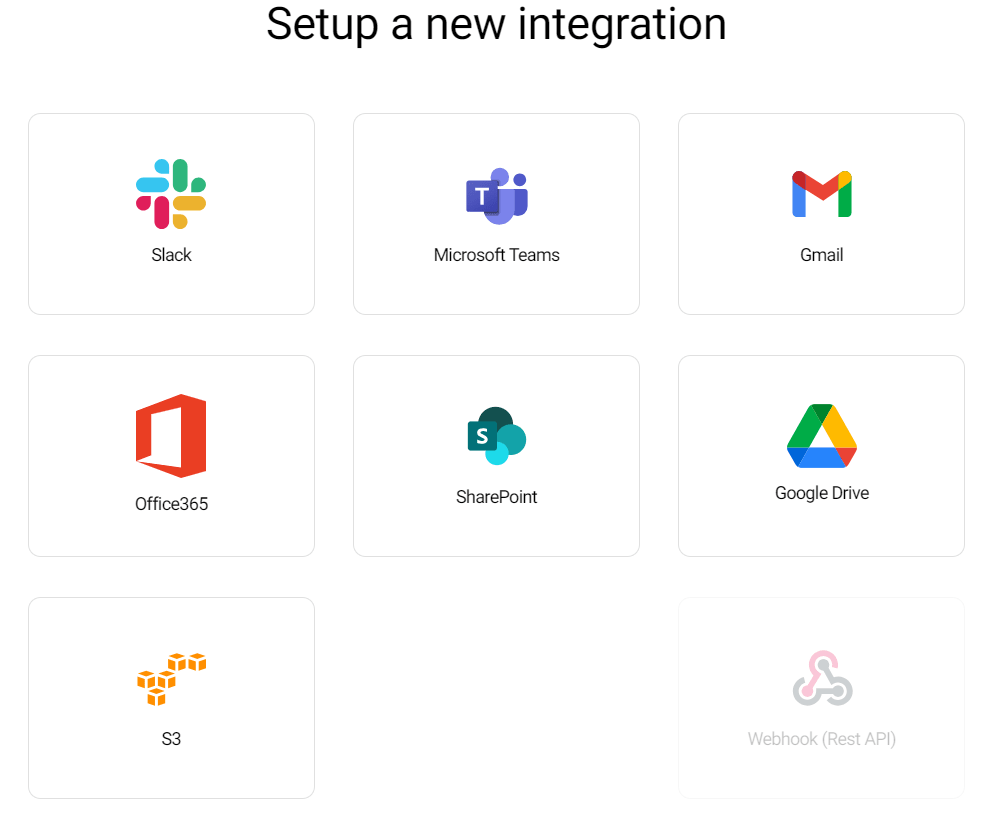
Reporting | Office 365 & Gmail integration
Section titled “Reporting | Office 365 & Gmail integration”Mailable PDF/Excel/PPT reports can be sent from Gmail and Office 365 email providers.
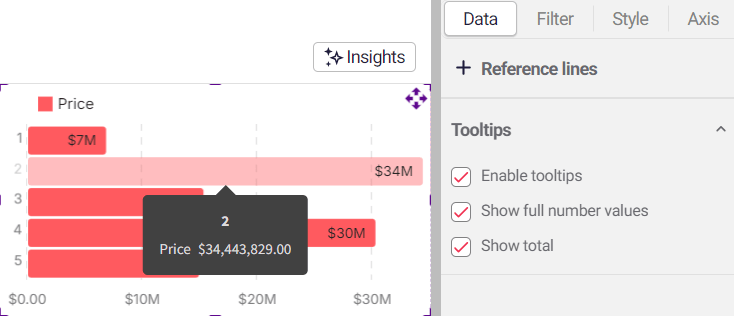
Charts | More detail in Tooltips - Show full numbers in tooltips
Section titled “Charts | More detail in Tooltips - Show full numbers in tooltips”To enable further detail in tooltips, the option “Show full number values” forces numbers (number, money) in tooltips to use 2 decimal places.
Workbook | Grouping Performance
Section titled “Workbook | Grouping Performance”Improved performance when grouping and resizing objects, making editing smoother and more responsive. Your group changes are processed more quickly, eliminating any chance of “object drift” which was experienced with busy groups.
4.5.6 - 26 March 2026
Section titled “4.5.6 - 26 March 2026”Semantic Layer | Enforced Global Data Reduction - Private Preview
Section titled “Semantic Layer | Enforced Global Data Reduction - Private Preview”Astrato’s Semantic Layer offers the option to apply a filter across all tables (via a join), even if that table is not required in the analytics/visualization results. This extends the data reduction capability by always checking against data-reduction lookups to ensure users are served the most relevant data.
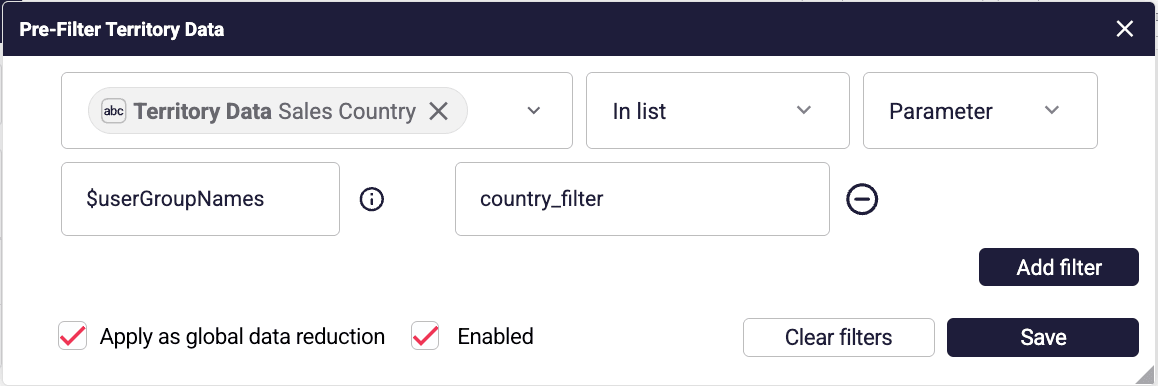
You can enable this by using the “Apply as global data reduction” option, on any table which has a filter applied.
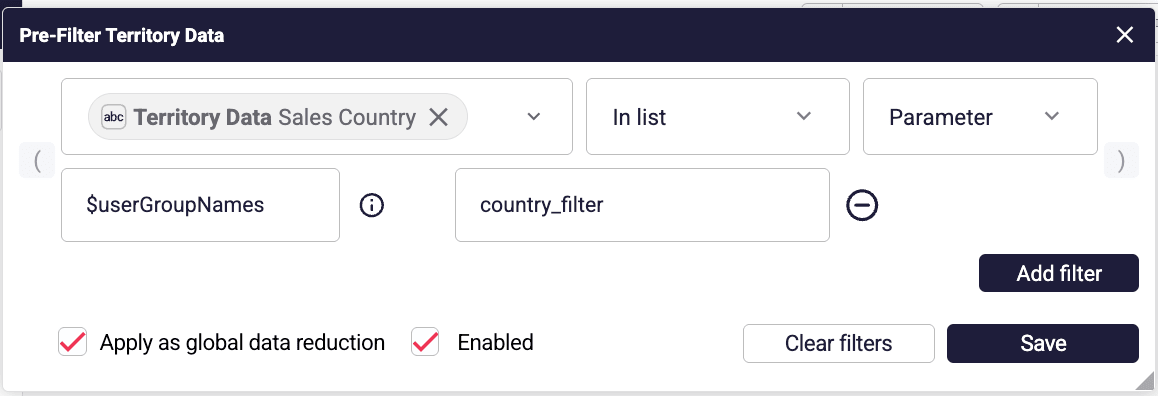
Semantic Layer | Parameter for User Groups
Section titled “Semantic Layer | Parameter for User Groups”You can now filter the data directly in the semantic layer, based on the user’s group. Filter the data associated with the name of the group.
As shown below, when you choose a parameter to filter to, you can enter **$userGroupNames** the parameter name to load the current users’ groups. Multiple groups may be returned if a user is part of multiple groups. Groups will be returned in a comma-separated list.
AI Providers | Support for Claude
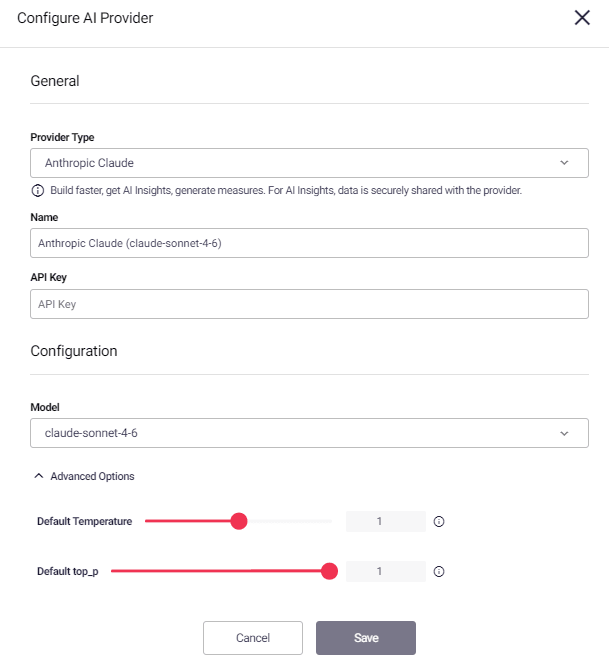
Section titled “AI Providers | Support for Claude”Claude is now supported as an AI Provider! Get your AI Insights and Custom Report powered by Claude.
Line & Scatter Charts | Enhanced axis spacing for shapes
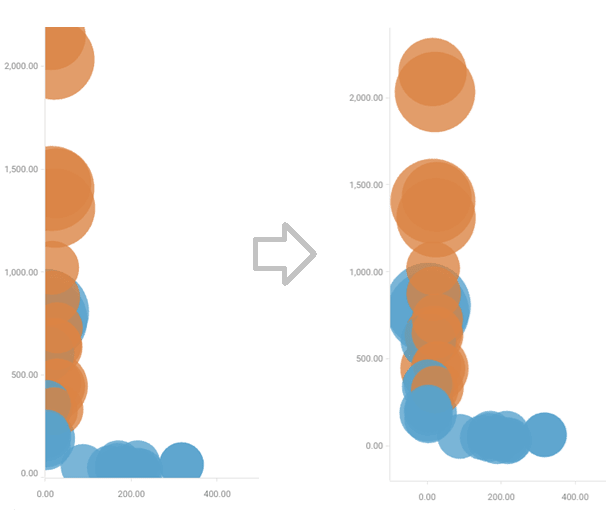
Section titled “Line & Scatter Charts | Enhanced axis spacing for shapes”We heard you wanted more space to see datapoints, we added some more breathing room to make charts with larger shapes and lines, easier to read. In the example below, the bubble have much more space to be viewed.
Charts | Enable/disable Sorting per field (performance)
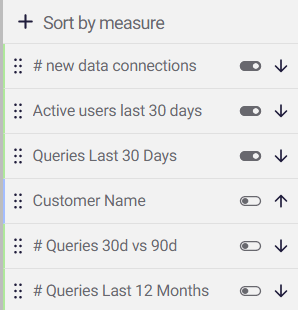
Section titled “Charts | Enable/disable Sorting per field (performance)”Sorting items can now be individually enabled/disabled, allowing more control over custom sorts, as well as control over perfomance.
ℹ️ Disabling sorting on dimensions, especially on wide tables visualisations, can improve performance.
4.4.7 - 19 March 2026
Section titled “4.4.7 - 19 March 2026”Reporting
Section titled “Reporting”We’re introducing a major upgrade to reporting in Astrato, making it more flexible, scalable, and powerful.
Reports can now be distributed to Slack, Teams, Google Drive, Sharepoint, S3
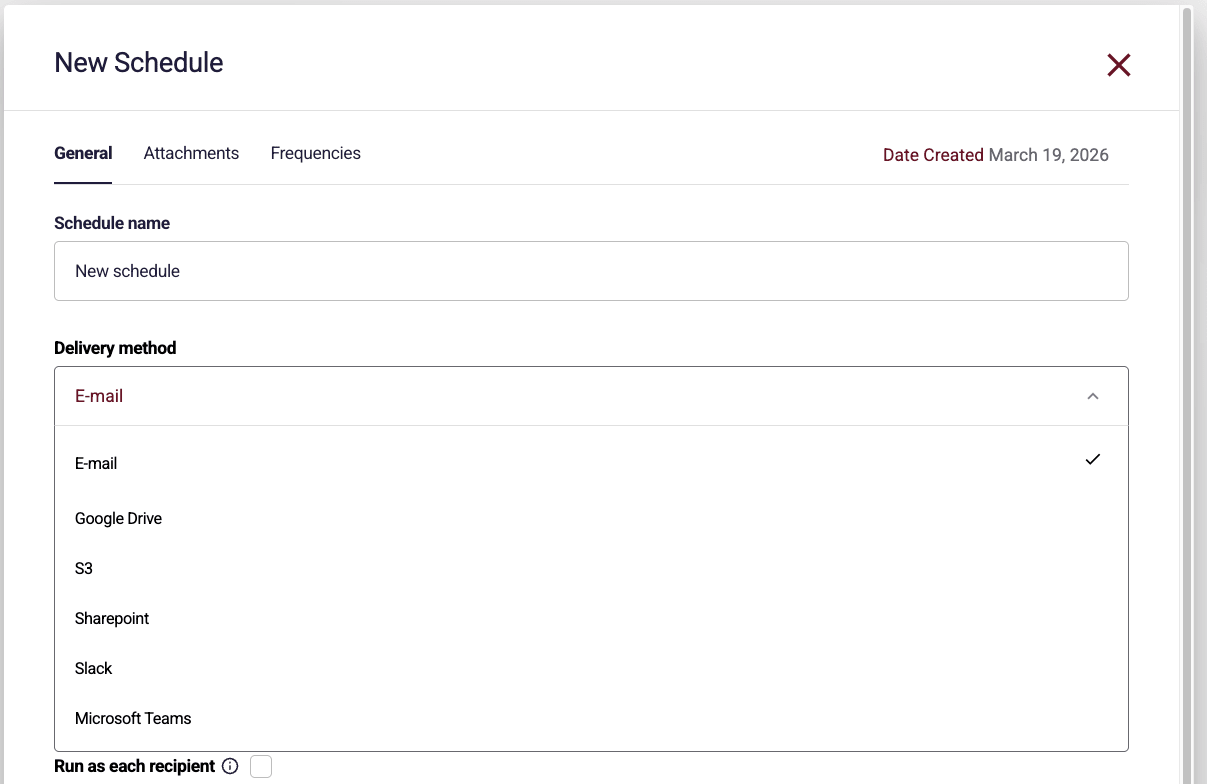
This enables seamless integration with your existing data, storage, and automation ecosystems.
🔄 Unified Reporting Block
Section titled “🔄 Unified Reporting Block”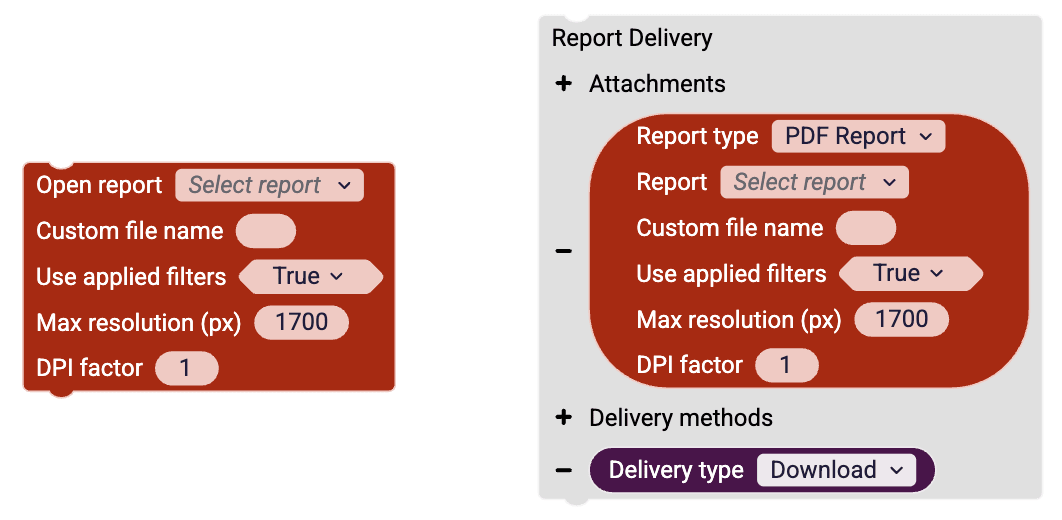
The existing Open Report and Send Report blocks have been replaced with a new, unified Report Delivery block.
With this new block, you can:
-
Add multiple report attachments in a single step (PDF, Excel, PowerPoint)
-
Deliver reports to multiple destinations simultaneously
-
Download (in-browser)
-
Email
-
Messaging platforms (Slack, Teams)
-
Cloud storage (S3, SharePoint, Google Drive)
-
-
Optionally zip attachments and apply encryption
This simplifies workflows and enables more advanced reporting use cases.
Versioning | Save & share versions
Section titled “Versioning | Save & share versions”You can now share versions with other creators, as well as see which other users have saved drafts and when. Please note private drafts are not previewable, unless the draft owner shares the draft. | Could not display content |
Active sheet group highlighting
Section titled “Active sheet group highlighting”The current sheet group is now clearly marked in navigation with a dot, as well as active text. Helps users instantly see where they are, especially in larger workbooks with multiple sheet groups.
Active sheet group highlighted Could not display content | ℹ️Reminder 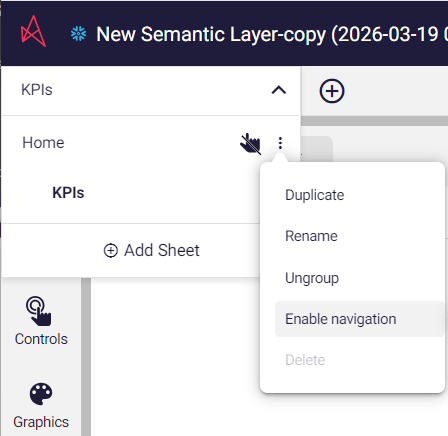 |
ℹ️ Workbook Object Order
Section titled “ℹ️ Workbook Object Order”Objects now render in the same order shown in the Layers panel. Set your KPIs and fastest charts to load first for the best Astrato experience!
Export Astrato Platform data
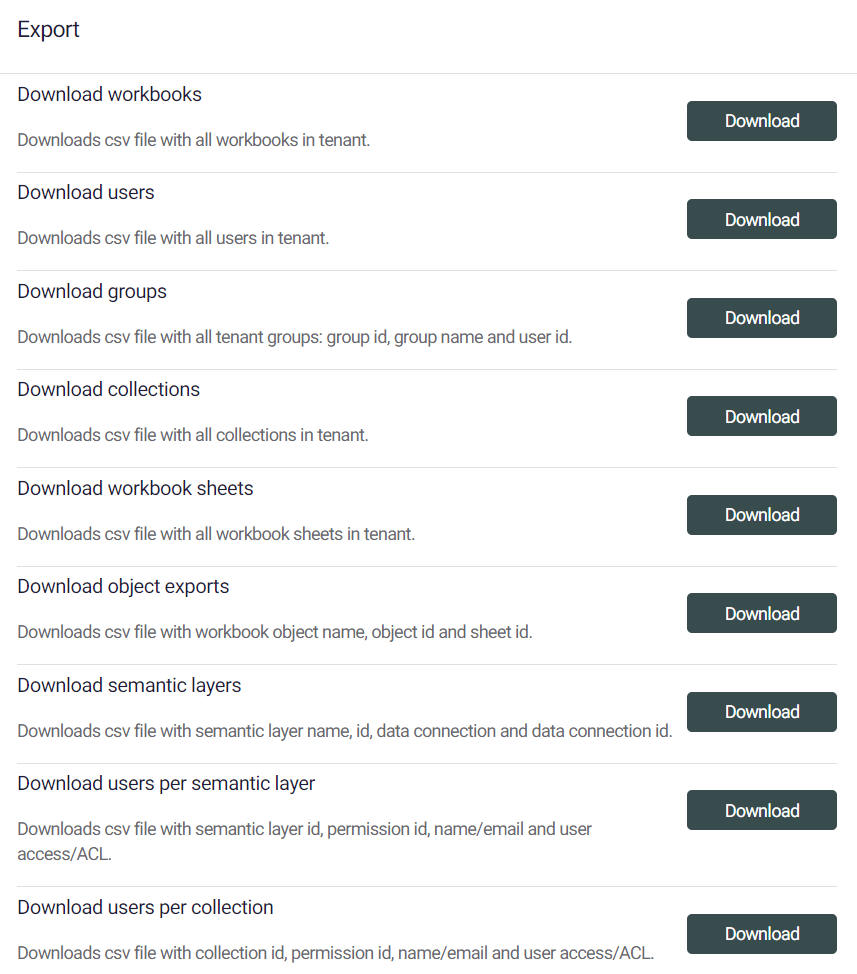
Section titled “Export Astrato Platform data”You can now export even more tenant-level data (workbooks, users, groups, collections, sheets, objects, and semantic layers) as CSV. Admins can navigate to the export page here. https://app.astrato.io/administration/exports
If using this approach, please setup the workbook using the following the steps: here. Currently this workbook is required for the process, across any data connection, not just snowflake.
Use this alongside query logs/metadata to understand:
- who’s using what
- which content is actually viewed
- where drop-offs happen
Query Metadata for ClickHouse
Section titled “Query Metadata for ClickHouse”Astrato automatically adds metadata to ClickHouse queries, enabling:
-
product analytics (who uses what)
-
performance analytics (how fast, how heavy)
-
full traceability (query → workbook → object → user)
All available directly from your warehouse, no extra tracking needed.
/articles/performance-and-usage-telemetry-store-astrato-activity-in-clickhouse
4.3.17 - 18 March 2026
Section titled “4.3.17 - 18 March 2026”Table - Conditional formatting → apply to selected columns
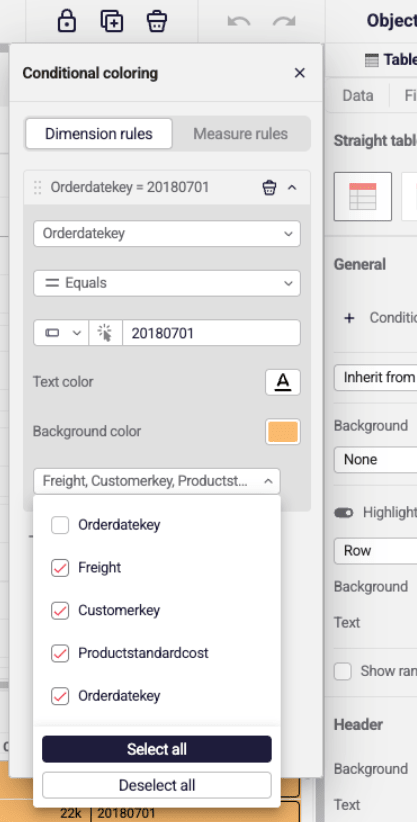
Section titled “Table - Conditional formatting → apply to selected columns”You can now apply formatting based on one column, but style only specific columns. Supports both dimension and measure rules (including gradients).
Adds a multi-select “Apply to columns” with select/deselect options. Extends table, expandable table, and pivot use cases without layout workarounds.
Default = all columns; only selected columns get styled (no full-row override).
Pivot Table - Custom export limits
Section titled “Pivot Table - Custom export limits”Allows custom limits on pivot export columns. This sets the number of horizontal values (columns appear in exports).
ℹ️ Min allowed value 20, max 1,000.
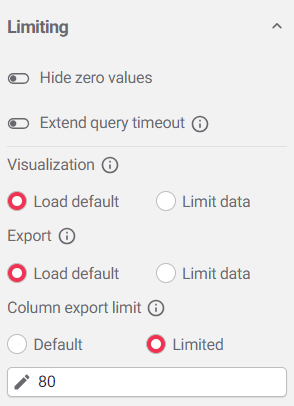
Table - Copy cell value from context menu
Section titled “Table - Copy cell value from context menu”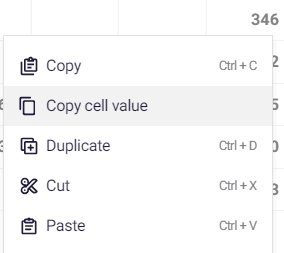
Other updates
Section titled “Other updates”Support dynamic formatting in measures & dimensions via variables
Measure & dimension formatting can be dynamically set using variables.
This is particulary helpful when a field (i.e. value) contains multiple formats, such as a percentage, integer and decimal.
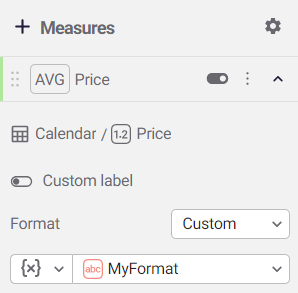
Hide Axis Scroll on Export/Printing
On charts with axis scrolling (bar/line/combo), we now hide the axis scroll in exported images/reports.
4.3.0 - 10 March 2026
Section titled “4.3.0 - 10 March 2026”Lobby - Additional Workbook Sorting Options & Saved state
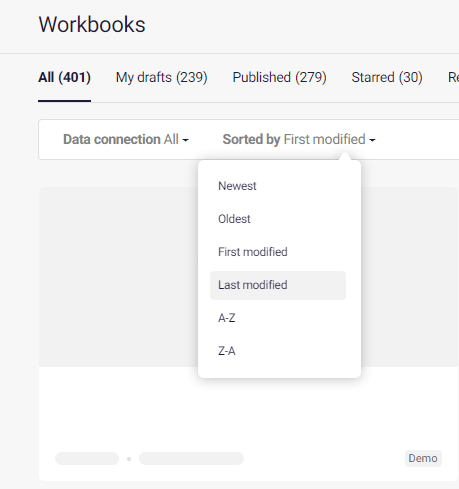
Section titled “Lobby - Additional Workbook Sorting Options & Saved state”Finding the right workbook is now faster. You can now sort the workbook list using multiple options: Newest, Oldest, First modified, Last modified, A–Z, Z–A.
This makes it easier to quickly locate recent work, track updates, or browse workbooks alphabetically.
Also, we’ll activate the sorting where you left off and even which tab you were using. If you were looking at the starred tab last, that’s what we’ll show you when you’re back.
Actions - Query Timeout Block
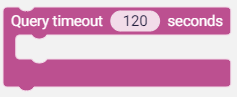
Section titled “Actions - Query Timeout Block”You can now control the timeout for SQL queries executed through Astrato.
The Query timeout parameter allows you to define how long queries can run (in seconds) before they are stopped. This timeout is applied to all nested HTTP requests triggered by the query execution.
-
Minimum value: 120 seconds
-
Maximum value: 600 seconds
If a value outside this range is provided, Astrato automatically uses the nearest valid value.
This setting is supported in Embeds and Reporting, helping prevent long-running queries from impacting performance while giving teams flexibility for heavier workloads.
Actions - Static Filter Parameters for Actions
Section titled “Actions - Static Filter Parameters for Actions”Actions Fetch dimension (as list) and Aggregate now support static filter parameters defined in the Semantic Layer.
When a table with filter parameters is used in these actions, the parameters appear automatically with their default values and can be overridden in the action inputs. On execution, Astrato extends the generated query with the defined parameter values.
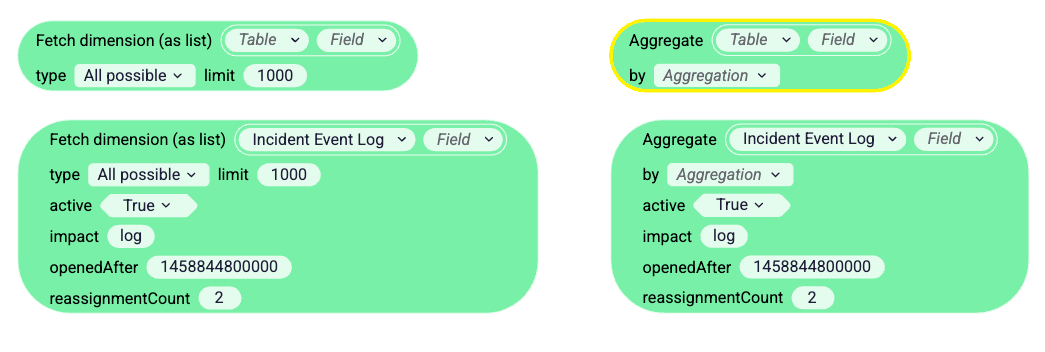
Notes
-
Existing actions are not deprecated.
-
Parameters do not work with dynamic field references (e.g. via Get Variable).
This helps teams apply controlled filters without exposing direct SQL access to the database.
4.2.0 - 02 March 2026
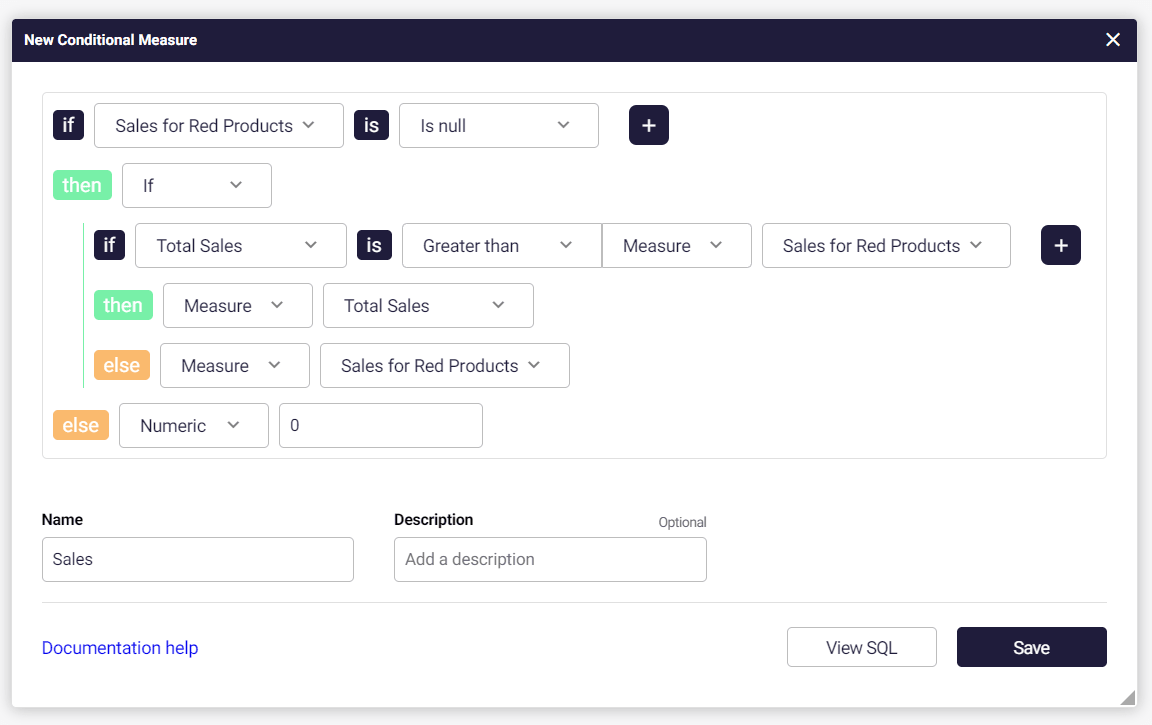
Section titled “4.2.0 - 02 March 2026”Semantic Layer | Nested Conditional Measures
Section titled “Semantic Layer | Nested Conditional Measures”We’ve leveled up our conditional measure builder. You can now create Nested Conditional Measures, allowing for more sophisticated logic by embedding “If” statements within your conditions.
Advanced Logic: Handle complex scenarios by nesting multiple layers of conditions.
Dynamic Fallbacks: Set specific secondary checks if your primary condition isn’t met.
Cleaner Workflows: Build intricate measures in a single window without needing to create separate fields.
Trigger Astrato Reprting Workflows Manually
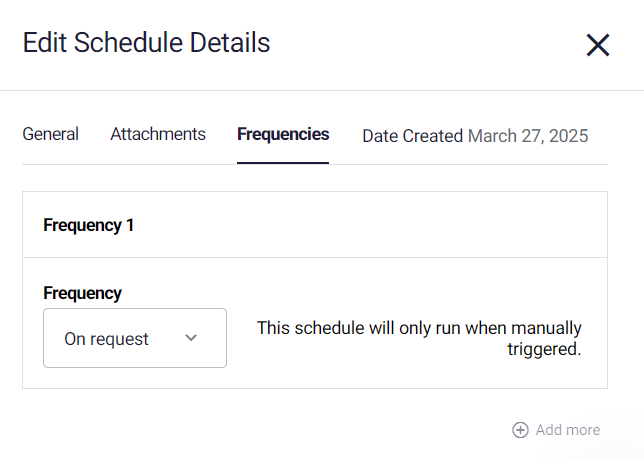
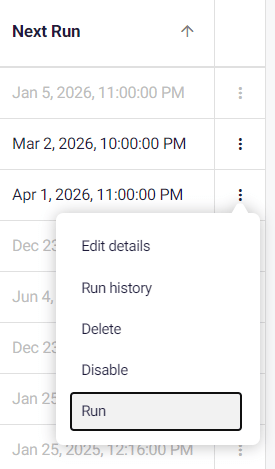
Section titled “Trigger Astrato Reprting Workflows Manually”We’ve introduced Manual/API Triggers for scheduled reports, allowing you to move beyond fixed time intervals and integrate report generation directly into your external workflows and CI/CD pipelines.
On-Demand Scheduling: A new “On Request” frequency option keeps.
REST API Integration (Private Preview): Trigger report execution using a simple POST request to the designated endpoint. Support for Personal Access Tokens (PAT) to ensure secure, scriptable access.
 |  |
4.1.0 - 19 February 2026
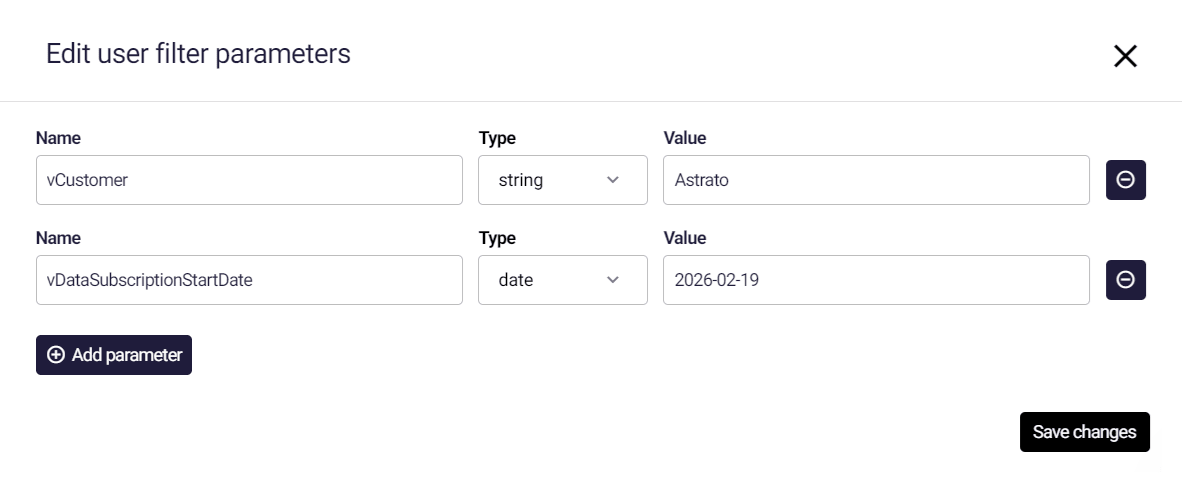
Section titled “4.1.0 - 19 February 2026”Global Parameters | User Attributes
Section titled “Global Parameters | User Attributes”Admins can now assign and persist Global Parameters directly on user profiles from the admin portal, removing the need to manage them via actions or API.
Not only is UI editing supported, but also bulk upload via CSV/XLSX.
Use cases:
• Pre-filter data per user (e.g. region, team, customer)
• Personalised row-level access for embedded and internal analytics without reliance on database user/role linking
• Default dashboard settings or layout per user
• Auto-scoped operational dashboards (e.g. a manager only sees their stores on open)
• Feature flags to control beta access or workbook variants by user
• Sales and customer success views preloaded with their own account portfolio
Versioning | Outdated Draft Detection
Section titled “Versioning | Outdated Draft Detection”Warns when editing an outdated draft by comparing draft and published timestamps, preventing accidental overwrites of newer changes.
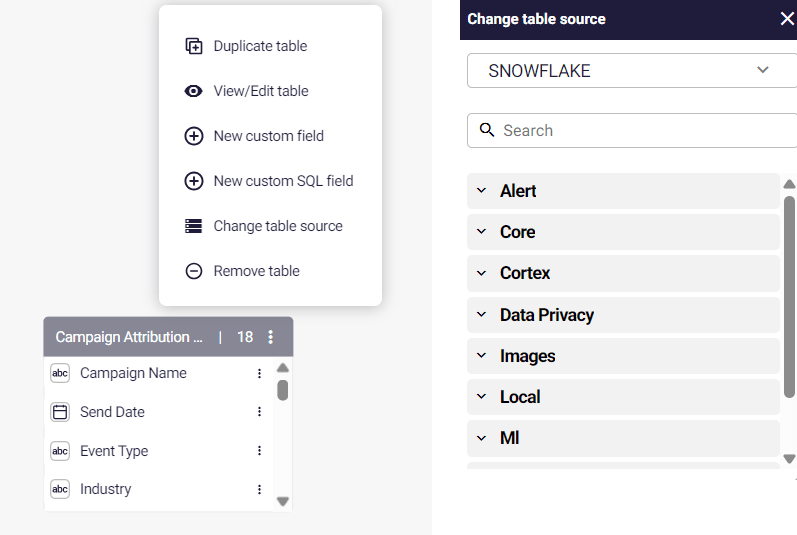
Semantic Layer - Change table source & database
Section titled “Semantic Layer - Change table source & database”Need to swap a table from dev DB to prod DB? We added the option to change the database, to our existing change table source option in the semantic layer.
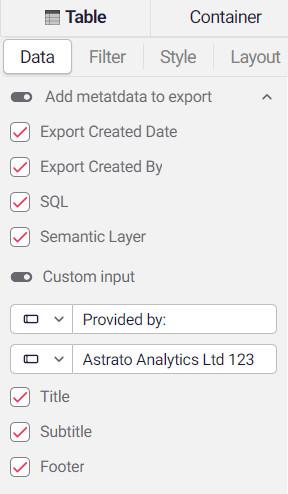
Data Exports - Add Custom metadata to data export files
Section titled “Data Exports - Add Custom metadata to data export files”Exports can provide additional information to help users understand the origin of the export, from workbook name, down to the object and even the entire query. What is included in the export is optional.
For XLSX files, the metadata is added to a separate sheet. For CSV export files, the metadata is added to a separate CSV, which is downloaded as a zip, containgn a data file and a metadata file.
Options available:
|  |
Use cases
-
Legal notices → in the event you require a copyright / disclaimer / fair use notice, you can add that here. You can pull a value from a database in case you want to retrieve a shared value.
-
Link to dashboard → guide users back to where they exported the data.
-
Tokenized exports → track exports back to specific requests/instructions from Astrato.
-
Audit & governance → use the export to track who exported what charts, when, and on which semantic layer for compliance and support.
-
Faster debugging → copy the exact SQL behind a chart to validate logic, test performance, or reproduce queries in the data warehouse.
-
Personalisation at scale → use Custom Input key/value pairs to pass information of your choosing into export metadata, such as IDs, tokens, locale, or scenario configuration.
4.0.0 - 11 February 2026
Section titled “4.0.0 - 11 February 2026”Always one selected fields
Section titled “Always one selected fields”This feature lets you lock important filters so they always have exactly one value selected. It prevents reports from ever falling into an “unfiltered” or “multi-select” state.
Use it to lock dashboards to one required context; like a customer, region, product, project, or tenant - so that reports never run unfiltered and users always stay within a clear, safe scope.
As shown when enabled  | How to enable 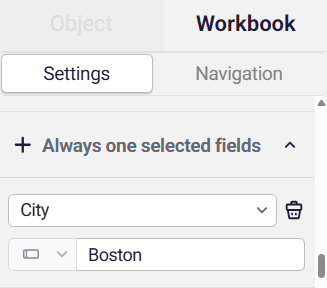 |
Locked Filters
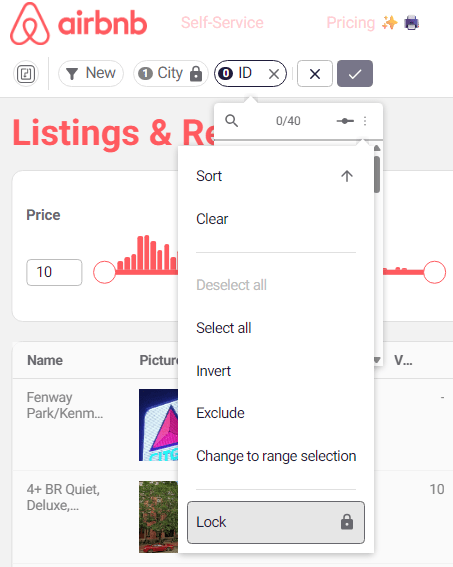
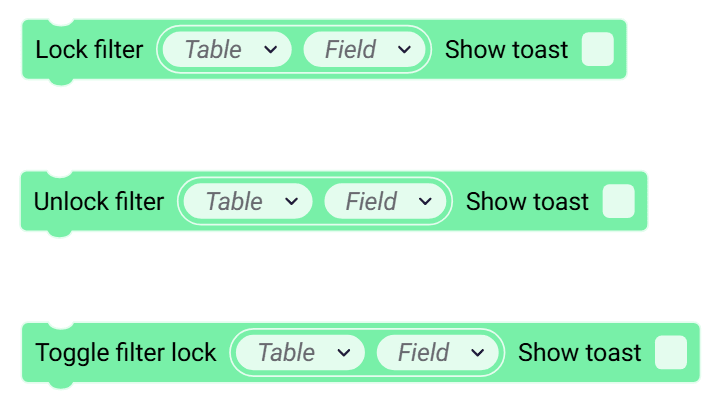
Section titled “Locked Filters”Locked Filters let you fix important filters in place so viewers can explore data safely without changing key context. You can use lcoked filters to Hide Sensitive Data, Create/Template Guided Dashboards and to Support Confident Self-Serve Analytics.
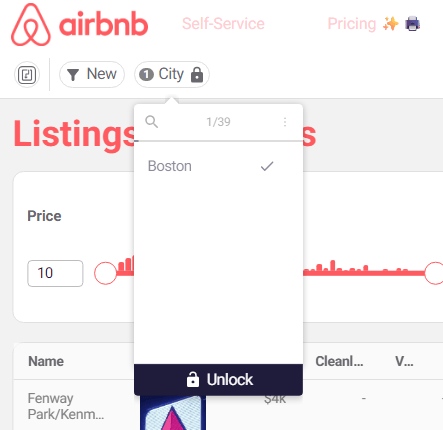
Manual locking | Action-based locking |
 |  |
Reporting - Send reports using Alerts [Private Preview]
Section titled “Reporting - Send reports using Alerts [Private Preview]”You can now send reports directly as part of an Alert workflow.
This update expands what action blocks are allowed inside an Alert Definition, while still protecting the system from loops. Alerts can be scheduled on our reporting page.
The following actions are now valid inside Alert definitions:
-
Send notification
-
Send report
-
Send Excel report
-
Send PowerPoint report
This means alerts can now trigger full report deliveries when conditions are met.
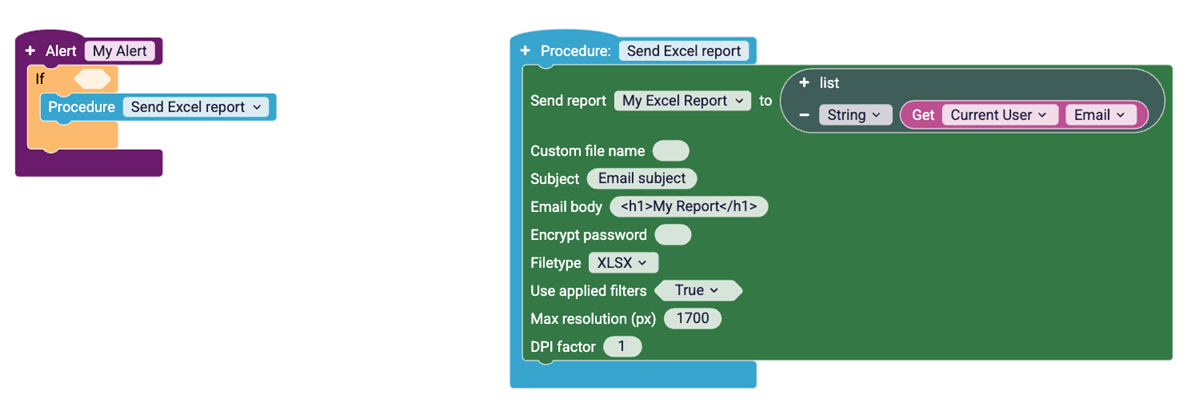
ℹ️ These actions cannot be used within an Alert definition:
Open report
Open Excel report
Evaluate Alert
Export object / group / sheet
Result filters - filter object
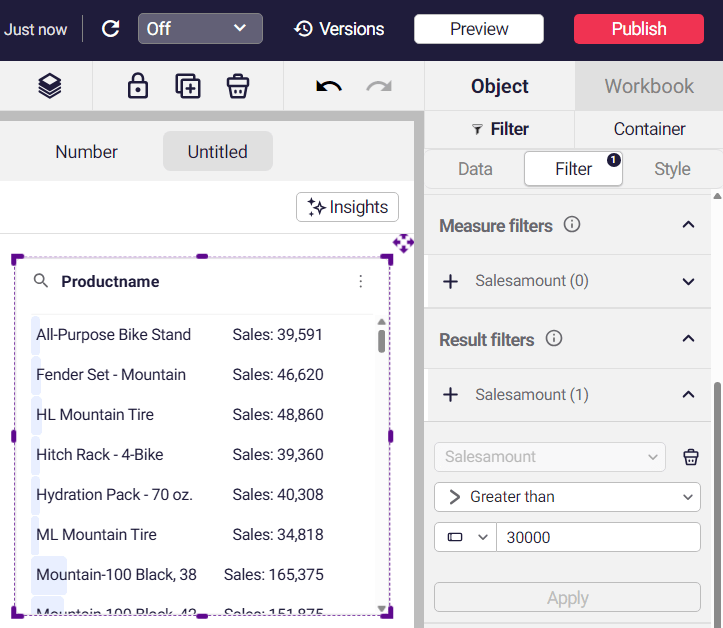
Section titled “Result filters - filter object”You can now utilize result filter in the filter object, only presenting filter values that are above/below a given measure threshold.
Versioning updates
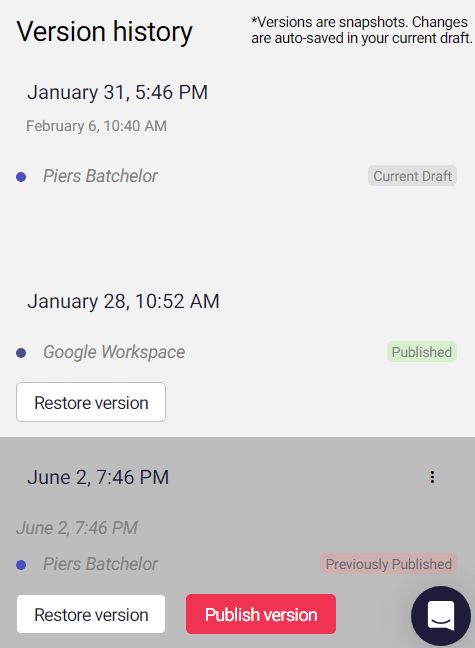
Section titled “Versioning updates”We've renamed some parts of versioning to make versions easier to manage.
|  |
Customizable Loading Text for Embeds
Section titled “Customizable Loading Text for Embeds”You can now change the loading message shown in embedded dashboards. Previously, every embed displayed the fixed text “Thinking…” while data loaded. With this update, you can set your own text using a simple query parameter on the embed URL. | Example  |
Unbranded login page for customer-facing analytics
Section titled “Unbranded login page for customer-facing analytics”If you have customer facing analytics, you can use an unbranded login page for your customers. Simply have customers login using the link below, and they’ll return to this page automatically if they need to login again. Please note to access this page the URL parameter hideInfo=true is required.
https://app.astrato.io/auth-login/sign-in?hideInfo=true
https://app.astrato.io/auth-login/sign-up?hideInfo=true
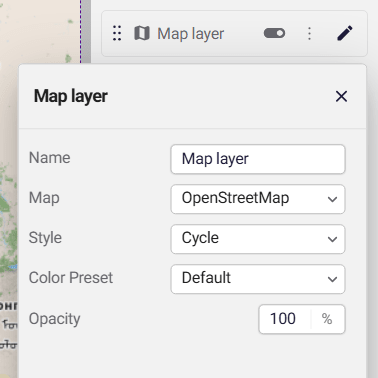
Maps: New Styles 🎨
Section titled “Maps: New Styles 🎨”Customise your maps with NEW map styles, and color presets for each layer, now supporting **dark-mode** maps.
Default | Greyscale | Black | Dark mode |
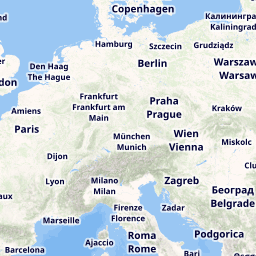 | 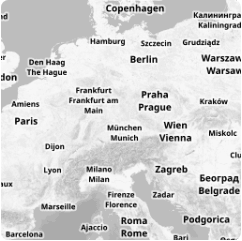 | 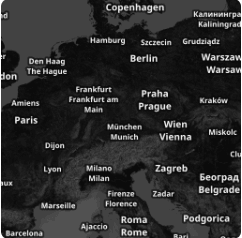 |  |
Default 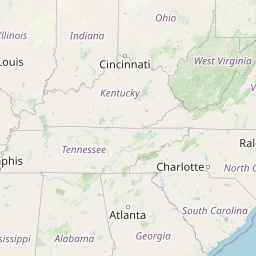 | Humanitarian 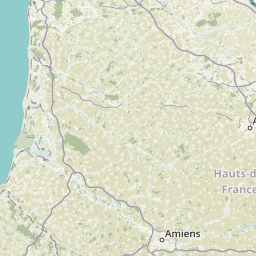 | Cycle 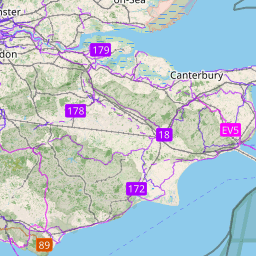 |
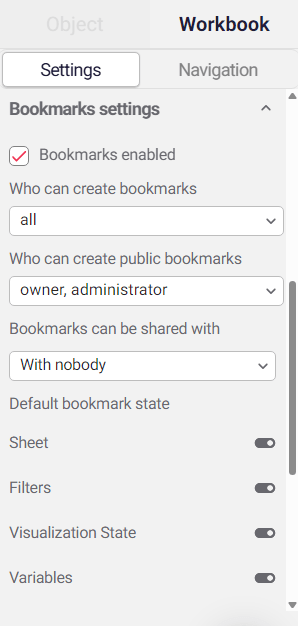
Bookmarks: Set default settings for bookmarks
Section titled “Bookmarks: Set default settings for bookmarks”When users creates a new bookmark, the default setting for the bookmarks will be alignd to the default you set in the workbook, as shown below. This is ideal if you want to exclude sheet navigation, filters, or variables from a filter, across the workbook.
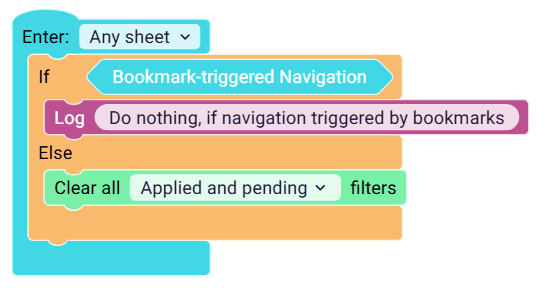
Bookmarks: New actions to identify sheet navigation
Section titled “Bookmarks: New actions to identify sheet navigation”When bookmarks navigate users to a sheet, they also trigger filters related to sheet navigation. This can be prevented by using the action block Bookark-triggered Navigation. Below we decide to take no action (in this case, log a message) when the bookmark take the user to a new sheet. If the navigation was not caused by bookmarks, we clear all filters.
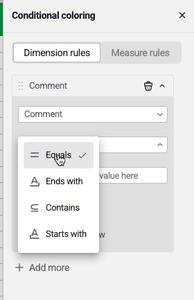
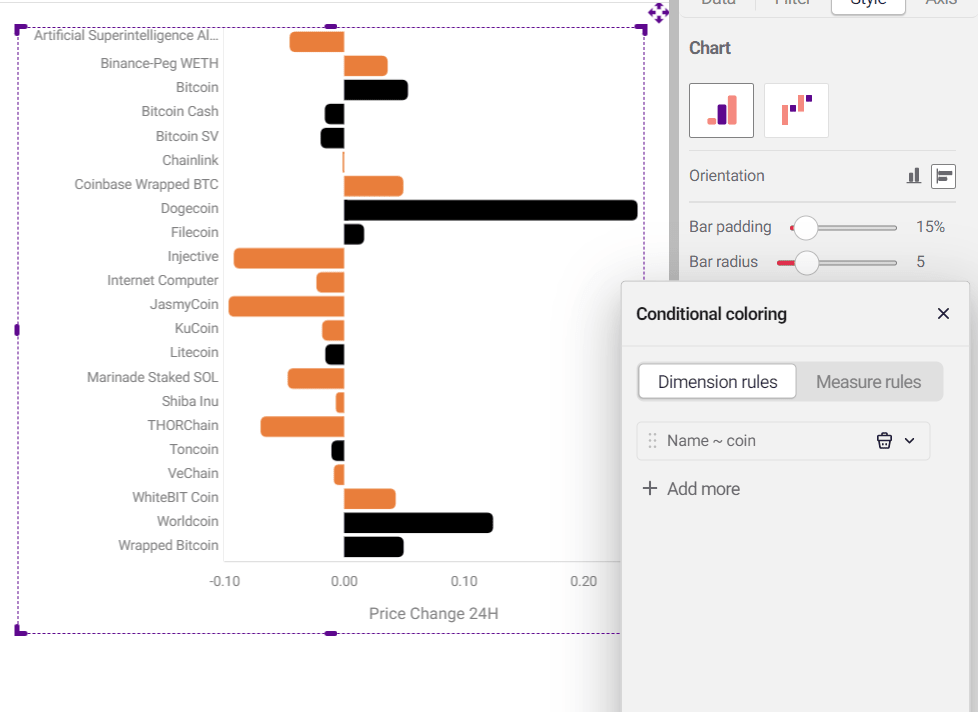
Conditional Coloring: Variable Support & string matching
Section titled “Conditional Coloring: Variable Support & string matching”Conditional coloring now supports Astrato variables and flexible string matching. You can dynamically control formatting based on runtime selections and match text using common operators.
 |  |
3.30.9 - 29 January 2026
Section titled “3.30.9 - 29 January 2026”🆕 MotherDuck data connection: Public Preview 🦆
Section titled “🆕 MotherDuck data connection: Public Preview 🦆”DuckDB in the Cloud! Astrato is rolling out support for MotherDuck. Simply add your PAT token and get connected.
3.30 - 27 January 2026
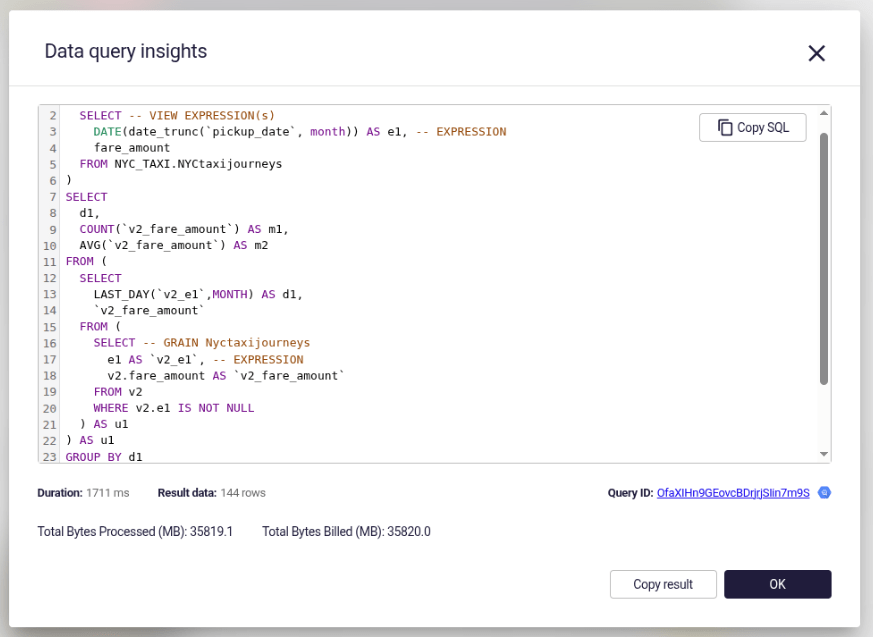
Section titled “3.30 - 27 January 2026”Google BigQuery - Display query metadata
Section titled “Google BigQuery - Display query metadata”Astrato now displays additional data in the data query insights section. The “Bytes Processed” can help provide some guidance on
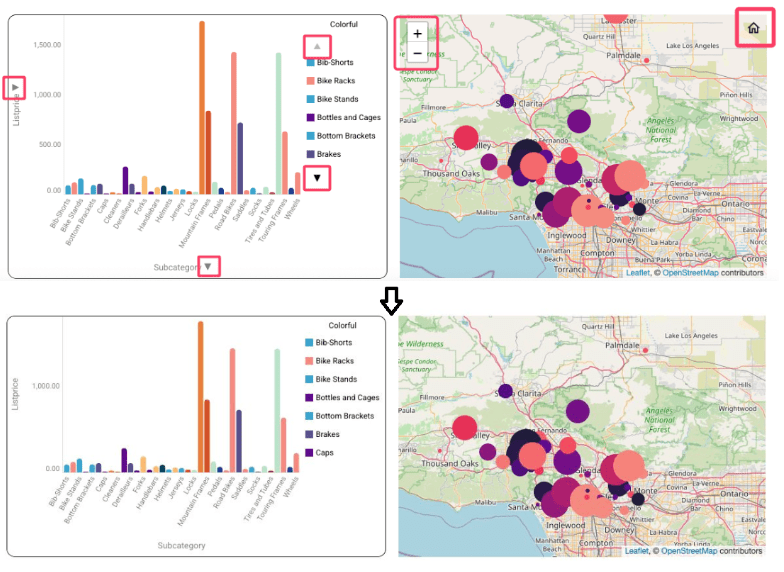
Interactive Icons removed from exports
Section titled “Interactive Icons removed from exports”Interactive elements are no longer included in image exports & PDF generations.
This results in a cleaner, more presentation-optimized reports & exports.
3.29 - 22 January 2026
Section titled “3.29 - 22 January 2026”Databricks OAuth Integration
Section titled “Databricks OAuth Integration”New way to connect to Databricks via OAuth integration; this method automatically enforces all security and data rules defined in Databricks on users’ access to data via Astrato.
The new integration simplifies the management of access to Databricks data for both developers and end users.
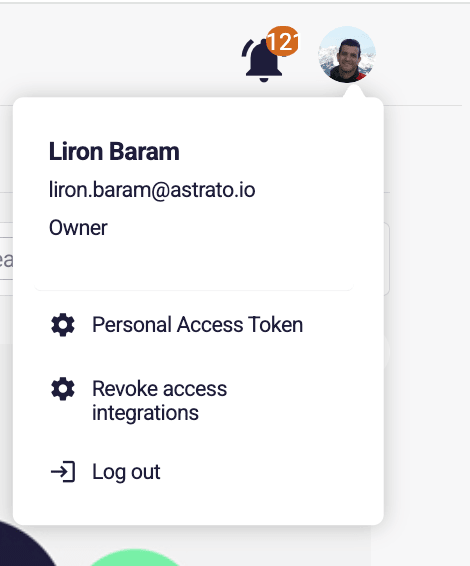
Revoke Access Token Individually
Section titled “Revoke Access Token Individually”Developers can revoke their own access tokens to impersonate other users’ access and ensure data security is implemented correctly.
Improved Scheduled Reports Scheduling Options
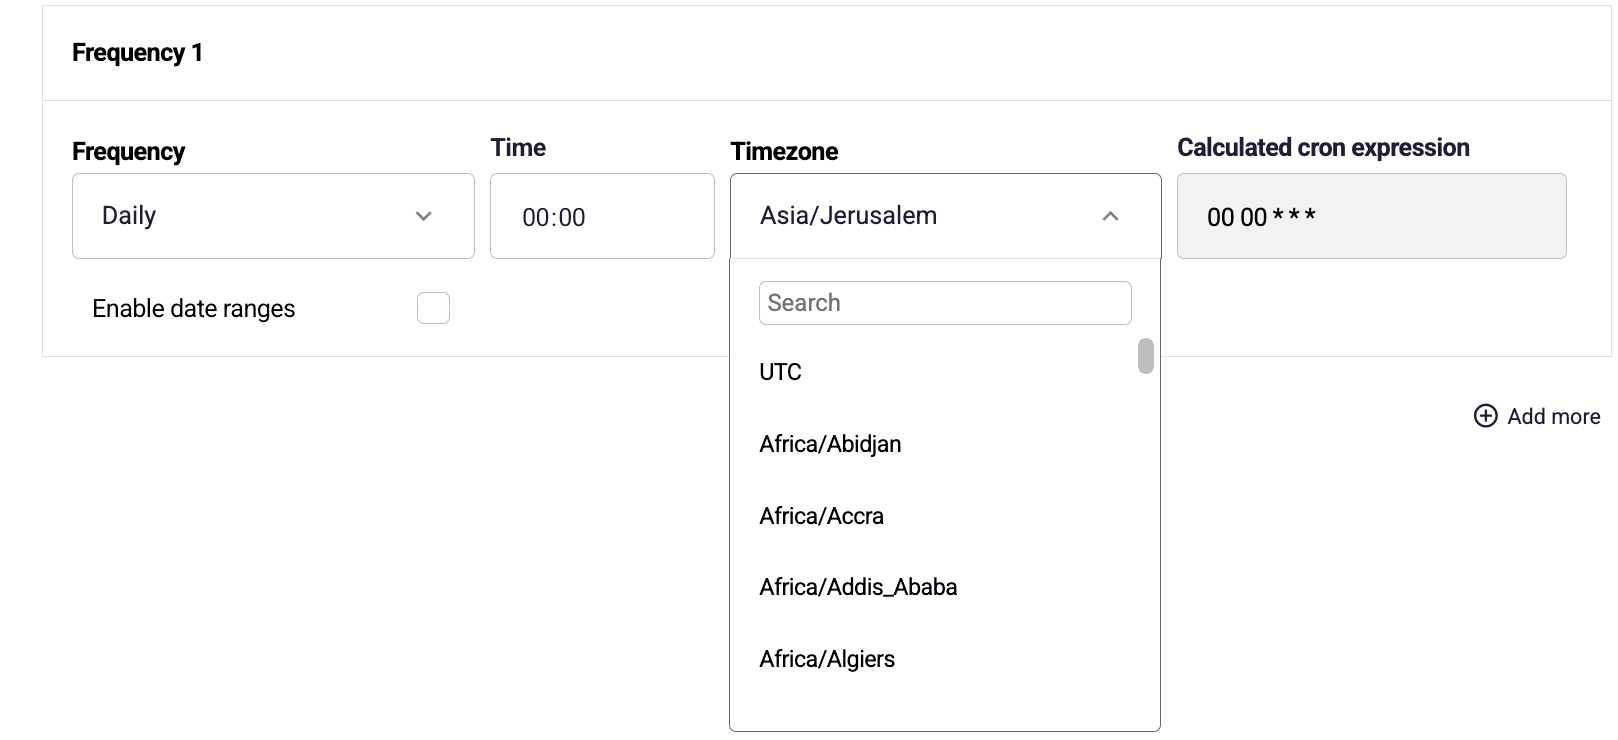
Section titled “Improved Scheduled Reports Scheduling Options”Distributing reports at the right time is essential for getting the most value from them and keeping them an important and reliable source of information.
To improve creators’ and users’ options, a new set of scheduling options is now available for reports.
-
Support Daylight Saving Time for Report Schedules
-
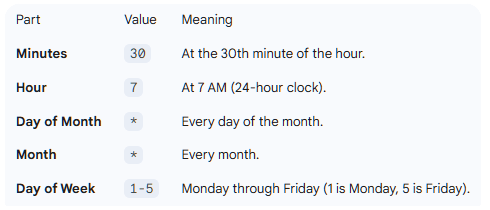
Setting custom date ranges, such as Monday-Friday using extended CRON expressions:
-
Support for range and multiple values expressions in CRON.
for example: 30 7 * * 1-5 -
-
Support for the last day of the month schedule.
-
Supabase- simple data connection creation (private preview)
Section titled “Supabase- simple data connection creation (private preview)”Creating a data connection to Supabase is now as simple as pasting the connection URL from Supabase.
Pivot Table Dimension Classic Display
Section titled “Pivot Table Dimension Classic Display”A pivot table is one of the more powerful tools in self-service; it allows users to view data from different angles and at different granularities. The new display options show a more classic view of the row dimensions in the table, making it easier to read the insights.
Indented Pivot (default) | Classic Pivot |
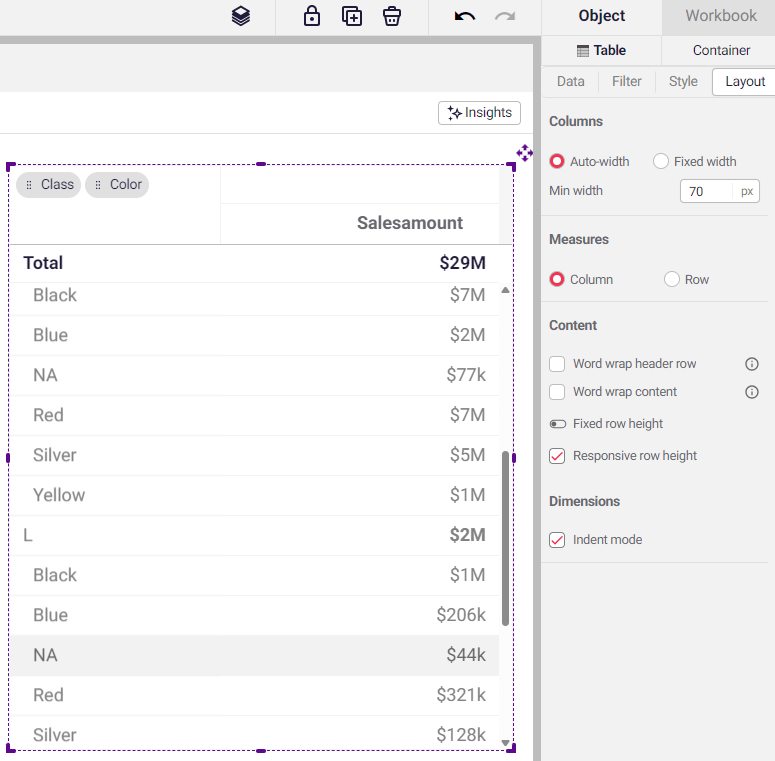 | 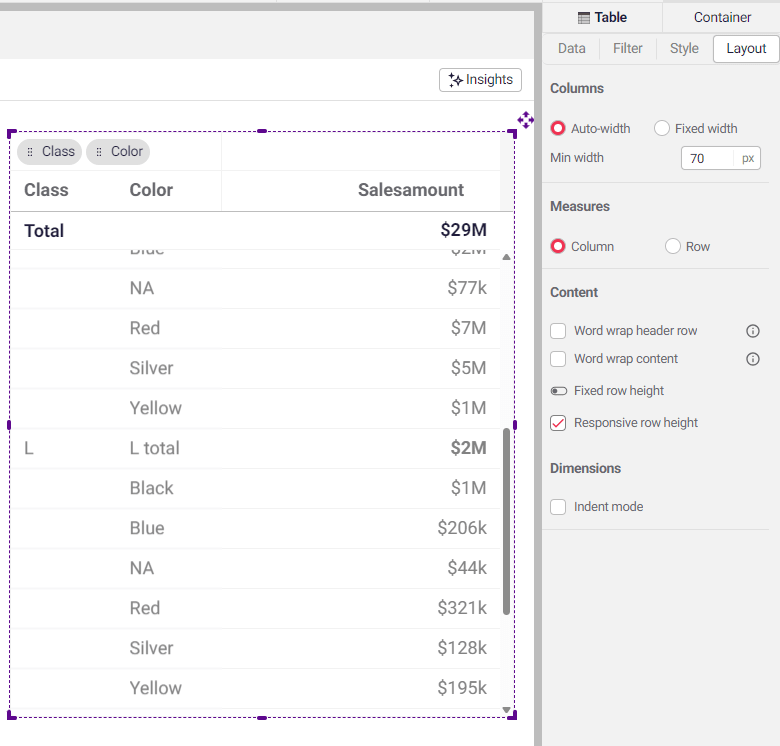 |
Table - Calculated Conditional Column
Section titled “Table - Calculated Conditional Column”A new type of measure that can evaluate conditions per row in a table, combining multiple regular or advanced measures. This new measure enabled a range of insights to be generated from the on-the-fly-aggregated data in the table.
Chart Sorting by Top N Ranking
Section titled “Chart Sorting by Top N Ranking”The top N display in the chart helps users focus on the most important entities, making the chart clearer and easier to read. When applying the Top N filter on a chart that includes multiple dimensions, there is a new option to sort the chart by the rank results used in the filter.
3.28 - 12 January 2026
Section titled “3.28 - 12 January 2026”Actions: New “Get created scope” and “On Scope Created” blocks
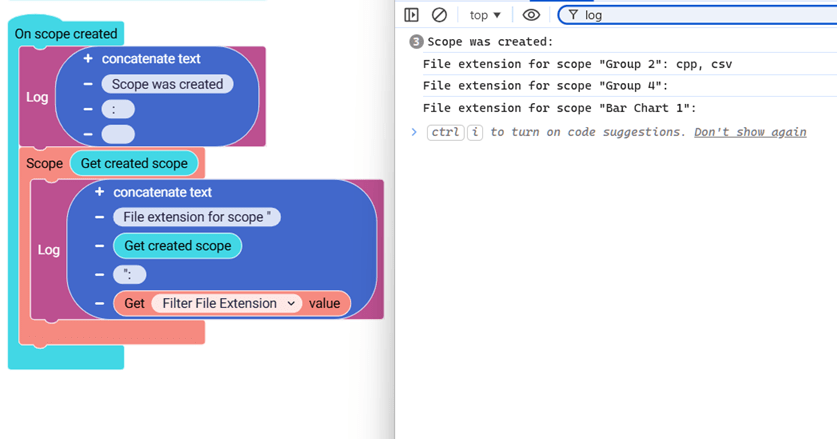
Section titled “Actions: New “Get created scope” and “On Scope Created” blocks”On scope created trigger, runs each time a variable scope is initialised, which means the default value of that variable scope can be declared.
This runs for each and every scope; a loop through scopes is not required. Get the created scope and share the scope’s name.
Using a variable within the created scope returns values set within that scope.
Use cases:
-
Retrieve values created within each scope
-
Retrieve default scope variable values via actions
3.26 - 23 December 2025
Section titled “3.26 - 23 December 2025”🆕 Data connection - Supabase (private preview)
Section titled “🆕 Data connection - Supabase (private preview)”
Supabase is a cost-effective, Postgres-based platform and a popular choice among modern product and AI-driven companies. It is also used as the default database by platforms such as Lovable, making it a strong alternative to larger cloud warehouses like Databricks and Snowflake for many use cases.
With the Supabase connector, you can:
-
Analyze Supabase data in real time using Astrato’s live-query engine
-
Build dashboards, reports, and actions on top of Supabase data without data replication
-
Use Supabase for analytics, operational reporting, and embedded use cases
This addition expands Astrato’s support for modern, developer-friendly data stacks while maintaining the same enterprise-grade analytics and action capabilities.
If you’d like to join the private preview, please contact our support team.
🆕 Semantic Layer - Connect to multiple databases in Snowflake ❄️
Section titled “🆕 Semantic Layer - Connect to multiple databases in Snowflake ❄️”Working with data across multiple databases is now simpler and more performant.
You can now select tables and views from any database or catalog you have access to when creating semantic views, without relying on custom SQL. A new database selector has been added to the Select step, allowing you to choose a database and browse its schemas directly.
🆕 Semantic Layer - Allow disabling associative filters
Section titled “🆕 Semantic Layer - Allow disabling associative filters”You now have explicit control over associative filters in multi-fact semantic models.
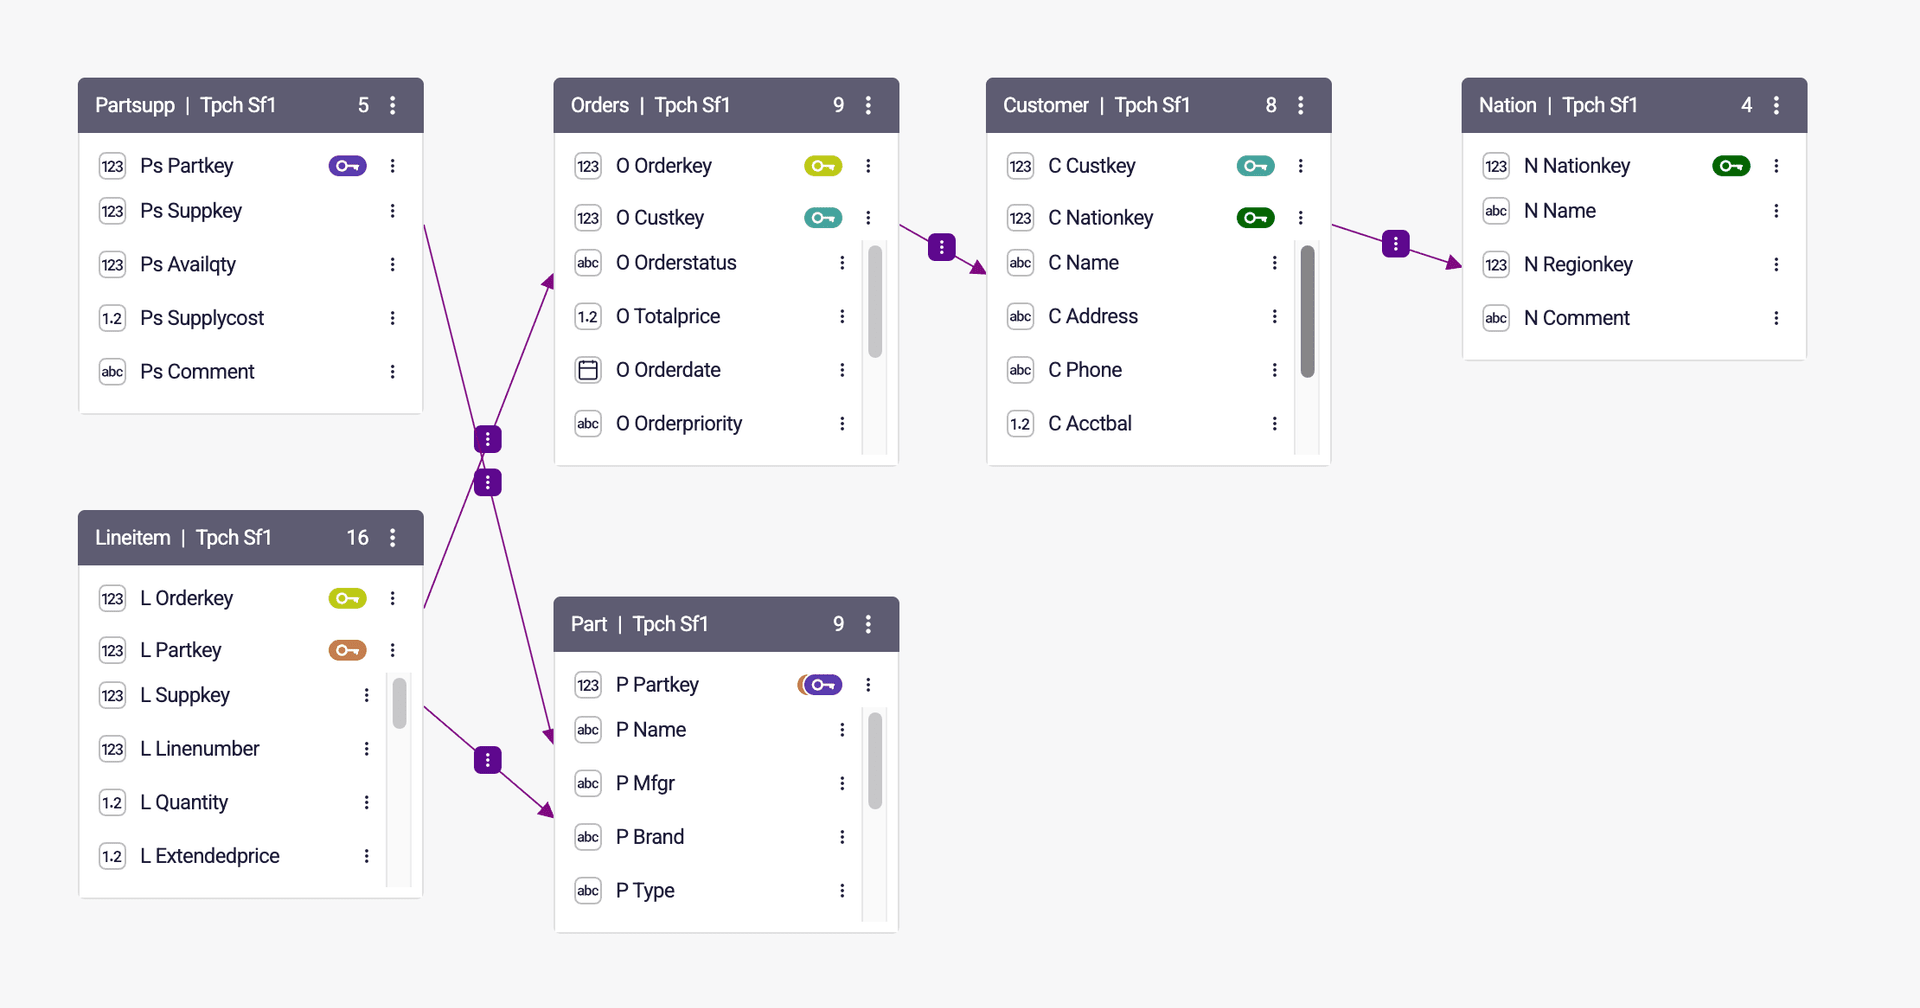
Previously, when filtering on a dimension connected to only one fact table, Astrato automatically propagated the filter across other facts via associative joins. You can now disable this behavior at the semantic layer settings, ensuring filters only apply where they are logically intended.
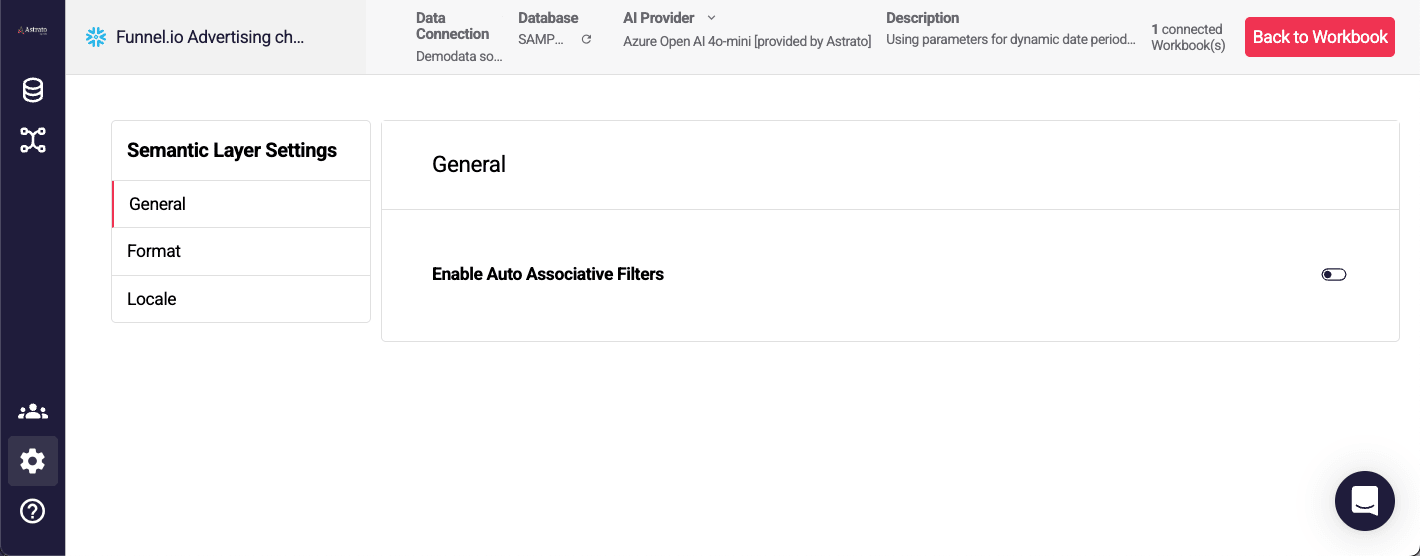
This gives you:
-
More predictable query behavior in complex, multi-fact schemas
-
Better control over how dimensions filter individual fact tables
-
Improved accuracy when combining measures from different grains
This enhancement makes it easier to model advanced data scenarios without unintended cross-fact filtering.
🆕 Actions - Send email block
Section titled “🆕 Actions - Send email block”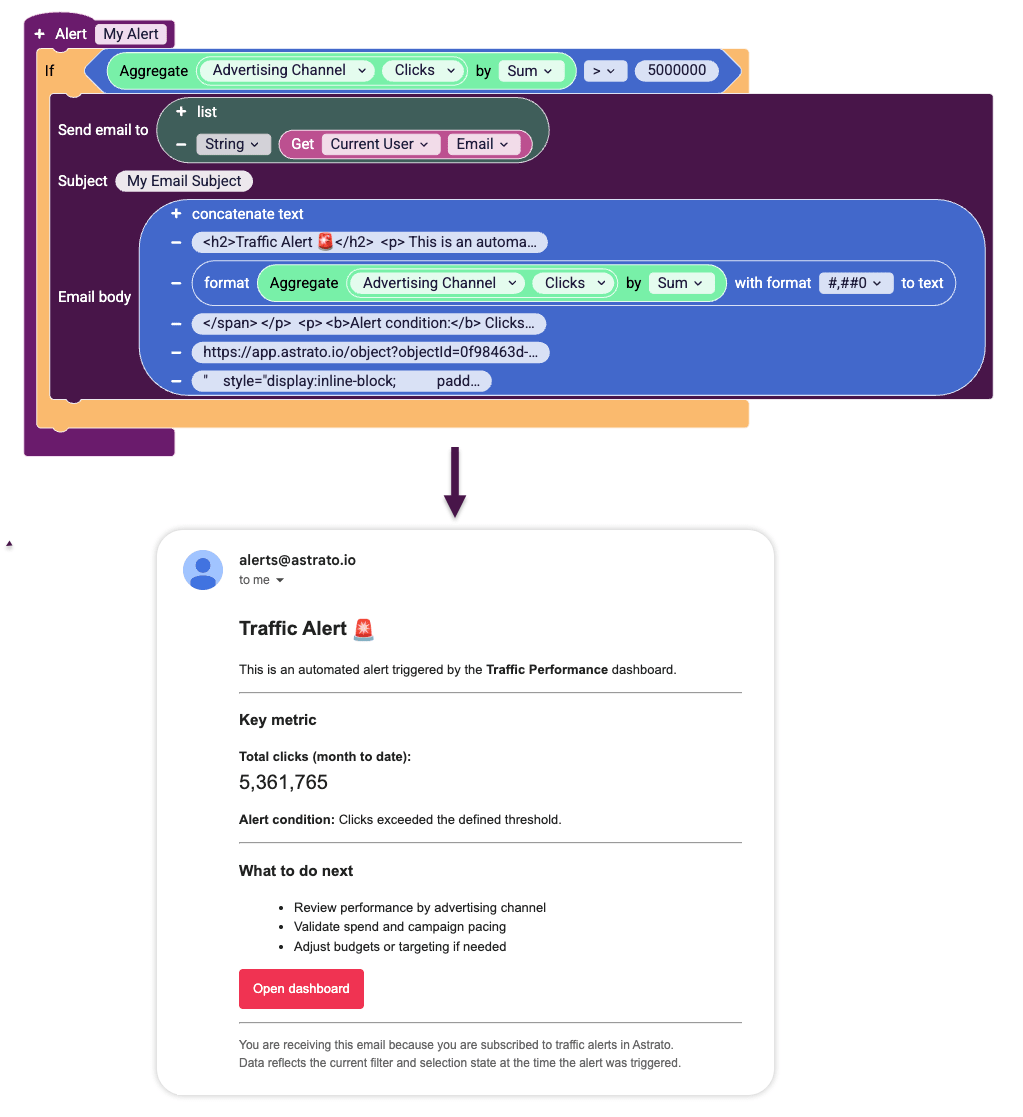
Astrato now supports a Send Email action block with dynamic, data-driven content.
Emails can include aggregated metrics, user context, and formatted text, and are evaluated at execution time to always reflect the latest data and filters.
Common use cases
-
Alerts & notifications
Send threshold-based alerts or event-driven notifications when metrics change or conditions are met.
-
Operational workflows
Trigger emails as part of approval flows, writeback processes, or exception handling.
-
Questionnaires & follow-ups
Send contextual emails that include live data points as part of surveys or feedback workflows.
This action block makes it possible to turn dashboards into active, data-driven communication tools, rather than static views.
🆕 Master object - Navigate to master object
Section titled “🆕 Master object - Navigate to master object”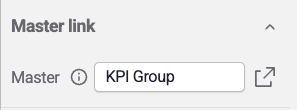
Managing linked objects is now faster and more intuitive.
Linked objects include a Go to Master button in the Master Link section of the container property panel, allowing you to instantly navigate to the master object’s sheet, select it, and open its property panel. Any changes made to the master are automatically reflected across all linked objects.
3.25 - 15 December 2025
Section titled “3.25 - 15 December 2025”🆕 Parameterized Views (private preview for OEM users)
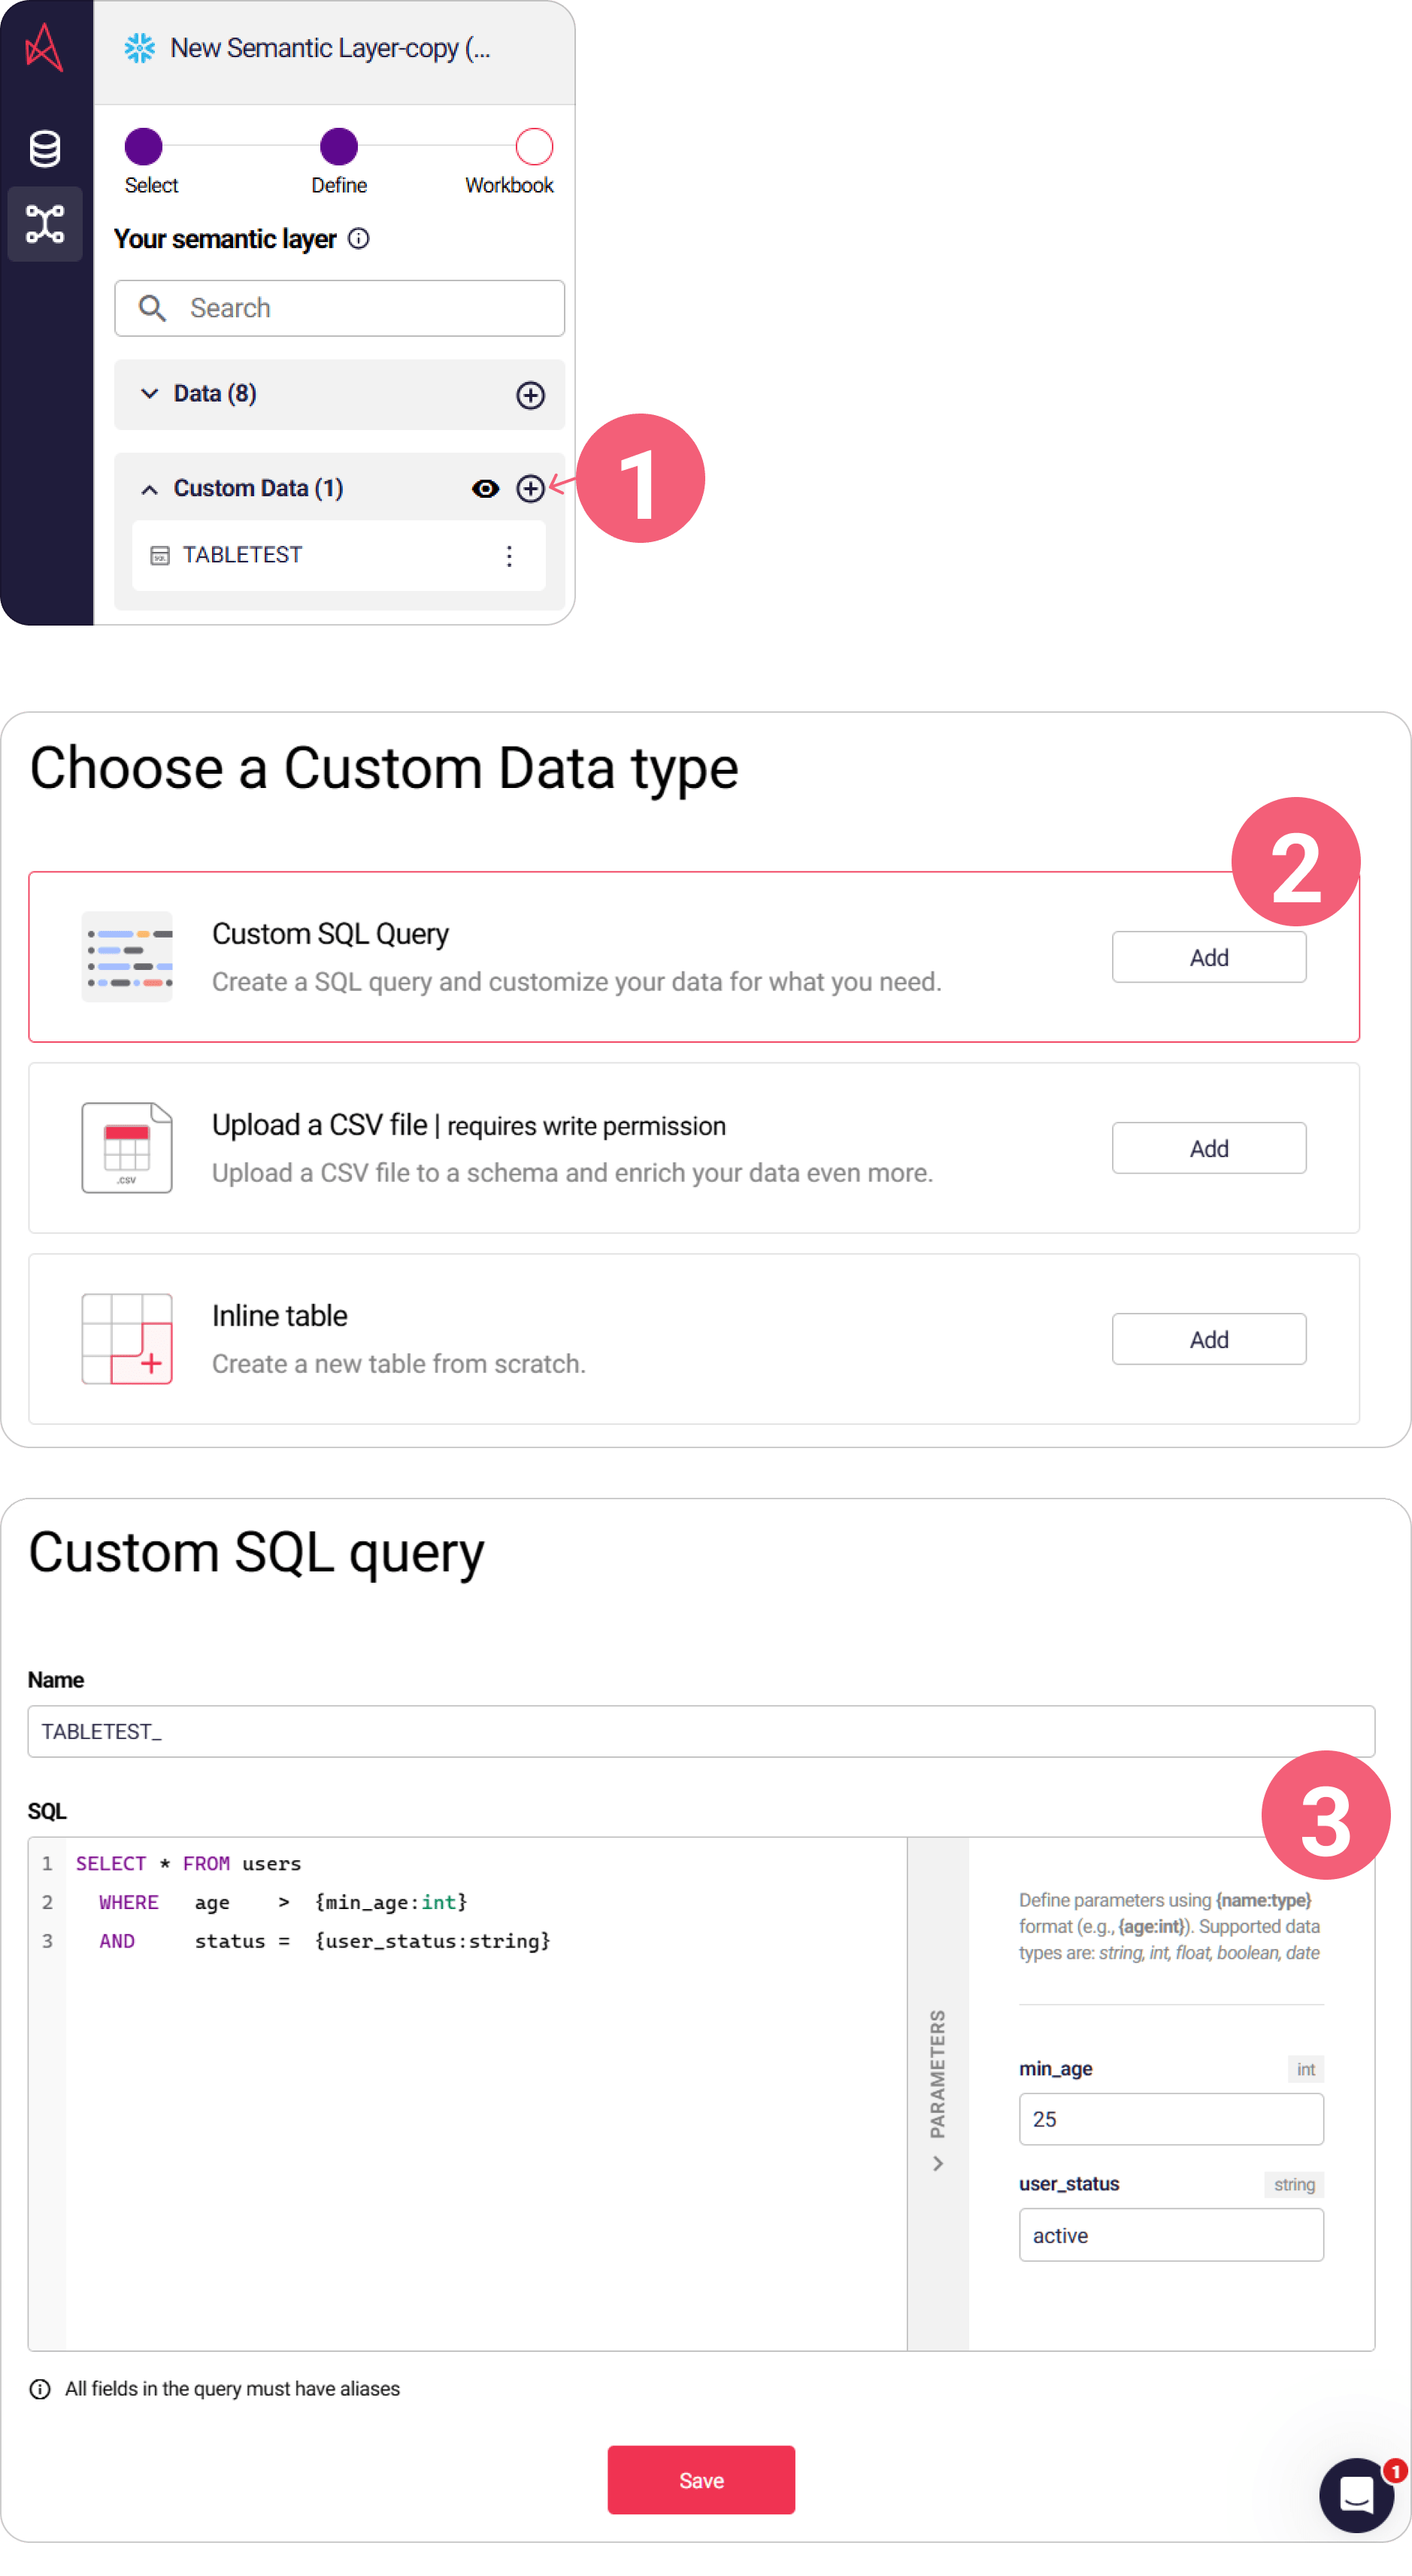
Section titled “🆕 Parameterized Views (private preview for OEM users)”We’ve added clean, flexible support for parameterized views so you can build dynamic, user-driven queries without rewriting SQL each time.
What it does
You can now define custom SQL statements with parameters inside your view. When the view runs, Astrato swaps in the actual values — from users, variables, controls, or defaults — to generate the final query.
How it works
-
Supported for Custom SQL views (sourceType: “statement”).
-
Declare parameters inline using {name:type} — e.g. {store_id:int}, {from_date:date}.
-
Types include string, int, float, boolean, date, and more.
-
Astrato auto-parses all parameters and handles substitution at runtime.
Example
A view with source: SELECT * FROM users WHERE age > {min_age:int} AND status = {user_status:string}
Parameters:
-
min_age:
int -
user_status:
string
This allows one reusable view to power many scenarios — filters, what-if inputs, user-personalised data slices — all without duplicating SQL.
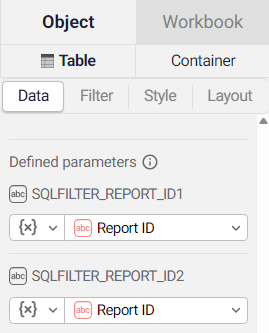
In each object, you can link a variable (or hardcode a value) to each parameter you have in use.
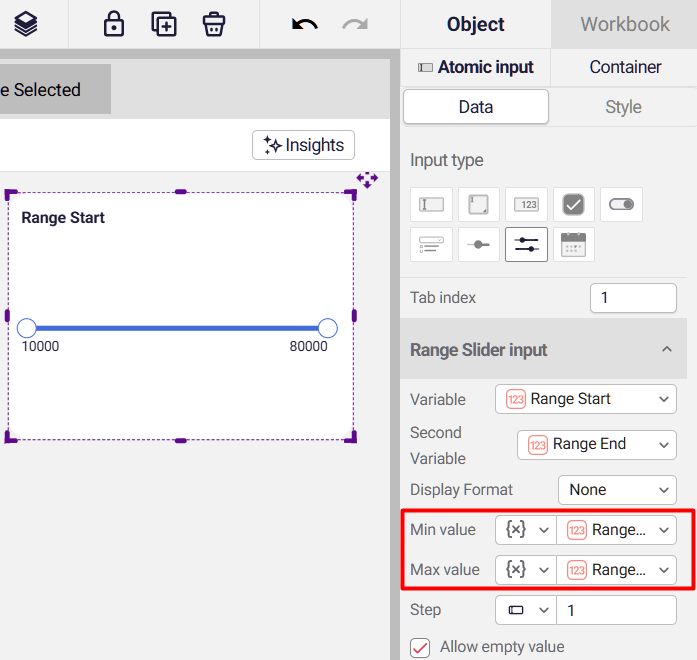
Variable input for slider atomic input
Section titled “Variable input for slider atomic input”Slider range can be updated via variables, to scale as your data changes.
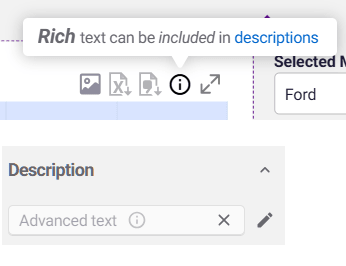
Advanced/Rich text in descriptions
Section titled “Advanced/Rich text in descriptions”Advanced stylized text (and variables) can now be included in object & group container descriptions.
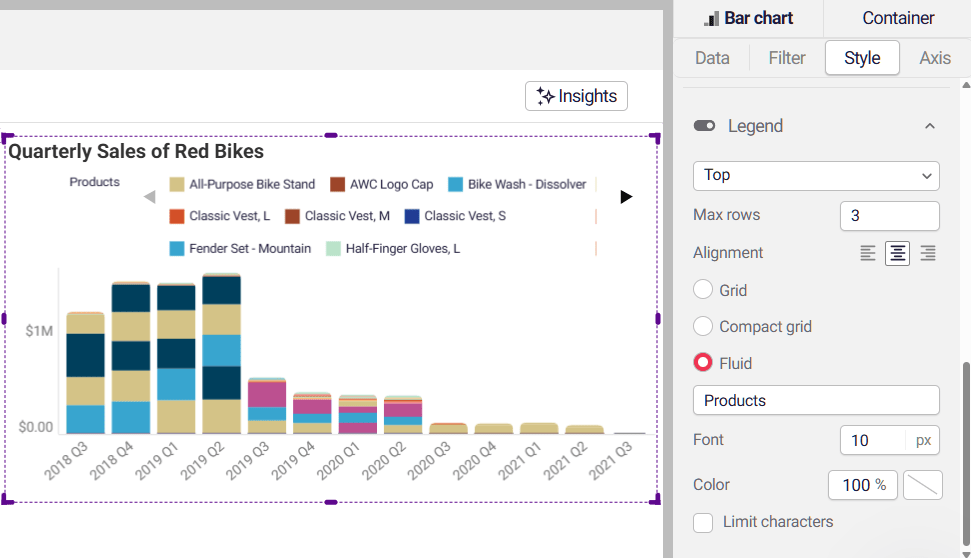
Legend spacing and alignment improvements
Section titled “Legend spacing and alignment improvements”The legend layout can now be updated to save space and increase the number of possible values shown, as well as have the alignment changed. Values can be seen closer together, with a reduced dependency on scrolling.
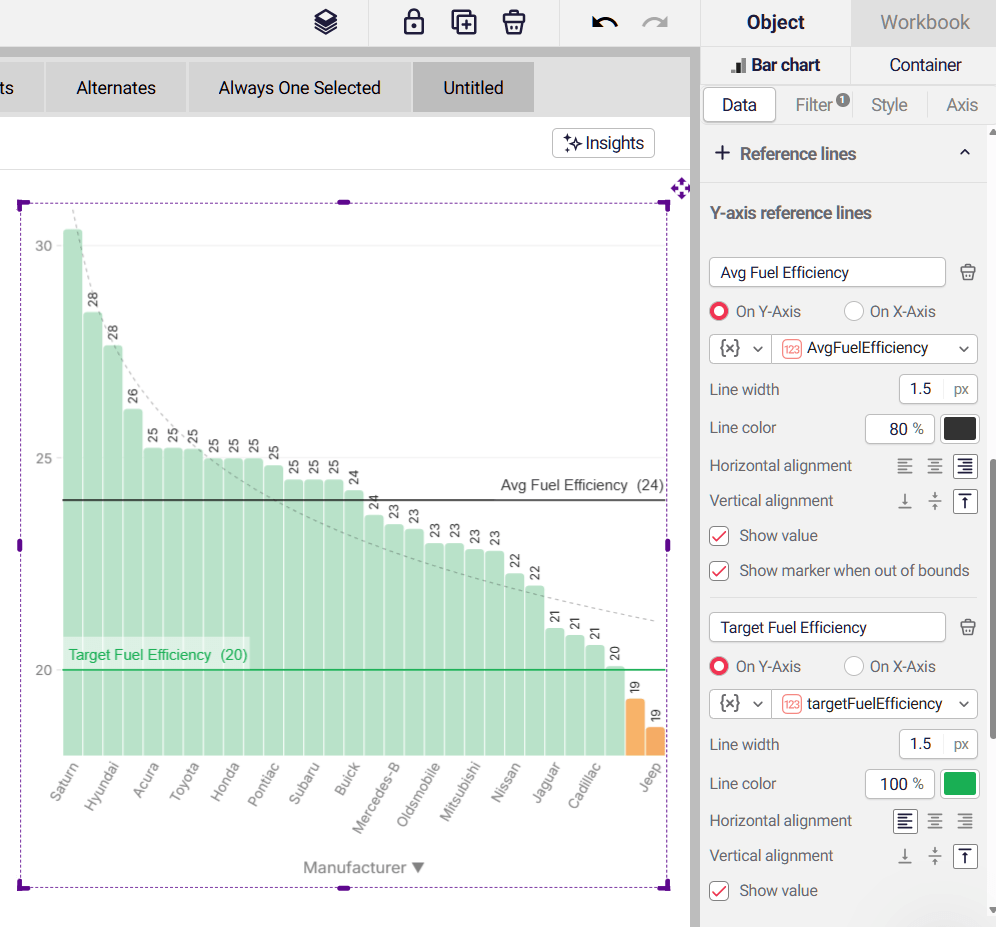
Label position for reference lines
Section titled “Label position for reference lines”The label position for the reference lines can be set to ensure optimal display of data and reference lines.
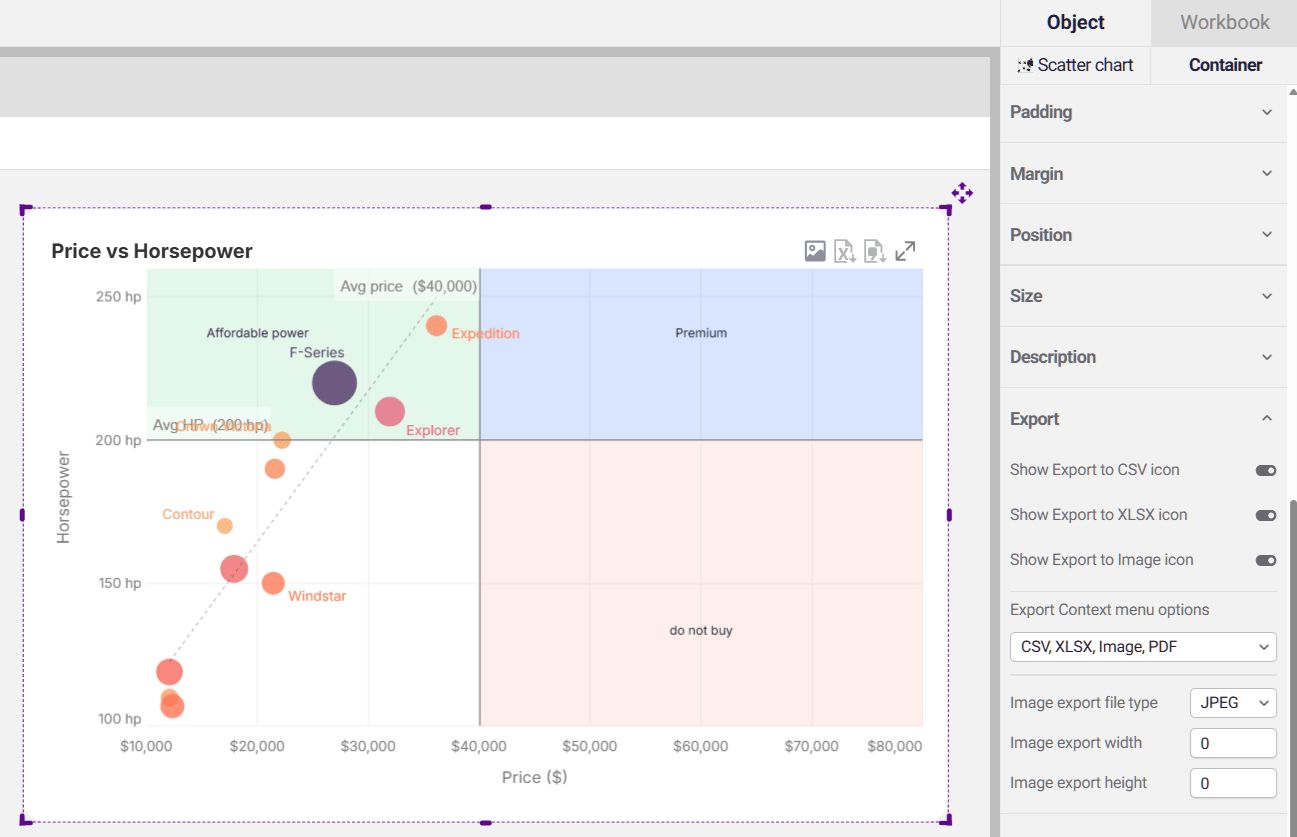
Control export options on object level
Section titled “Control export options on object level”Each chart can have independent export settings, where you can control the size and filetype of the export. If a size is not specified (or equal to 0/default/current), the current dimensions of the chart will be used in the export.
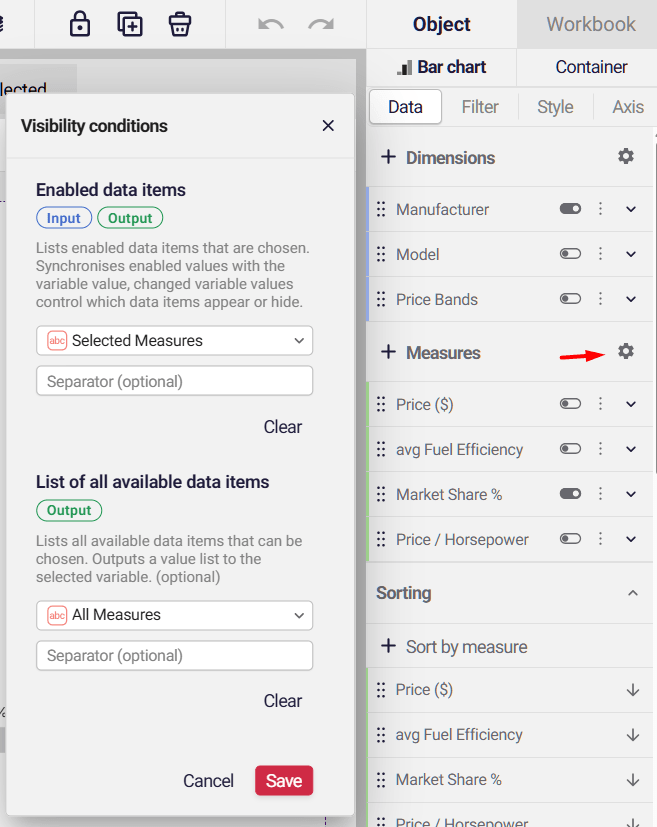
Drive alternate measures & dimensions using variables & dropdowns
Section titled “Drive alternate measures & dimensions using variables & dropdowns”A new, fast approach to choosing dimensions, measures and columns, without relying on actions. Charts that share measures/dimensions can use a single dropdown.
How it works (simple)
-
Create a variable (e.g. Selected Measure)
- We recommend creating another variable to list all options (e.g. All measures), to ensure users have an up-to-date list of all available options
-
Use Visibility conditions on measures or dimensions
-
Each item listens to the same variable value
-
Change the dropdown → charts update instantly
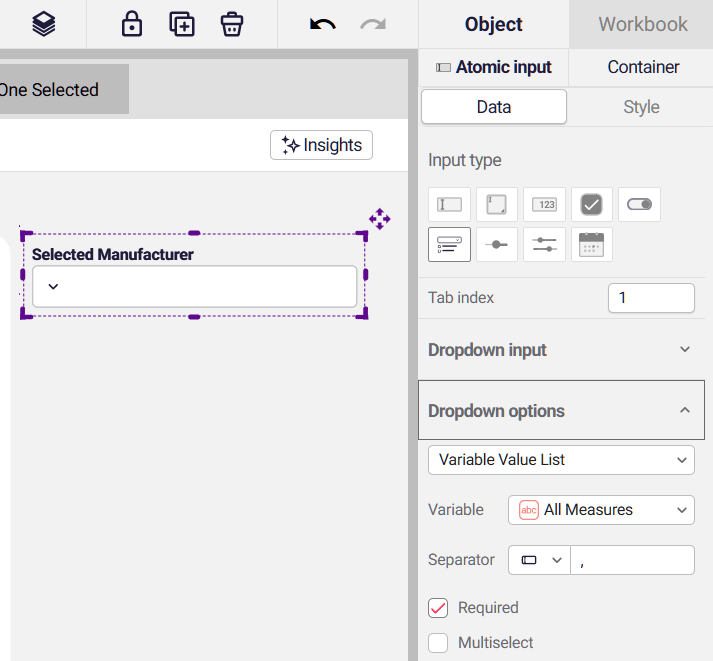
Atomic input (dropdown). Allow listed values to read from a variable.
Section titled “Atomic input (dropdown). Allow listed values to read from a variable.”This option allows you to read a list of values directly from a variable, an alternative to a manual list, or loading values from a field in the data. Works well with actions, especially altering the available data based on stakeholder permissions, as well as the new variable-driven alternate measures.
3.24 - 04 December 2025
Section titled “3.24 - 04 December 2025”Freeze table columns
Section titled “Freeze table columns”Freeze Columns makes wide tables easier to read and work with. When you scroll across lots of fields, your key identifiers stay fixed on the left, so you never lose context.
This is useful when:
-
reviewing wide tables 📏
-
comparing metrics side-by-side 🔍
-
doing row-level analysis, whilst keeping the category/entity in full view
It speeds up QA, makes analysis smoother, and reduces mistakes because users always see the anchor column while exploring data.
3.23 - 26 November 2025
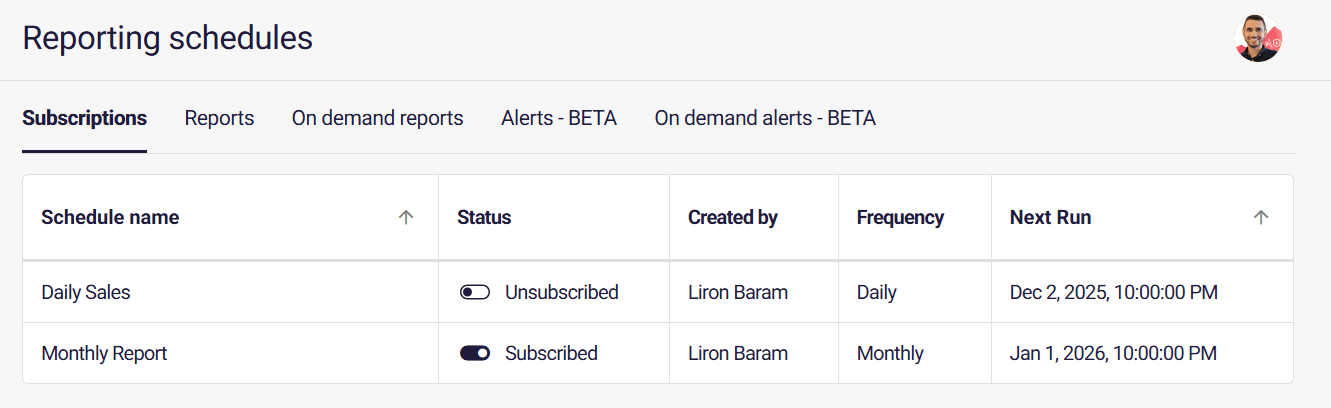
Section titled “3.23 - 26 November 2025”Report Subscriptions
Section titled “Report Subscriptions”Reports deliver data insights to end users and encourage them to act on them.
They help increase the adoption of analytics apps.
The new subscription option allows users to subscribe to distribution schedules, ensuring they receive data at a time that suits them and aren’t overwhelmed by too many reports.
Subscribing to reports is as simple as enabling a switch. ☑️
Users have a clear view of the reports they subscribed to, and can opt out at any time.
Advanced Text Editor for Chart Titles
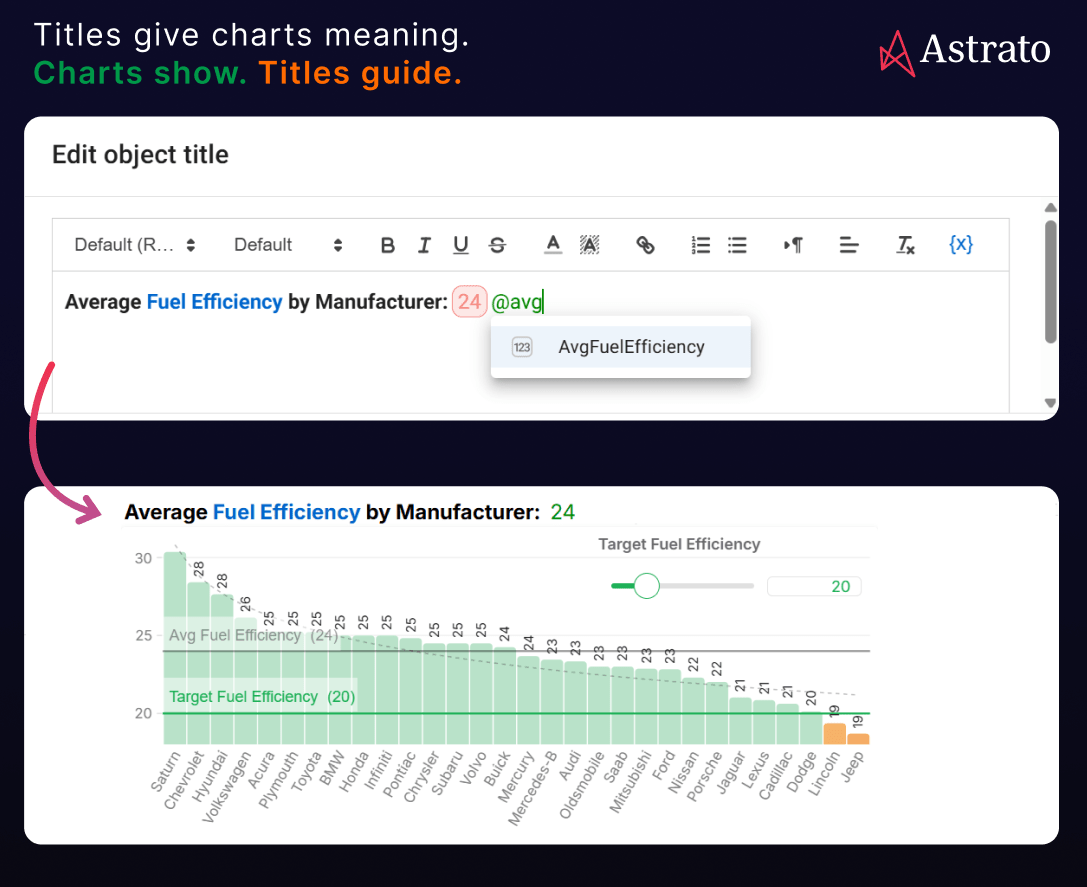
Section titled “Advanced Text Editor for Chart Titles”The chart title is essential for helping users understand what is displayed and highlighting the critical insights available.
The new advanced editing option allows more design options that include:
-
Coloring of the whole title or part of the title, using multiple colors
-
Include variables in the title to support dynamic title content
-
Control every aspect of the text, including color, size, font type, right-to-left display, and more.
-
Include Links in the title.
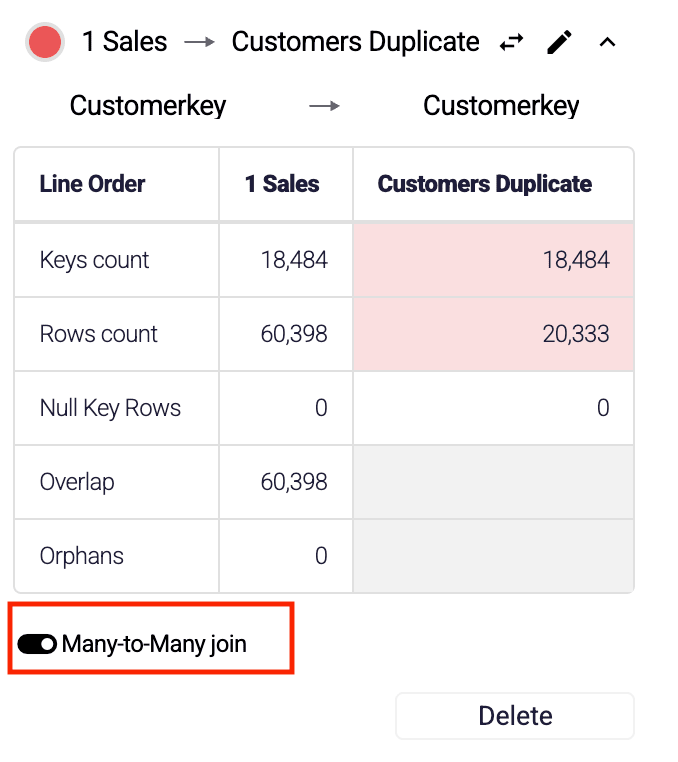
Many-to-Many Join Type
Section titled “Many-to-Many Join Type”A new option to set the join type to many-to-many. When setting a join to this type, the Astrato engine will optimize queries to reduce result duplication and improve query efficiency by removing it when possible.
Many-to-many joins are very common in real-life use cases: For example, a customer is assigned to multiple staff members. A product that is part of various categories.
Improved Semantic Layer Display and Performance
Section titled “Improved Semantic Layer Display and Performance”The Astrato semantic layer is the brain of the analytics apps; it is where semantic models and shared measures and dimensions are defined, converting data into business-friendly information.
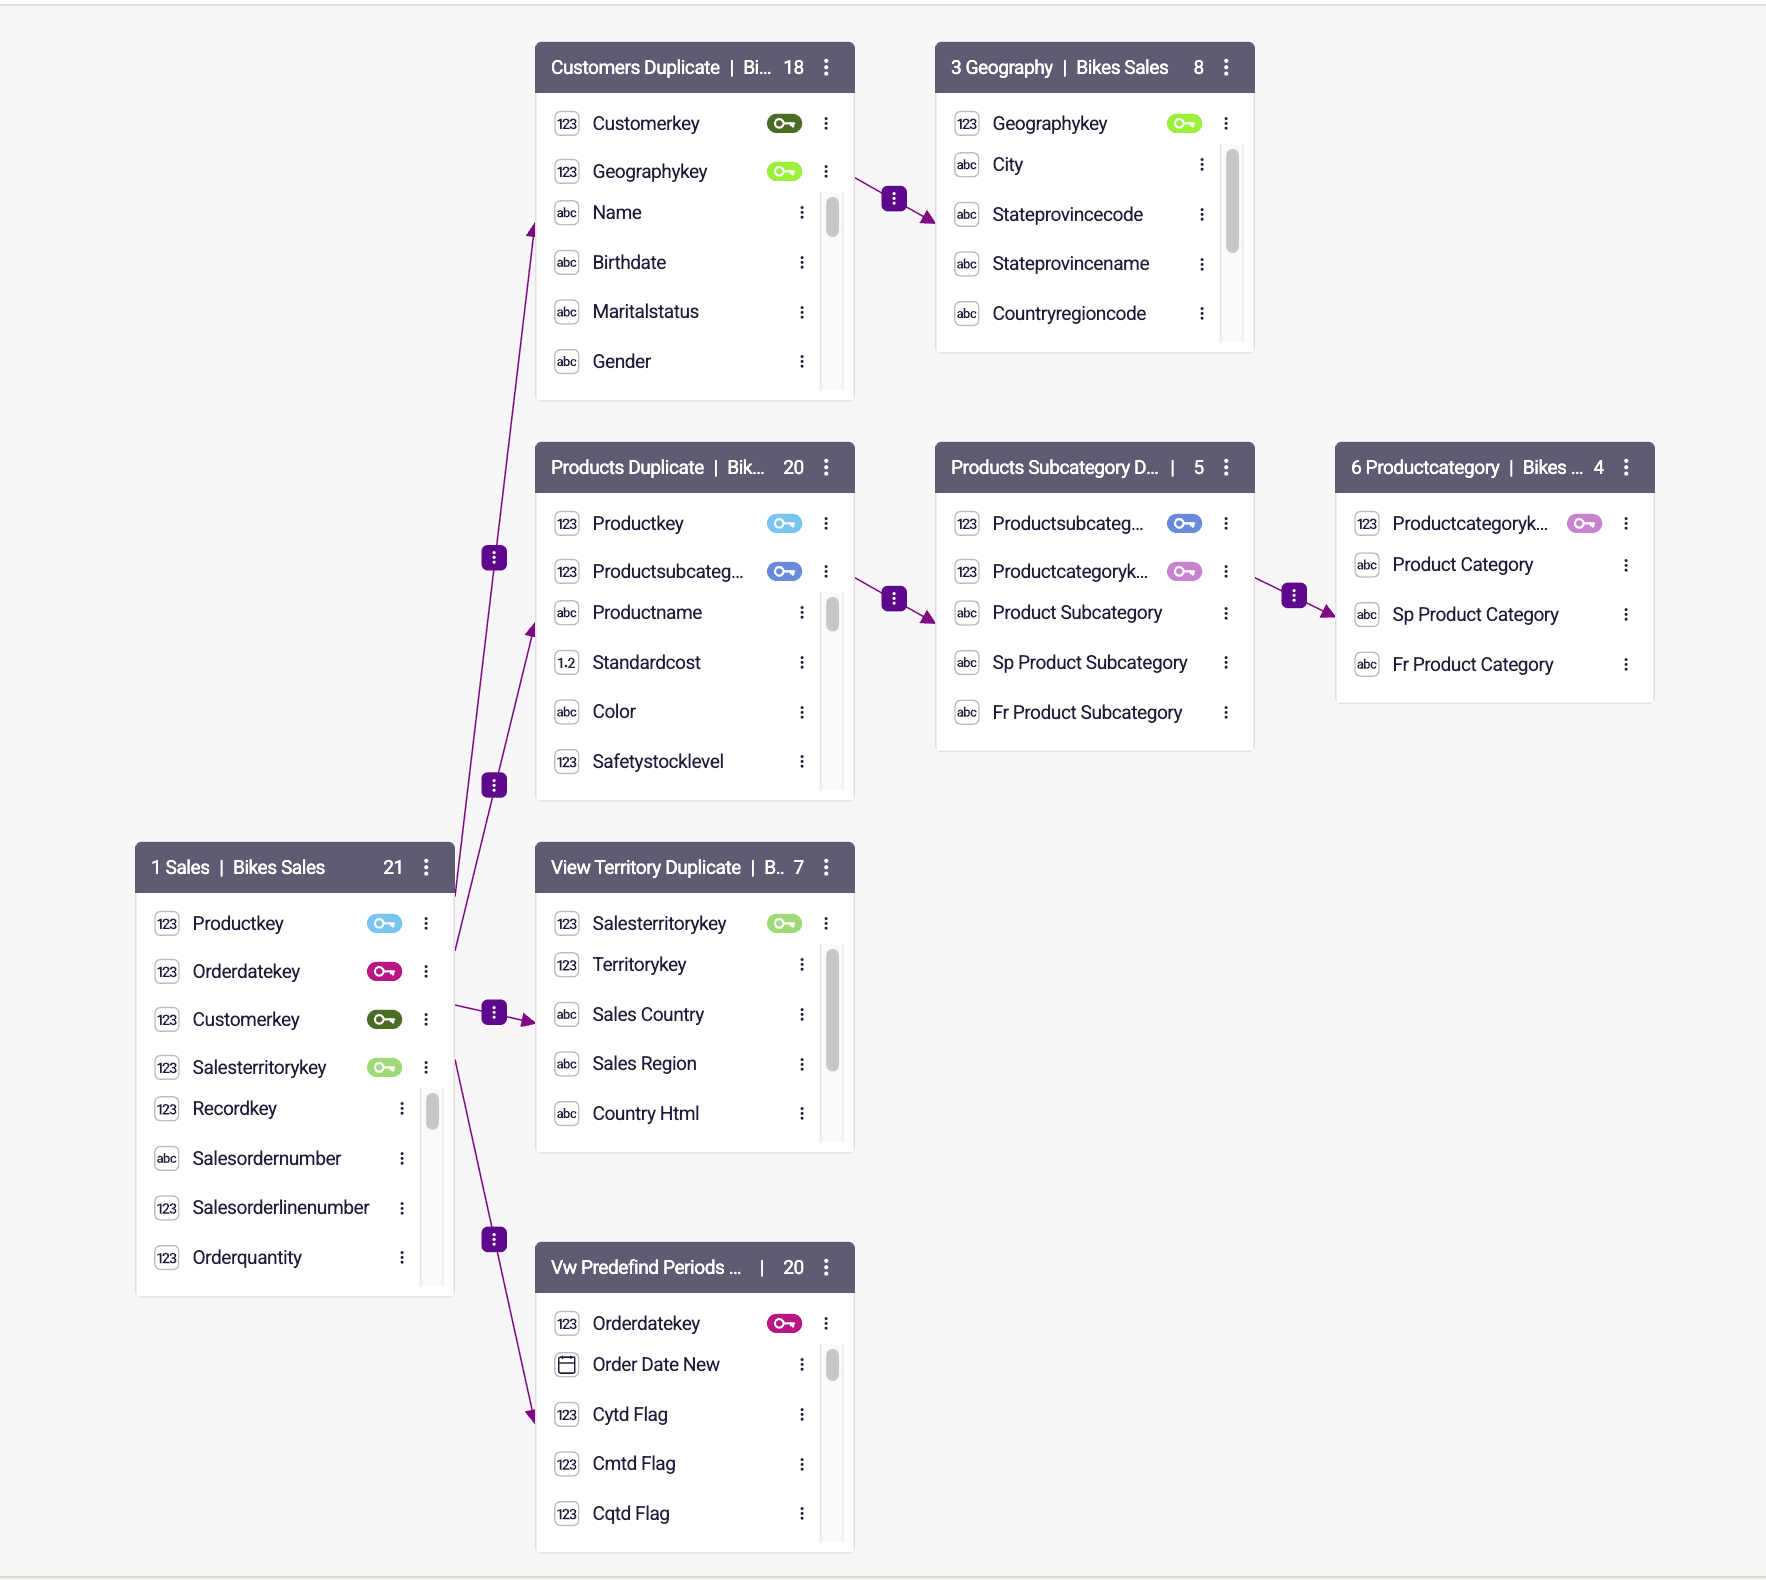
The latest release includes significant improvements in the semantic layer performance, and, a new display for tables that simplifies searching for fields by scrolling the fields list in the table.
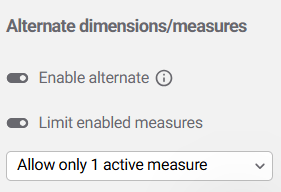
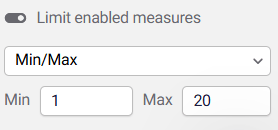
Alternate Measures - Limit measures, always 1 selected measure
Section titled “Alternate Measures - Limit measures, always 1 selected measure”Alternate measures can now be limited to a specific number of measures. This enables forcing specific chart configurations, such as a multi-line chart.
Editor Experience - Grouping
Section titled “Editor Experience - Grouping”We’ve made some enhancements to grouping. Creating and opening groups is now much faster.
You can now nest groups inside existing groups.
3.22 - 20 November 2025
Section titled “3.22 - 20 November 2025”🆕AI Providers & AI Actions Advanced Settings
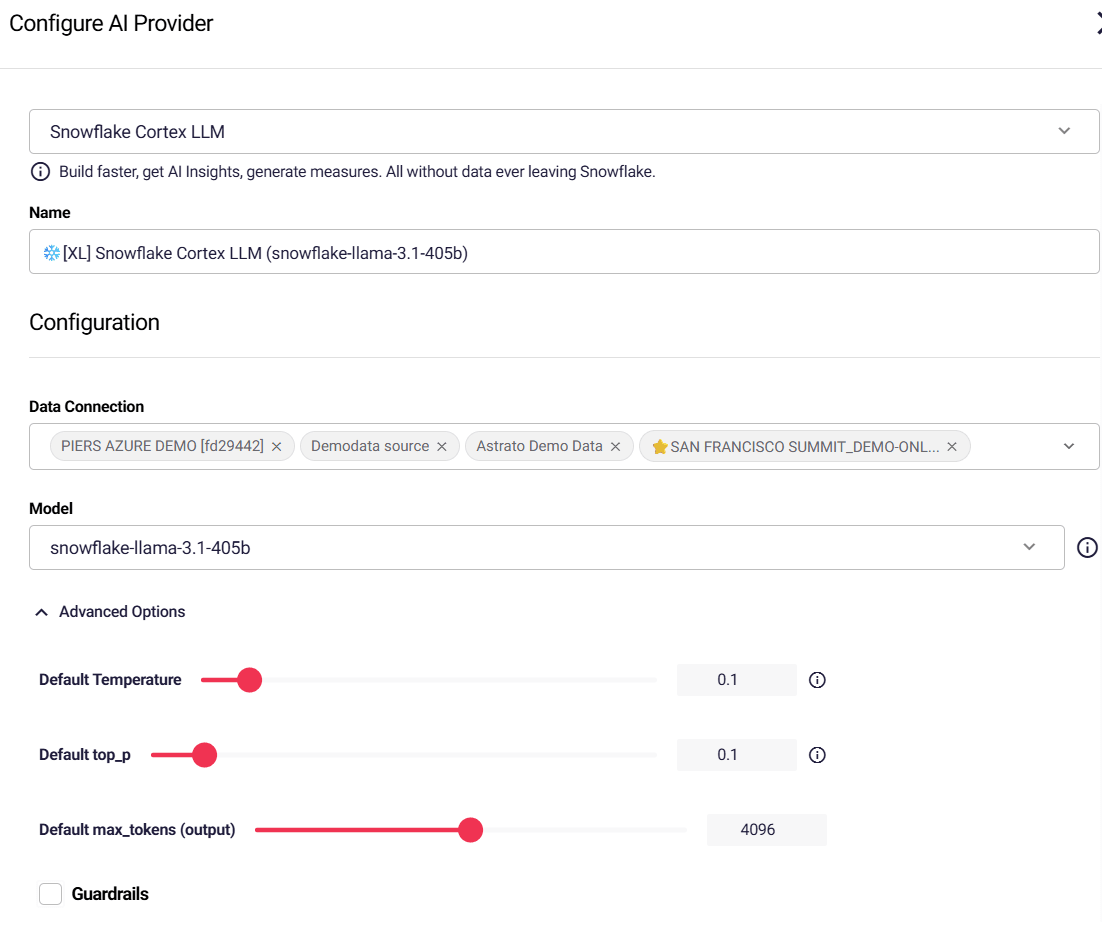
Section titled “🆕AI Providers & AI Actions Advanced Settings”You can now set advanced setting when you add a model to our AI Providers list. Temperature controls how much variation or creativity the AI adds to its responses. top_p controls how confidently AI interprets your data. Lower setting return responses that are more consistent and modest responses.
Settings are also available in Actions.
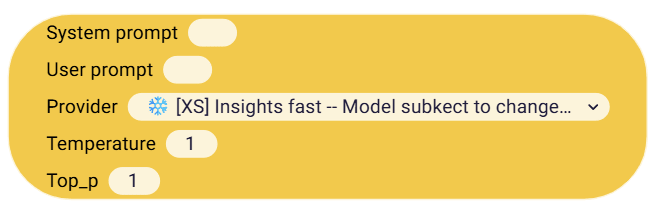
ℹ️Settings vary per AI Provider (Snowflake Cortex, Gemini, OpenAI, Azure OpenAI)
🆕 Period over Period Enhancements
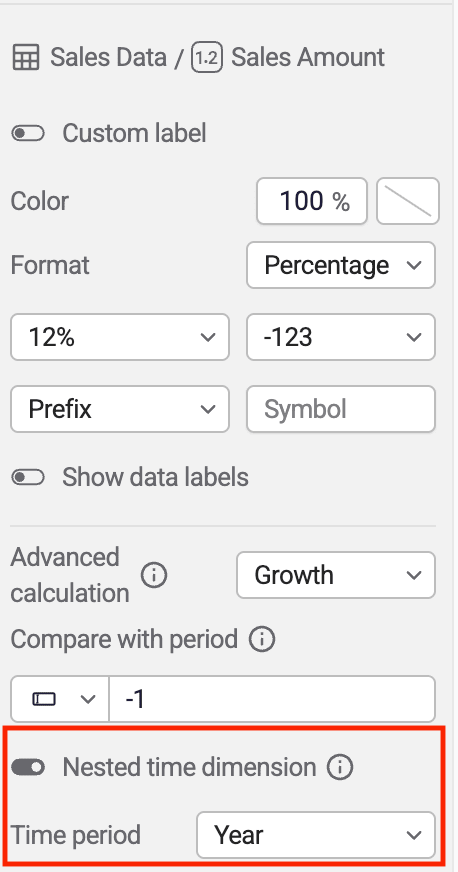
Section titled “🆕 Period over Period Enhancements”Period-over-period measures, such as Year-over-Year and Month-over-Month, are widespread and essential for comparing current performance with previous performance.
With this release, defining these types of measures in a KPI or Non-Time chart is simple and easy to set up. This is part of Astrato’s commitment to building a complete self-service analytics.
Navigation responsiveness
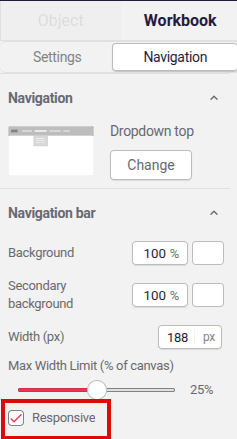
Section titled “Navigation responsiveness”Our navigation now has a responsive option, to automatically optimise based on the available space in the canvas. This is enabled by default for NEW workbooks.
3.21 - 06 November 2025
Section titled “3.21 - 06 November 2025”Variable Scopes
Section titled “Variable Scopes”Scopes let the same variable name hold a different value in different parts of the workbook.
Every object sits inside a container. A container can have a scope. When a scope is set, variables inside that container don’t use the global value — they use the scoped one instead.
Think of each scope as its own little world. Same variable name, but it can mean something different depending on where it lives.
Why this matters
You can now reuse the same chart layout, same logic, and same variable names across different sections of a workbook — but have each section show different numbers, filters, or labels.
Useful for:
-
Comparing two metrics side-by-side using the same chart layout
-
Running “what if” tests without affecting other parts of the page
-
Adding local annotations or highlights controlled by variables
How it works
-
Select a container (any panel, sheet section, or group).
-
Open Container Settings.
-
Scroll to Scope.
-
Turn it On and give it a scope name.
All containers that share the same scope name share the same variable values.Containers with no scope use the global variable values.
Quick Example
You have a chart template powered by a variable called selected_metric.
You duplicate the chart three times.You set each chart’s container to a different scope:
-
Scope A →
selected_metric = Revenue -
Scope B →
selected_metric = Cost -
Scope C →
selected_metric = Profit
Same template. Same variable name. 3 different results. No messy variable renaming. No extra logic.
Scope Defaults
When a container has a scope, you can also give variables in that scope their own default values.
This means:
-
The global default stays how it is.
-
But inside this scope, the variable starts with a different value.
Example:Global default for Today's Date = TodayScope default for Today's Date = Last Month
So charts in this scope load with Last Month, while the rest of the workbook still uses Today.
How to set it
-
Open the container settings.
-
Turn on Enable scope variable.
-
Choose which variable(s) get a default in this scope.
-
Set the value.
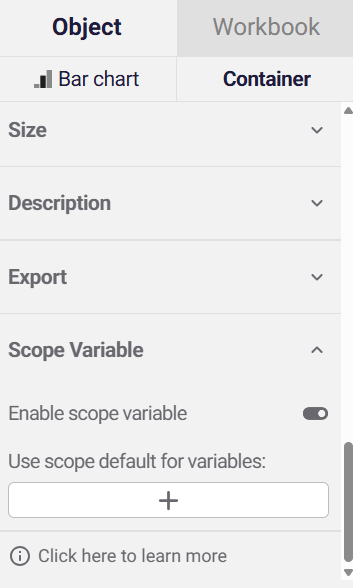
Actions for Variable Scopes
When using Variable Change actions with scoped variables, you can now detect which scope triggered the change.
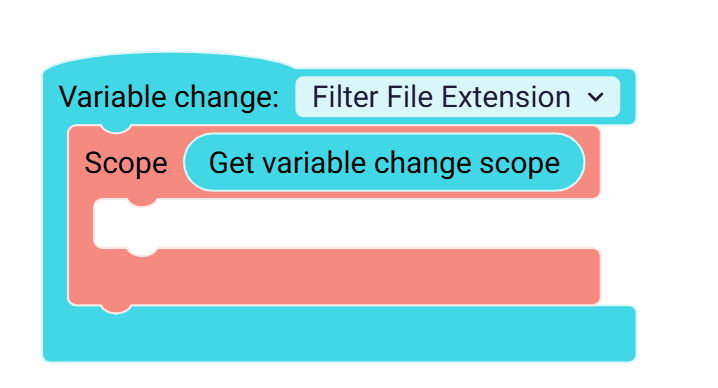
Use the Get variable change scope block inside your action flow to capture the scope context.This lets you build actions that respond only to variable updates within a specific scope — ideal when multiple scopes share the same variable names.
3.20 - 29 October 2025
Section titled “3.20 - 29 October 2025”Scatter Chart - Reference Areas
Section titled “Scatter Chart - Reference Areas”You can now add Reference Areas to scatter charts to highlight key regions, thresholds, or quadrants for clearer insights 🎯
Define X/Y min and max to create shaded zones that make context instantly visible — ideal for visual segmentation and decision support. Bring instant context to scatter plots — no extra annotation or dashboard text needed.
Use cases:
-
Highlight “Premium”, “Affordable” segments on price-performance charts
-
Create quadrants (e.g. Cost vs. ROI) to categorize points visually
-
Mark safe operating zones or thresholds (e.g., within budget, above target)
-
Emphasize benchmark regions such as “Top 10% performers” or “Outliers”
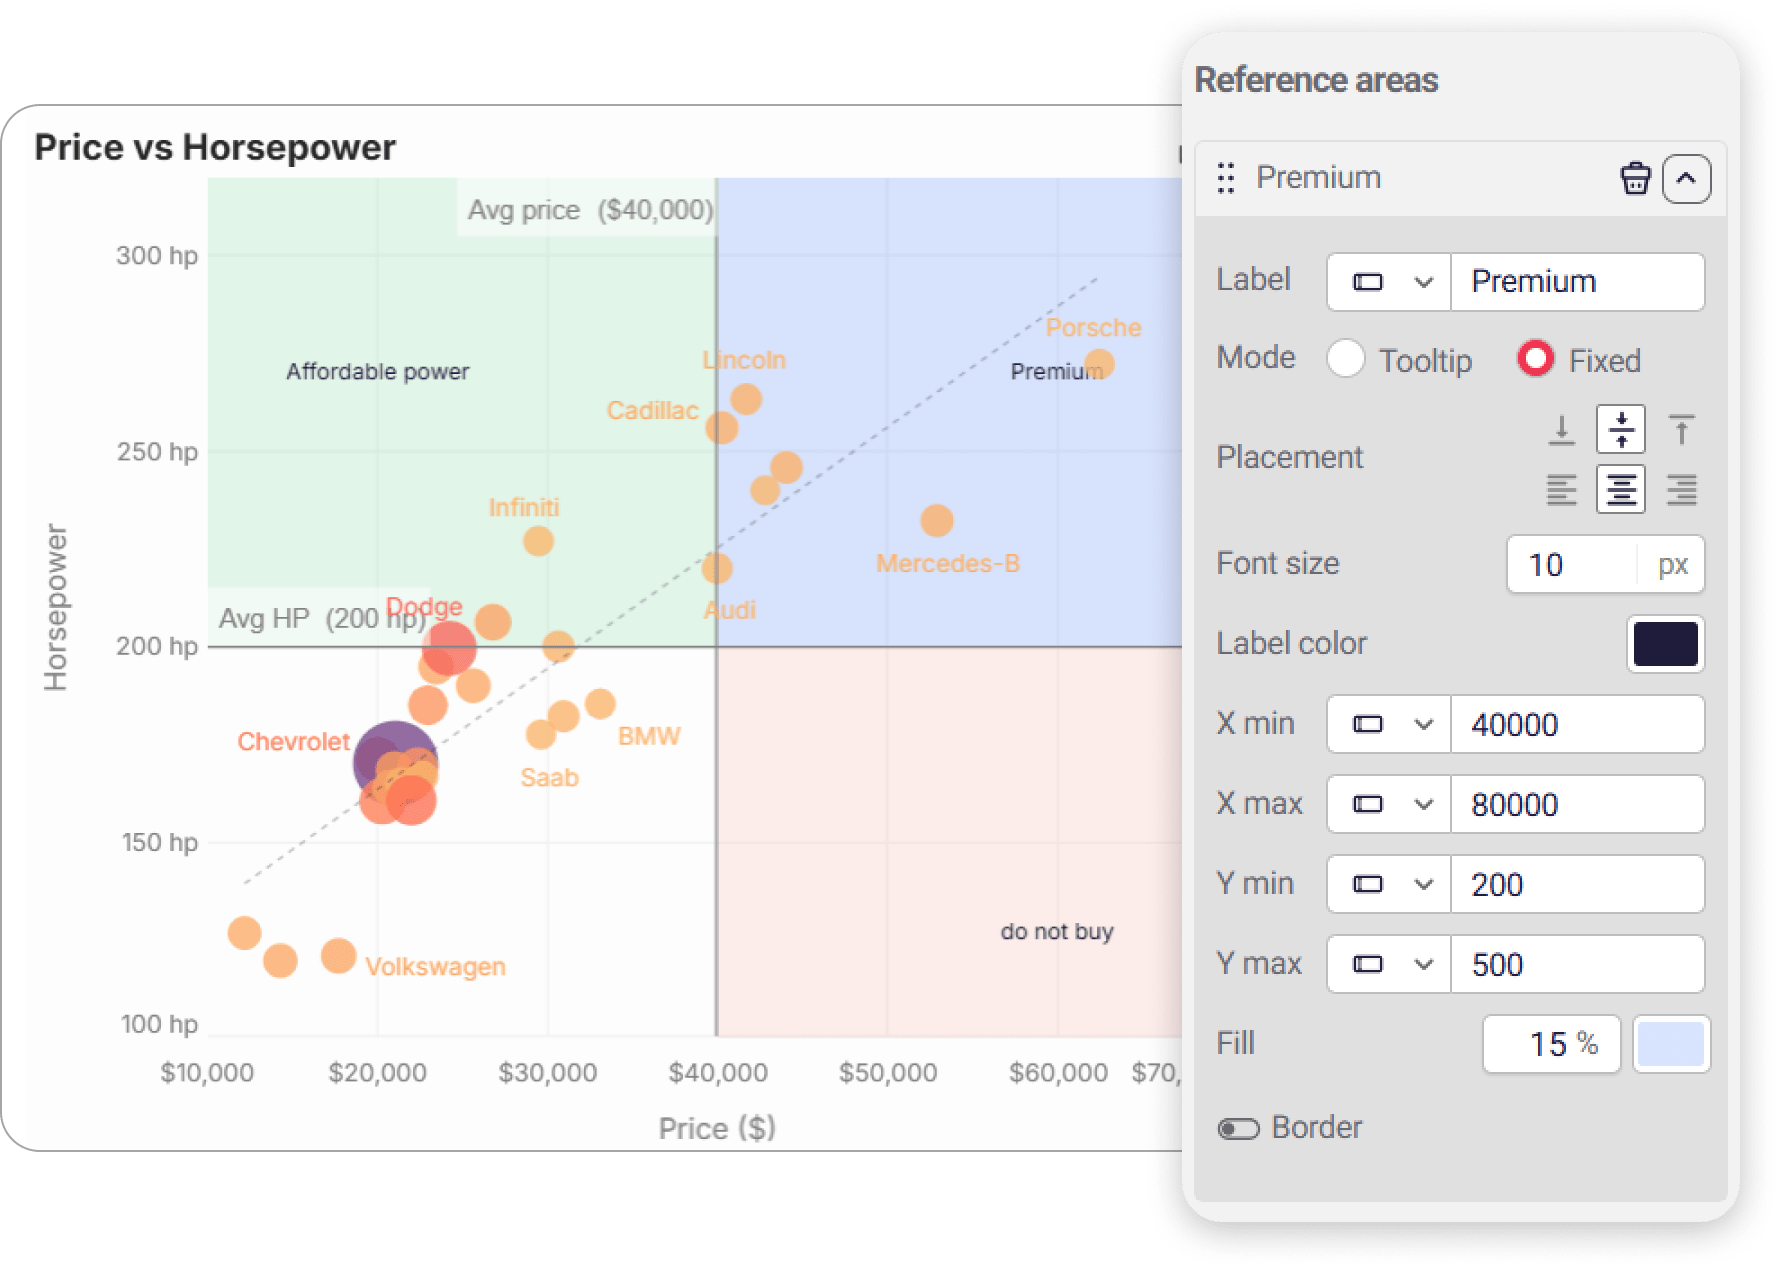
Personalised Scheduled Reporting (Run as User)
Section titled “Personalised Scheduled Reporting (Run as User)”You can now send scheduled reports as each recipient — ensuring every user receives data scoped to their own permissions, filters, and variables.
What’s new:
-
New checkbox: Run as each recipient under Recipients
-
Each report runs in the Current User context (RLS, variables, and permissions apply)
-
Supports dynamic elements like user-specific titles, filters, and themes
Safeguards:
-
Disabled if any recipient email is external
-
Skips inactive users with log entry
-
Up to 500 recipients per schedule
**Why it matters:**No more cloning reporting schedules for each user. One setup now delivers personalised, secure reports to everyone — automatically respecting their access level.
Change Table Source
Section titled “Change Table Source”Create a new table but want to keep all of your measures and filters? Easy! Click on the table menu to change the source table.
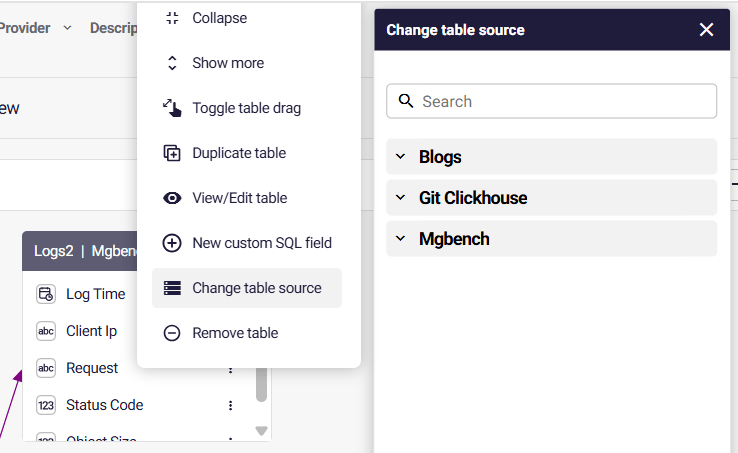
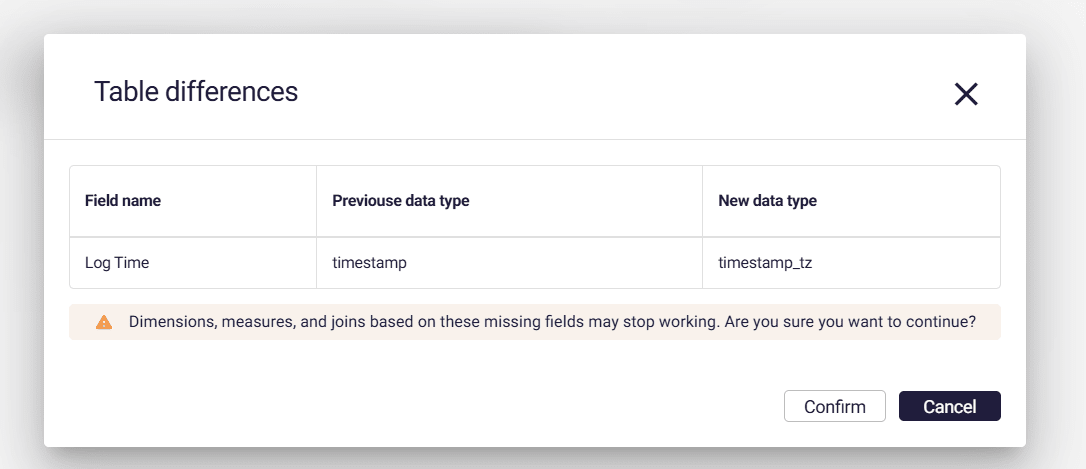
Filter bar - option to hide “Clear all”
Section titled “Filter bar - option to hide “Clear all””We’ve added the option to hide clear all.
Use cases
In case of using hidden fields, you may not want users to hide every filter. This allows for better control over user actions as well as ensuring certain filters are applied, for example it could be store location which you do not want a user to be able to clear.
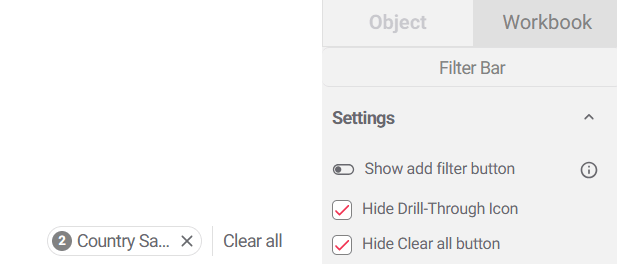
3.19 - 23 October 2025
Section titled “3.19 - 23 October 2025”Range slider control input (dual value support)
Section titled “Range slider control input (dual value support)”Our updated slider control object, now has a range mode for numeric variables.
-
Each handle can bind to a separate number variable (e.g.,
StartandEnd). -
Ideal for filtering data between two values, such as date or numeric ranges.
-
Visual update to reflect the selected range with a highlighted segment between handles.
**Example use case:**Easily create “From–To” filters (e.g., Year, Price, Score) that dynamically adjust visualizations or datasets.
Disable chart interactions
Section titled “Disable chart interactions”You can now disable chart interactions for each object in the filter section, this disables the option for end-users filtering using the chart.
This is ideal for encouraging end-users to rely on filter objects.
Changing alternate measures is still supported.
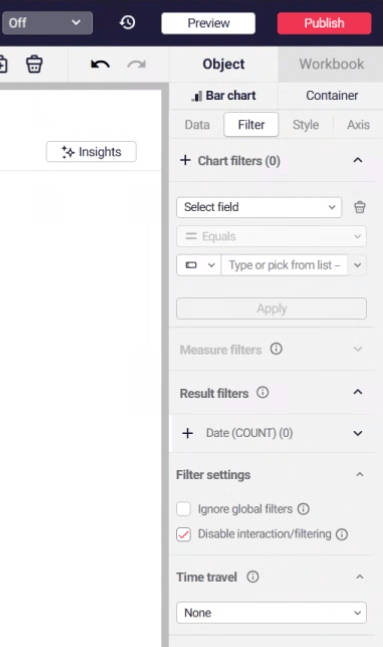
Navigation - width customisation
Section titled “Navigation - width customisation”We now support longer titles in the navigation, as well as supporting width customisation.
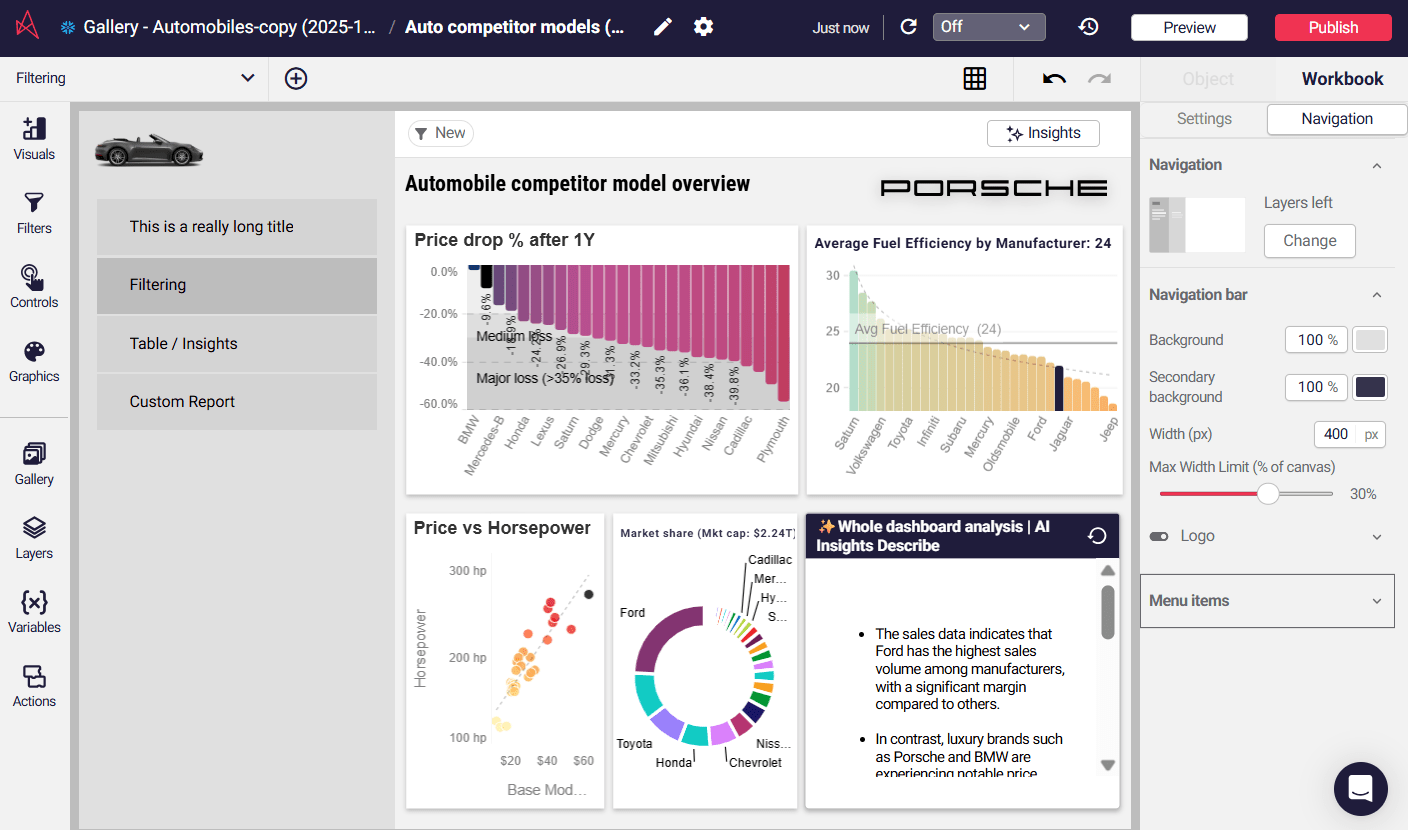
🆕 Bulk Copy / Paste Variables
Section titled “🆕 Bulk Copy / Paste Variables”A major quality-of-life upgrade for power users.You can now copy and paste multiple variables using a simple CSV format — ideal for managing large sets of date labels, flags, or other workbook variables.
-
Copy selected variables → CSV copied to clipboard
-
Paste CSV into another workbook to migrate or bulk-edit
-
Modify variables externally in Excel or a text editor
-
Handles name conflicts with override prompts
-
Validation and error handling for malformed CSVs
This feature streamlines multi-variable workflows without needing an in-app bulk editor.
🆕 Semantic Layer Filter Parameterization
Section titled “🆕 Semantic Layer Filter Parameterization”This feature lets you filter datasets dynamically using parameters or variables instead of fixed values. Parameters act as placeholders that can be controlled by user input, actions, or pre-defined logic—making dashboards more interactive and adaptable to different user needs.
To try this out:
-
Open your semantic layer
-
Click on the menu of the table, to Edit/view the table
-
Click on the filter icon
-
When filtering, make sure to select the parameter option, where the default is “value”
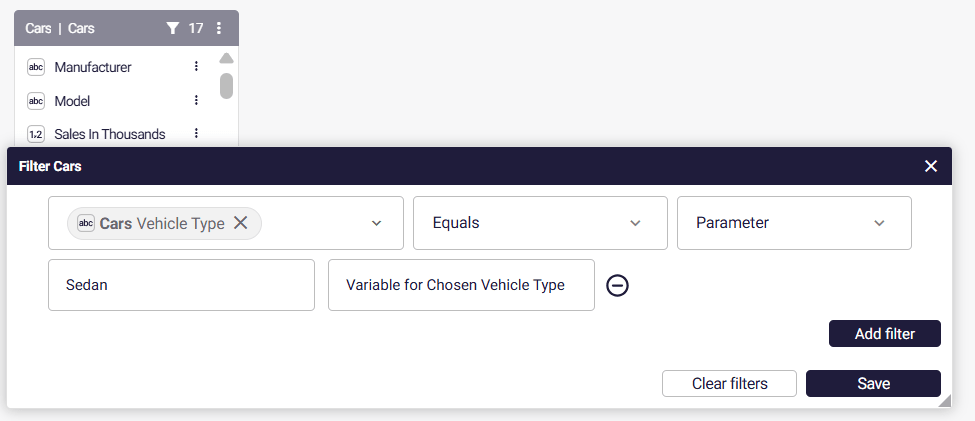
Visualization: Alternates-Ready Visuals Released
Section titled “Visualization: Alternates-Ready Visuals Released”Word Cloud, Gauge, Distribution Gauge, and Radar charts now fully support alternate measures and dimensions.
Table Enhancements
Section titled “Table Enhancements”New table actions let you toggle columns and update calculated columns dynamically
Custom Report Improvements
Section titled “Custom Report Improvements”The chip order in bookmarks is now saved for a consistent user experience.
Section titled “The chip order in bookmarks is now saved for a consistent user experience.”💡 Other Enhancements
Section titled “💡 Other Enhancements”-
Improved visibility of initial “Thinking” text during load
-
Alternates-Ready Visuals Released: Word Cloud, Gauge, Distribution Gauge, and Radar charts now fully support alternate measures and dimensions.
-
Table Enhancements: New table actions let you toggle columns and update calculated columns dynamically
-
Custom Report Improvements: The chip order in bookmarks is now saved for a consistent user experience.
3.18 - 16 October 2025
Section titled “3.18 - 16 October 2025”🎁🆕 PowerPoint export - Private preview
Section titled “🎁🆕 PowerPoint export - Private preview”Astrato can now export to powerpoint!
Bring your data stories straight into PowerPoint. Astrato now lets you export any dashboard to a fully formatted presentation — ready for client meetings, board reviews, or quick updates without screenshots or static decks.
🎯 Perfect for recurring business reviews, stakeholder updates, or investor decks — while keeping Astrato as your live source of truth.
📊 A welcome addition to our existing PDF and Excel scheduled reporting. Share insights in any format your audience prefers.

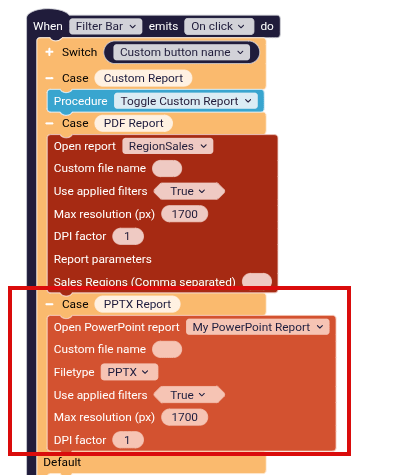
Iframe object
Section titled “Iframe object”You can now embed external web pages, apps or videos inside an Astrato workbook.
Admins must allow the domain:
-
Go to Admin › Security › Content Security Policy (CSP).
-
Add domains under Allowed iframe domains. Example:
Copy action workspaces between workbooks
Section titled “Copy action workspaces between workbooks”You can now copy Action Workspaces from one workbook to another.
Reuse complex logic, like navigation, variable updates, and triggered actions, all without rebuilding.
Perfect for scaling consistent behavior across multiple dashboards in seconds.
📊 Alternative dimensions and measures - more charts supported
Section titled “📊 Alternative dimensions and measures - more charts supported”Alternative measures and dimensions enable users to explore data in a way that aligns with their natural thinking. They can swap or add new measures and dimensions directly in a visualization, instantly reframing the analysis without losing the context of surrounding charts. This flexibility turns dashboards into interactive data apps that surface new business questions and insights on the fly.
Initially available on: Bar, Line, Pie, Treemap, Sankey, Combo
Disable interactions on the chart
Section titled “Disable interactions on the chart”Control how users engage with charts.
When interactions are disabled, data points can no longer be selected or used to filter other visuals. Alternate measures and dimensions remain available for switching views.
This setting applies to Preview and Published modes, allowing you to lock charts for presentation or controlled reporting, while keeping full interactivity in the Editor for creators.
Ideal for static reporting views, or when you want users to explore data through set controls only.
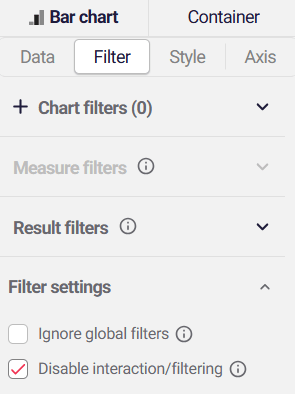
Initially available on: Bar, Line, Pie, Treemap, Sankey, Combo
Value dropdown for filters
Section titled “Value dropdown for filters”Pick & search values to filter, from a list, no need to copy/paste.
Work smarter & faster.
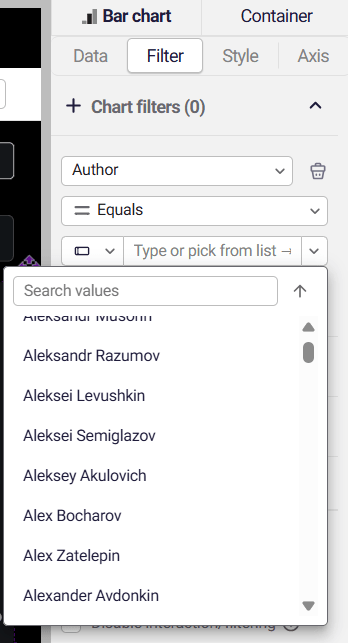
Initially available on: Bar, Line, Pie, Treemap, Sankey, Combo
Support nested totals in Nested Advanced Calculations
Section titled “Support nested totals in Nested Advanced Calculations”Astrato now supports nested totals in Advanced Calculations, making them perfect for use in the table.
3.17.1 - 09 October 2025
Section titled “3.17.1 - 09 October 2025”⚡️Actions: Chart Actions
Section titled “⚡️Actions: Chart Actions”Enabling end-users to control the display of visualizations and select the data displayed in them.
Gives Data App creators a more straightforward way to build a guided analytics experience that covers more use cases and allows end users to adjust the app to their preferences.
(* Currently supported in Bar Chart and Line Chart.)
3.17 - 28 September 2025
Section titled “3.17 - 28 September 2025”📱 Improved Table Responsiveness
Section titled “📱 Improved Table Responsiveness”All charts, tables, and objects in Astrato are designed to be responsive. Until now, table fonts and sizing did not adjust when screen size changed, which could make tables harder to read on smaller screens or packed dashboards.
With this update, tables now support responsive sizing options, giving you full control over how tables adapt across devices:
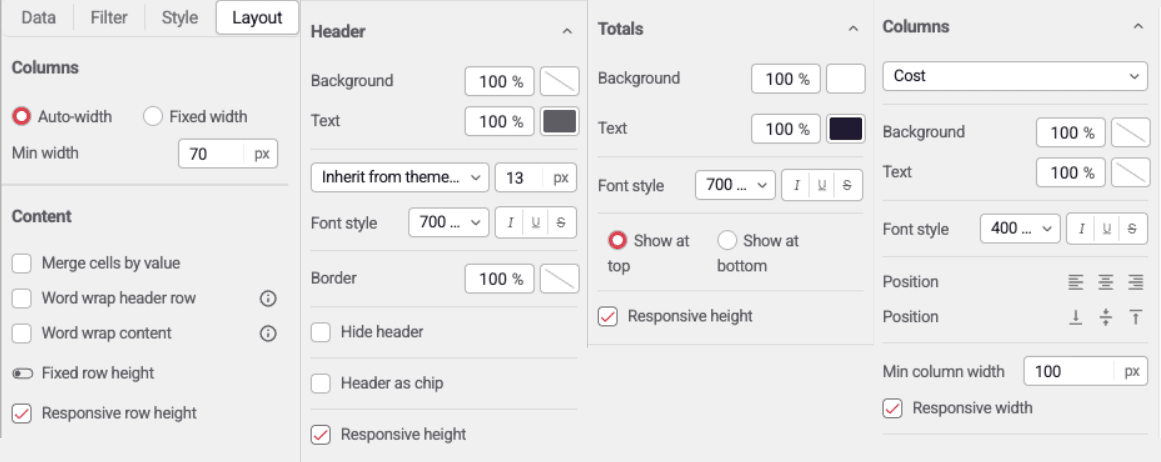
-
Responsive row height
-
Responsive header height
-
Responsive totals height
-
Responsive column width (per column or all columns)
This makes tables far more readable and user-friendly on mobile devices, laptops, or when resizing dashboards.
👉 Note: Responsiveness is currently available for straight tables only. Support for Pivot and Expandable tables will follow in upcoming releases.
🔒 Control Expandable Rows in Pivot Tables
Section titled “🔒 Control Expandable Rows in Pivot Tables”You can now disable row expansion for specific rows in expandable and pivot tables.
This is especially useful in Finance reports (e.g., P&L or Balance Sheet) where rolling sum rows should not expand to lower-level details.
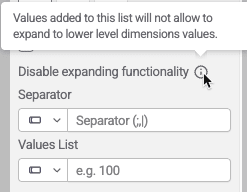
Settings are found on each dimension and provide fine-grained control over expansion behavior. Separator and Values List can be entered as static values or dynamically configured using string variables.
Σ Flexible Totals in Pivot Tables
Section titled “Σ Flexible Totals in Pivot Tables”Pivot tables now offer finer control over totals. Instead of showing totals for both rows and columns, you can choose to display them only for rows, only for columns, or both.
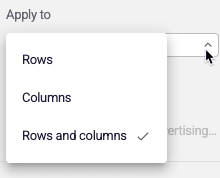
✨ New AI Models supported for OpenAI/Azure OpenAI+ fine-tuned models
Section titled “✨ New AI Models supported for OpenAI/Azure OpenAI+ fine-tuned models”Astrato now supports new models across all AI Capabilities. New model can be utilized through AI providers, which you can setup on this page. New models include variations of GPT-5, GPT-4.1, o3 + o4 thinking models.
💡What can I use these new models for?
Beyond faster chart creation and insight generation, these models can now drive logic in your Data Apps via Astrato Actions:
-
Automated Decision Support
Let AI compare two or more parameters (profitability, demand forecasts, SLA breaches) and recommend a preferred option. -
Data Quality Gatekeeping
When users submit writeback inputs (forecasts, comments, approvals), AI can automatically check for outliers, missing context, inconsistent units or formatting, and request clarification before committing. -
Context-Aware Suggestions
When users interact with variables/inputs, AI can proactively suggest filters, thresholds or next steps based on recent activity and historical trends. -
Natural Language Exception Handling
Instead of a hard validation rule (“Value too high”), return a conversational AI prompt explaining why and what to change. -
AI-Assisted Approvals
Route writebacks through an AI reviewer that can score likelihood/risk and escalate only edge cases to humans.
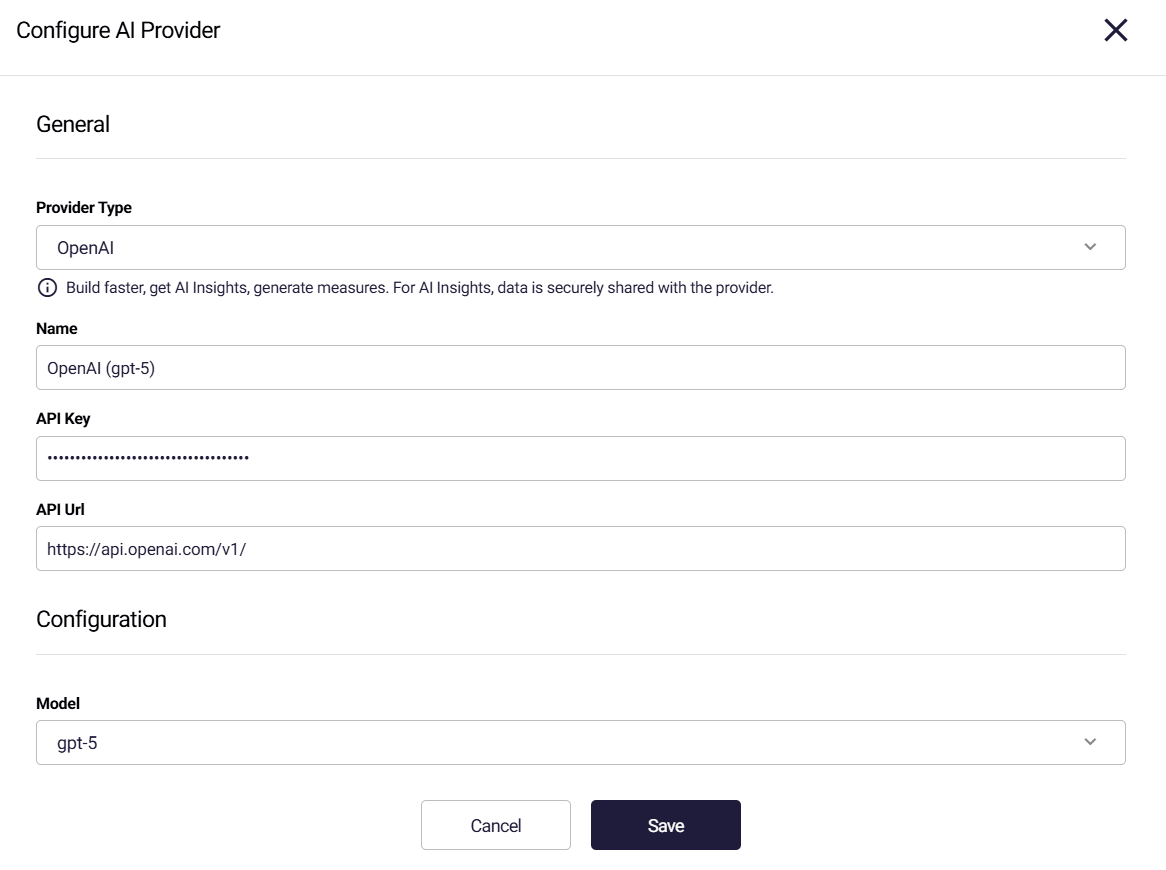
📝Self-Service Scheduled Reporting
Section titled “📝Self-Service Scheduled Reporting”Scheduled reports deliver timely data insights directly to your inbox, helping you stay informed about changes and key metrics without manual check-ins. They’re an excellent way to build data awareness and adoption across your organization.
In Astrato, any user can create and schedule reports for distribution. Data app creators control access by designating reports as public. End-users and viewers can then schedule delivery of public reports—allowing product managers, account managers, and other stakeholders to subscribe customers and colleagues to automated report delivery.
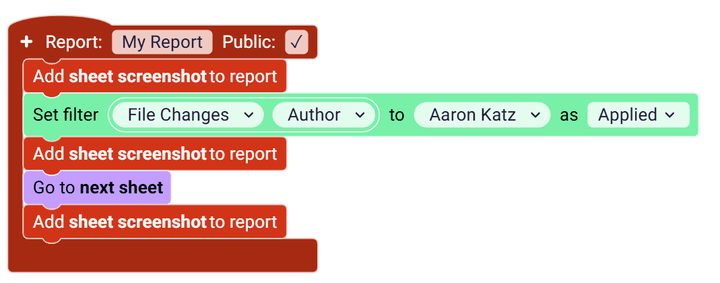
👉 Note: If you are an Admin, you will not see any difference.
🗒️ Dropdown Input Form - Multiple Values Input
Section titled “🗒️ Dropdown Input Form - Multiple Values Input”Input forms are an essential part of Data Apps in Astrato; they allow users to select data provided for Writeback input and custom filters.
The new dropdown input form allows the end-user to select multiple values as input. Other improvements include the option to filter optional values for selection and increased control over list sorting.
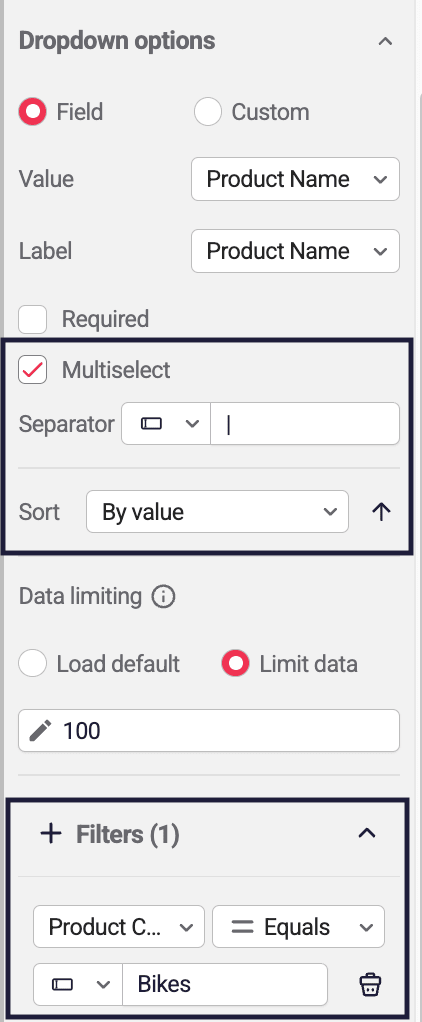
ClickHouse: Playground Connection
Section titled “ClickHouse: Playground Connection”
Astrato’s ClickHouse connector now allows establishing a connection to the ClickHouse playground.
ClickHouse Playground enables users to experiment with ClickHouse by running queries instantly, without the need to set up their own server or cluster. Several example datasets are available in Playground.
This will simplify ClickHouse customers’ evaluation of Astrato’s value without requiring them to connect Astrato to their data.
📝ClickHouse: WriteBack
Section titled “📝ClickHouse: WriteBack”
End-users’ ability to write back their inputs and insights to the datasource is what converts a dashboard into a data app that combines data with end-users’ knowledge to provide all users a holistic view of the situation.
Writeback is now available in the Astrato ClickHouse connection, enhancing the end-users’ experience and supporting more powerful data apps.
3.16.2 - 11 September 2025
Section titled “3.16.2 - 11 September 2025”📊 Visualizations: Alternative Measures and Dimensions
Section titled “📊 Visualizations: Alternative Measures and Dimensions”Alternative measures and dimensions enable users to explore data in a way that aligns with their natural thinking. They can swap or add new measures and dimensions directly in a visualization, instantly reframing the analysis without losing the context of surrounding charts. This flexibility turns dashboards into interactive data apps that surface new business questions and insights on the fly.
3.16.1 - 28 August 2025
Section titled “3.16.1 - 28 August 2025”ℹ️ Improved Display of Filters in the Filter Bar
Section titled “ℹ️ Improved Display of Filters in the Filter Bar”Filters are an essential part of any data analytics question; they provide the scope of the data that is used to generate the answers to the question.
With this release, the filter bar now provides even more context on the applied filters.
Using the new display of values, state questions about connections and combinations of values can be discovered.Each value is displayed in one of three states:
-
Selected - The value chosen by the user and applied to the displayed data.
-
Possible- The value can be combined with the selected values in the other fields.
-
Excluded- The value can’t be combined with the selected values in the other fields.
In the image below:
-
Medium Business is selected
-
Enterprise is possible and can be combined with the selected sectors.
-
Large Business and Small Business are excluded and can’t be combined with the selected sectors.
3.16 - 21 August 2025
Section titled “3.16 - 21 August 2025”✨ New AI Provider: Google Gemini
Section titled “✨ New AI Provider: Google Gemini”
Astrato now supports native integration with Google Gemini on GCP, giving you direct access to AI-powered insights — without moving a single row of data.We’re proud to announce that Astrato is a Google Cloud Technology Partner. That means our integration meets Google Cloud’s highest technical standards, and it’s ready for production use across your enterprise.
💡 Our Gemini integration works with ALL data connections, not just BigQuery
**⚡What’s New?**With Gemini in Astrato, you get instant access to state-of-the-art models from Google, directly in your BI workflows. Prefer something custom? You can bring your own model and connect it seamlessly.But this isn’t just another chatbot UI bolted onto BI.Astrato’s semantic layer and query engine work with Gemini to generate smart, context-aware SQL - not guesses. You don’t need to prep data, build pipelines, or handhold the model.
**✨Why Use Gemini in Astrato?**This is the first BI & Data App platform with in-cloud LLM control and security, all inside Google Cloud.
✅ tightly-coupled architecture for AI and data.Your data never leaves Google Cloud
✅ No-code requiredJust click to generate, models understand context via Astrato’s semantic layer.
This is AI that works inside your cloud, not outside it.
With Gemini in Astrato, you can:
-
Generate text, summaries, and contextual insights directly in your workbooks and data apps
-
Leverage multi-model support with state-of-the-art accuracy, right inside BigQuery
-
Integrate seamlessly into Astrato’s AI Blocks, without any additional setup
-
Maintain enterprise security and governance - data never leaves BigQuery
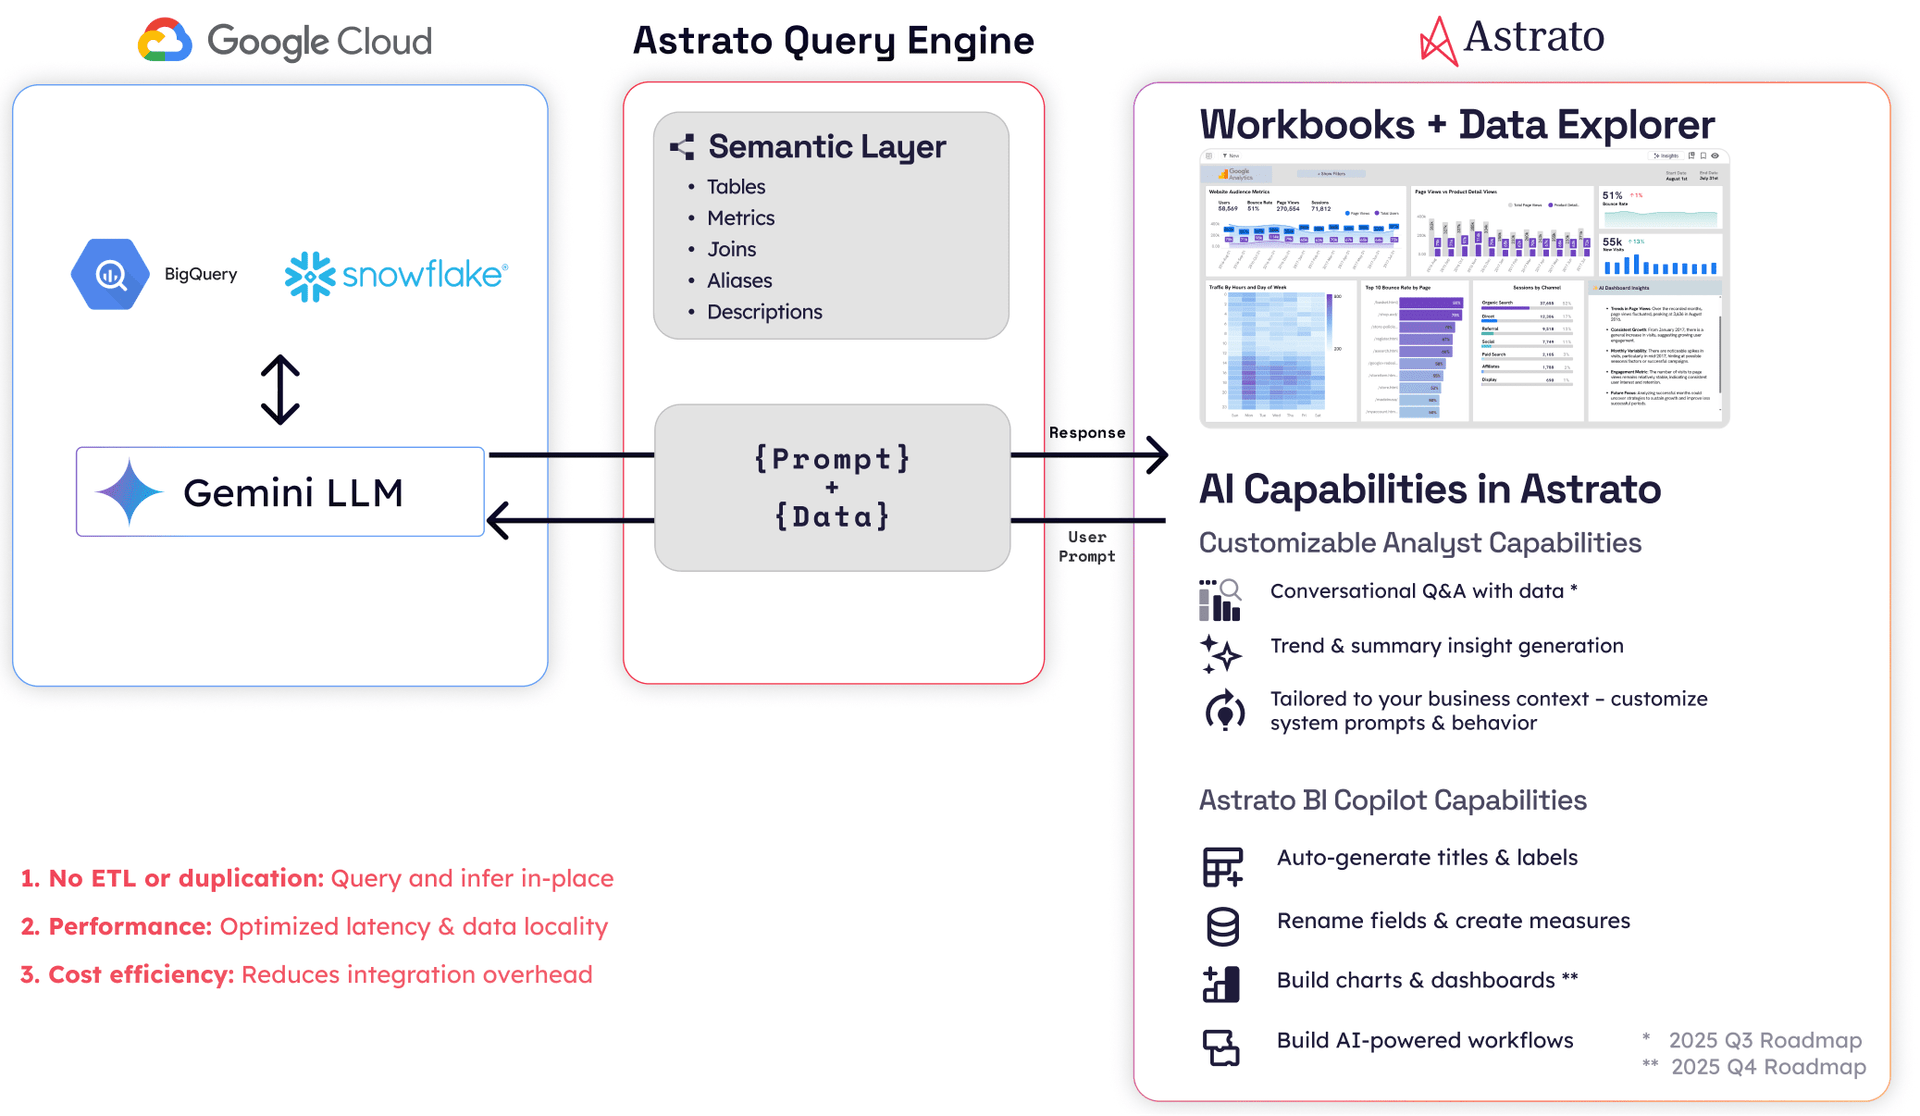
Unlike generic text-to-SQL approaches, Astrato combines Gemini with its semantic layer and query intelligence to deliver meaningful, context-aware results in your existing dashboards. This ensures AI enhances productivity while keeping your data secure, compliant, and trusted.
✉️ New Email Provider for Scheduler Reports: Brevo
Section titled “✉️ New Email Provider for Scheduler Reports: Brevo”
Astrato’s Scheduler now supports adding Brevo (formerly Sendinblue) as an additional email provider, alongside our existing SendGrid integration.
With Brevo, you can:
-
Integrate your own Brevo account and email domain
-
Send scheduled reports and alerts directly through Brevo
-
Leverage your existing Brevo email credits and infrastructure
-
Gain more control, security, and ownership over email distribution
-
Ensure enterprise-grade deliverability and compliance
This update is particularly valuable for organizations that have standardized on Brevo for their email communications and want tighter alignment with internal policies.
🔐 Granular Access Control for Data Connections & Semantic Layer
Section titled “🔐 Granular Access Control for Data Connections & Semantic Layer”Astrato now provides fine-grained permissions to strengthen control over data access while enabling self-service.

With this release, you can:
-
Define who can view or edit data connections.
-
Control who can create semantic layers on top of connections.
-
Enforce compliance and security policies at scale.
This ensures enterprise teams can protect sensitive data sources while empowering business users to build confidently on trusted data.
🗺️ ClickHouse: GEO support
Section titled “🗺️ ClickHouse: GEO support”
Astrato’s ClickHouse connector now supports the Geo data type, making it easier than ever to work with location-based datasets.
With this update, you can:
-
Query and analyze geospatial data natively in ClickHouse
-
Build maps and location-aware dashboards directly in Astrato
-
Unlock advanced scenarios in logistics, mobility, retail, and geospatial intelligence
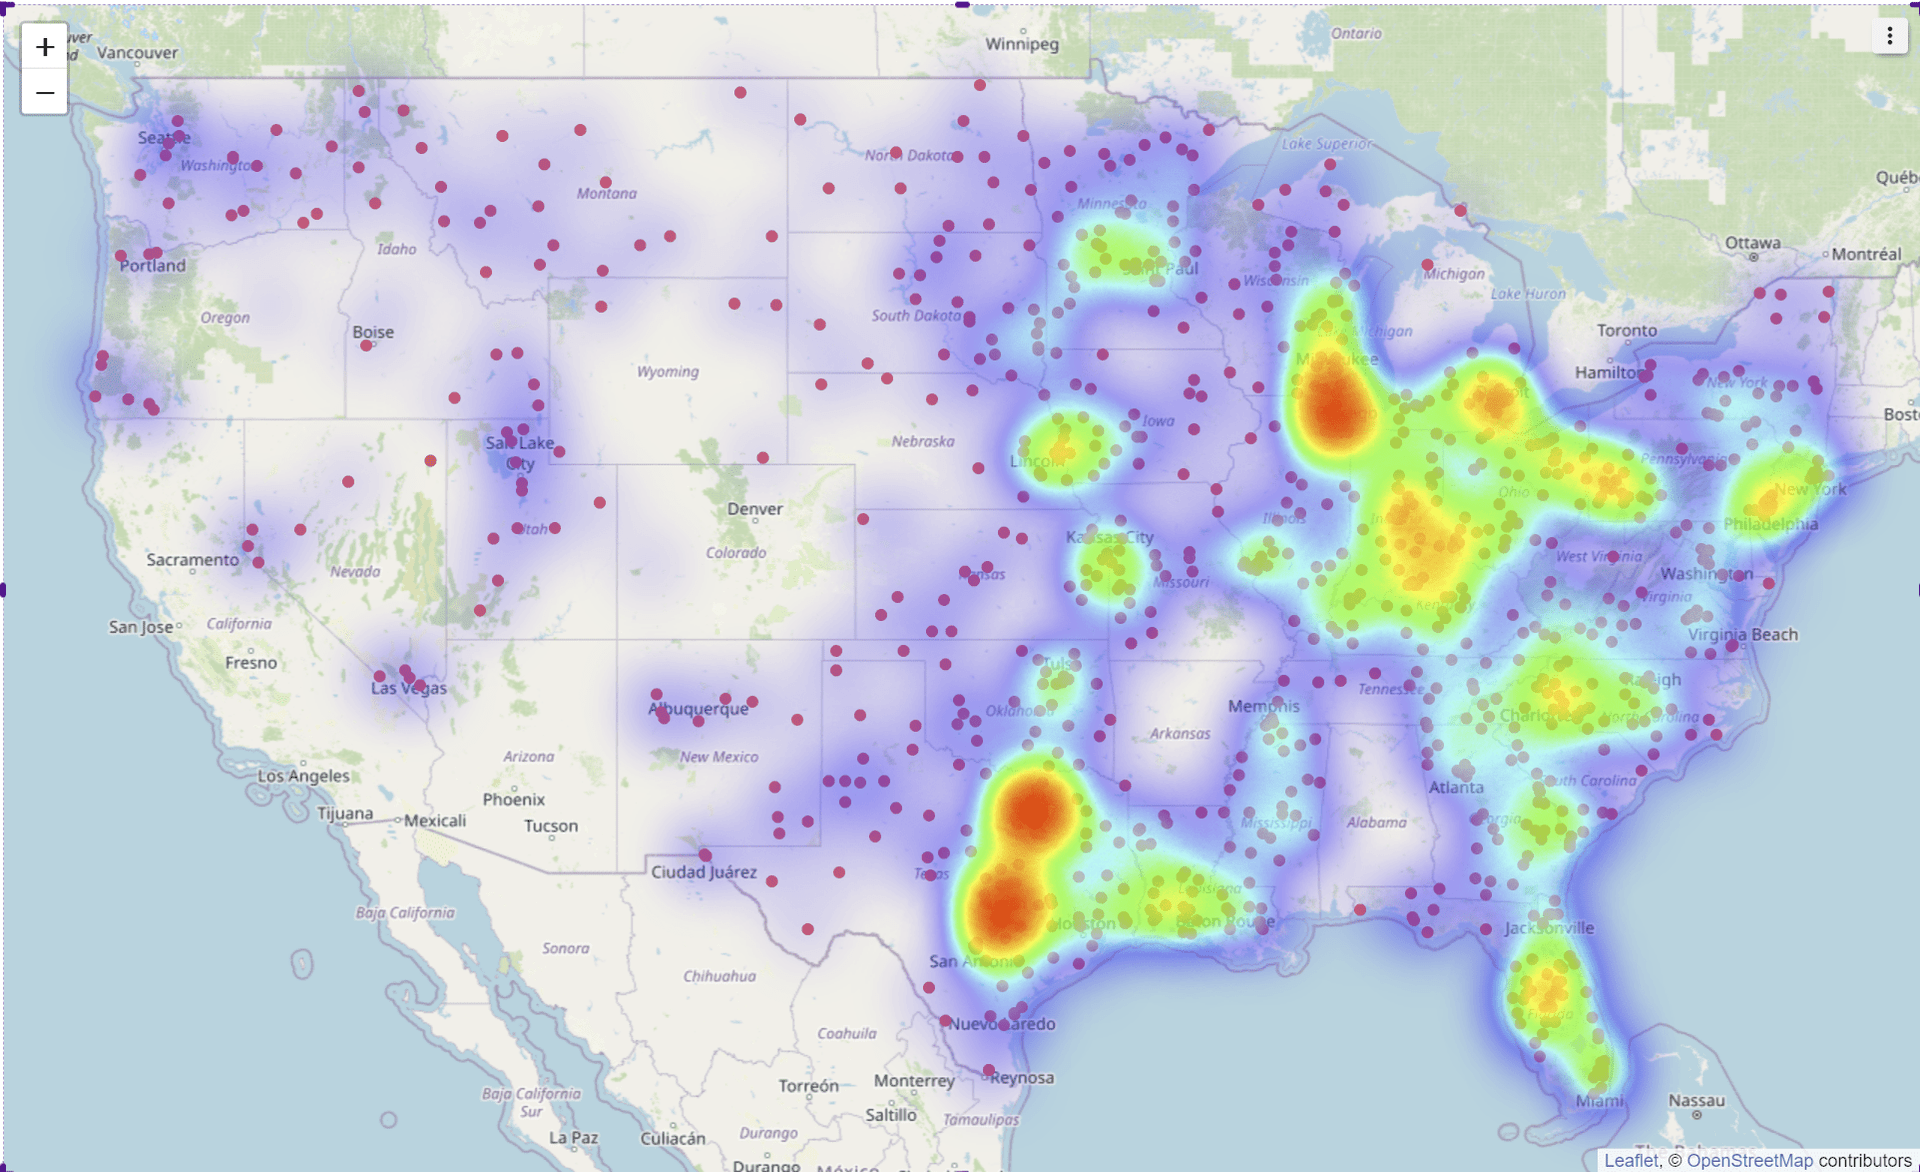
This means location-heavy datasets in ClickHouse can now be visualized and explored without extra transformations or workarounds - delivering faster insights and richer analytics.
3.15.1 - 05 August 2025
Section titled “3.15.1 - 05 August 2025”📊Bar Chart: Data Label Placement Priority
Section titled “📊Bar Chart: Data Label Placement Priority”We’ve added a new Data Label Placement Priority setting for bar charts.While data label placement is already dynamic in Astrato, this feature gives you finer control over how labels are positioned, improving chart readability.
You can now define whether labels should appear inside, outside, or on the opposite side of the bar, with a priority order for each. Astrato will follow your chosen priority while still adjusting automatically for the best fit.
🗺️New Map Layer - Support for HERE Maps provider
Section titled “🗺️New Map Layer - Support for HERE Maps provider” Astrato’s Map object has been enhanced to support HERE maps as a background map provider, in addition to our native OpenStreetMap integration.
 HERE Maps offers enterprise-grade cartography with consistent global coverage, rich location APIs, verified POI data, and advanced features like routing, traffic analytics, and indoor mapping for polished, high-value dashboards. It’s particularly relevant for location-intensive use cases like logistics & supply chain, retail network optimisation, transportation & mobility,_Using this Map type requires a_ HERE API Key and a commercial HERE license.
If you would like to learn more about the the HERE Map provider, you can check this article.
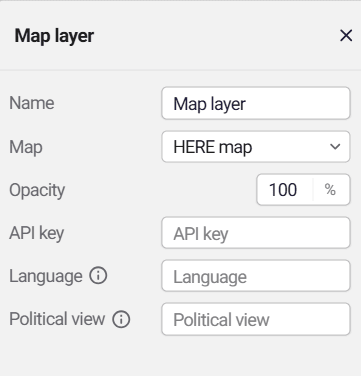
3.15 - 10 July 2025
Section titled “3.15 - 10 July 2025”⚡Actions: Show Toast Message
Section titled “⚡Actions: Show Toast Message”Use this action to display a toast message in your app when a user interacts with a component (e.g. clicks a button). Great for confirming success, providing tips, or surfacing validation errors, all without custom code.
🧠 Use cases
-
Writeback: “Please fill out all required fields”
-
Writeback: “Input successful” / “Form submitted”
-
Guidance on custom interactions: “Click the chart to drill-down”
-
Validation error: “Invalid email address”
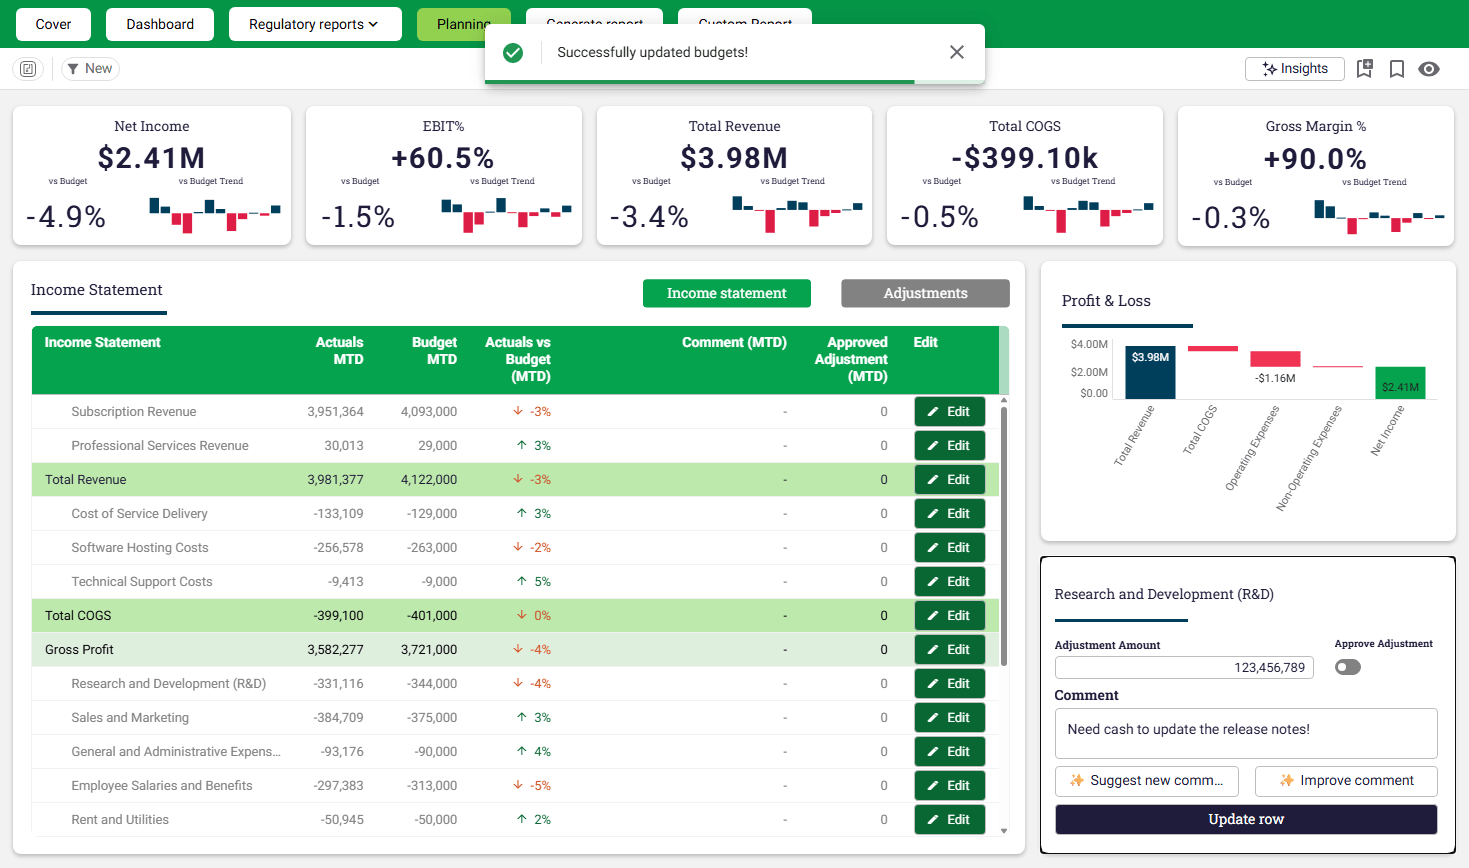
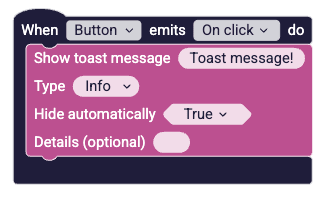

💡 Tips
-
Use short, clear language.
-
“Hide Automatically” is recommended for most info/success messages.
-
For errors, include details so users can understand what went wrong.
⚡Actions: Switch Case Block
Section titled “⚡Actions: Switch Case Block”We’ve added a new Switch block for multi-way branching logic; a cleaner alternative to long chains of if-else.
🧠 Use cases
-
Triggering different actions based on input values
-
Cleaner logic for menus, states, or modes
-
Replacing complex nested if-else trees
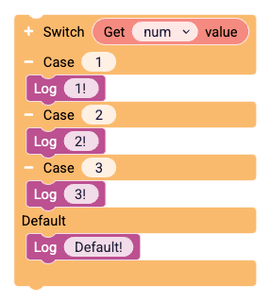
Here’s how it works:
-
It gets the value of a variable called
num. -
It then checks that value against several cases:
-
Case 1: If
numis 1, it will log (or print) “1!”. -
Case 2: If
numis 2, it will log “2!”. -
Case 3: If
numis 3, it will log “3!”.
-
-
Default: If the value of
numis not 1, 2, or 3, it will execute the default action, which is to log “Default!”.
Semantic Layer: Add user feedback, during join quality checks
Section titled “Semantic Layer: Add user feedback, during join quality checks”We’ve improved the Semantic Layer experience by adding live feedback during Join Quality Checks.
Now, users can see status updates while Astrato calculates the best join path for accurate results and fast queries.
✅ More transparency ⚙️ Smarter join suggestions 🧠 Better decision-making
Scheduled Reporting & notifcations: Extended CRON Scheduling
Section titled “Scheduled Reporting & notifcations: Extended CRON Scheduling”You can now schedule tasks to run on the last day of each month using standard cron syntax:
🗓️ 0 0 L * * → runs at midnight on the last day📆 0 0 1,15 * * → still works for 1st and 15th as before
More flexible. More powerful. Fully compliant.
3.14 - 01 July 2025
Section titled “3.14 - 01 July 2025”Export To Excel Enhancements
Section titled “Export To Excel Enhancements”Exporting data to Excel remains an effective way to share data insights with a broader audience and to save a snapshot of the data, including essential insights.
Exporting to Excel in Astrato got some significant additions:
-
Export metadata - any export includes an additional sheet with metadata about the export, providing the full query used to generate the data, as well as the user and time of the export.
Providing this information will ensure complete transparency regarding the data origins and simplify returning to the source data by running the query directly at the source. -
Pivot Table Structure - The exported pivot table retains the structure from Astrato, providing the end-user with the same information in the same perspective as it is displayed in Astrato.
ClickHouse- Dynamic Data Connection
Section titled “ClickHouse- Dynamic Data Connection”Dynamic data connections increase data security when connecting to ClickHouse. With this new option, using a single data connection, each user can connect with different credentials or access a different ClickHouse instance.
This feature will enable enforcing row-level and column-level security.
3.13 - 05 June 2025
Section titled “3.13 - 05 June 2025”Actions - Search for Actions in Use
Section titled “Actions - Search for Actions in Use”Astrato’s actions are powerful tools to build guided analytics and data apps. This new feature will enhance creator efficiency by reducing the time required to locate and modify actions used in the app.
New Variable Type Date
Section titled “New Variable Type Date”A new type of display for numeric variables and dates. The new display type will simplify creators’ work to define default values for date variables.
💡When working with actions and date variables, we recommend using the blue blocks for dates, to convert string dates, into proper date formats that are suitable for variables
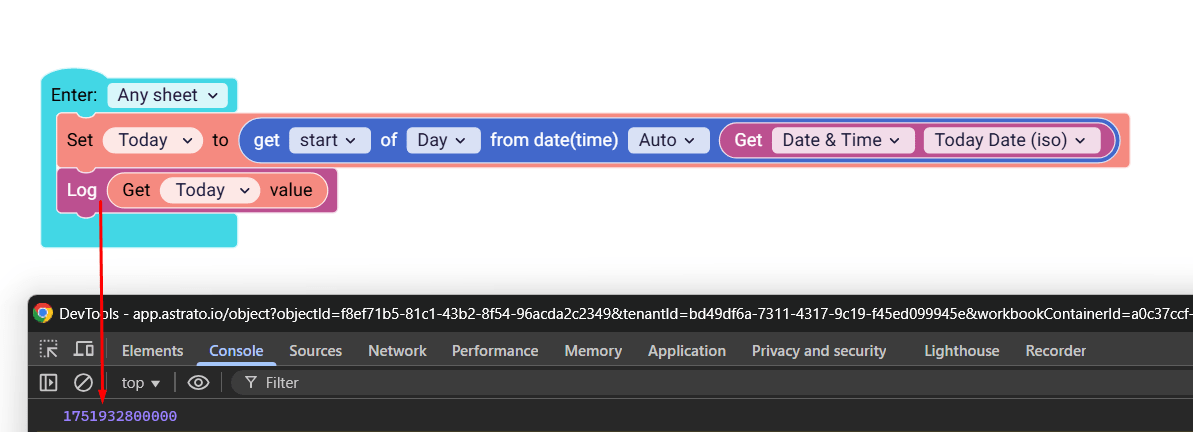
3.12 - 28 May 2025
Section titled “3.12 - 28 May 2025”Table Columns Enable\Disable - Astrato Action
Section titled “Table Columns Enable\Disable - Astrato Action”In guided analytics, it’s essential to provide end-users with the ability to drill down and up into the data. To change the point of view on the data simply and efficiently.You dynamically control which table columns are included in the underlying data query of the table with simple actions:
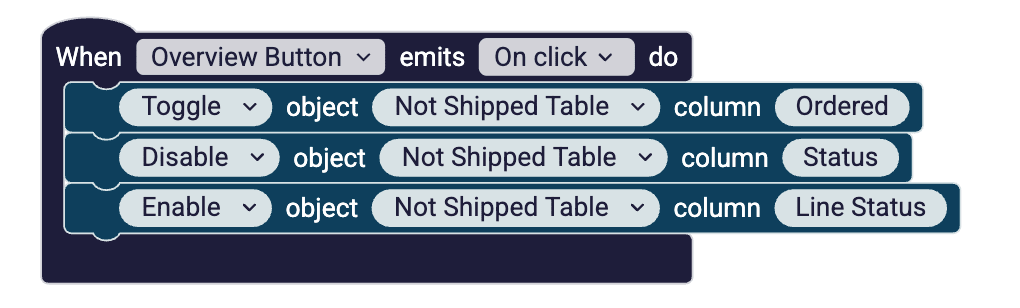
-
Toggle Column – enable/disable a column on user input (e.g. button click)
-
Disable Column – Disables a column by removing it from the underlying query.
-
Enable Column – Enables a column by adding it to the underlying query.
💡Get Creative
Combine this with the existing Get user/group block, and build personalized data-driven Data Products without coding!

Predefined Periods - Max and Min Dates
Section titled “Predefined Periods - Max and Min Dates”New options in the Date Predefined Periods filter: Min and Max Date.These new options are dynamic and take into account the start and end dates of a specific field. These options enhance users’ ability to build a dynamic comparison analysis that other users can easily use.
3.11 - 20 May 2025
Section titled “3.11 - 20 May 2025”❄️ ✨ Snowflake Cortex is Now Live in Astrato
Section titled “❄️ ✨ Snowflake Cortex is Now Live in Astrato”Astrato now supports native integration with Snowflake Cortex LLM, giving you direct access to AI-powered insights, without moving a single row of data.
And yes — we’ll be at Snowflake Summit. Come see it live.
⚡ What’s New?
With Cortex in Astrato, you get instant access to plug-and-play LLMs from leaders like Meta, Claude, DeepSeek, and Mistral. Prefer something custom? You can add your own model manually too.
But this isn’t just another chatbot UI bolted onto BI.
Astrato’s semantic layer and query engine work with Cortex to generate smart, context-aware SQL — not guesses. You don’t need to prep data, build pipelines, or handhold the model.
🔒 Why Use Cortex in Astrato?
This is the first BI & Data App platform with in-warehouse LLM control and security.
-
✅ No data movement
All your data stays in Snowflake — no syncs, no exports. -
✅ Enterprise-ready
Full RBAC via theCORTEX_USERrole. Built for scale and trust. -
✅ No-code required
Just click to generate — models understand context via Astrato’s semantic layer.
This is AI that fits your governance model, not the other way around.

Table Columns Show/Hide - Astrato Actions
Section titled “Table Columns Show/Hide - Astrato Actions”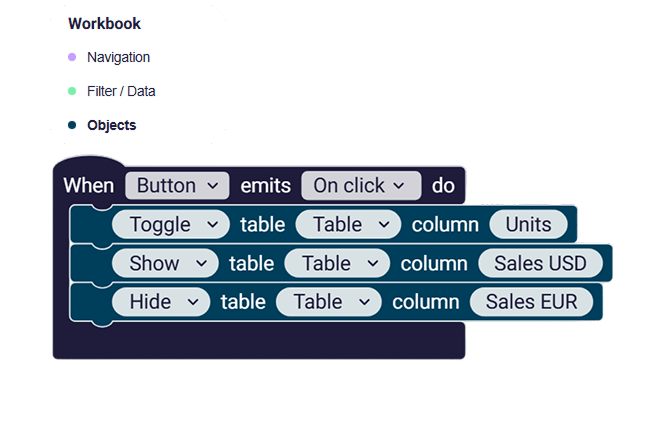
You can now dynamically control visibility of specific table columns with simple actions:
-
Toggle Column – show/hide a column on user input (e.g. button click)
-
Show Column – ensure a column is displayed
-
Hide Column – ensure a column is hidden
💡Get Creative
Combine this with the existing Get user/group block, and build personalized data-driven Data Products without coding!
Font customization - new font choice
Section titled “Font customization - new font choice”Introducing Quicksand, to our family of fonts to choose from. You can set this in your theme (which applies to all objects by default), or separately set this in text-heavy text object, table objects and wordclouds.
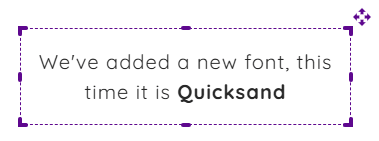
3.10 - 12 May 2025
Section titled “3.10 - 12 May 2025”Search for Objects and Variables in Action Editor
Section titled “Search for Objects and Variables in Action Editor”Action flows are an essential part of building no-code data apps in Astrato.
The new search capabilities will speed up app flows and simplify working with actions.
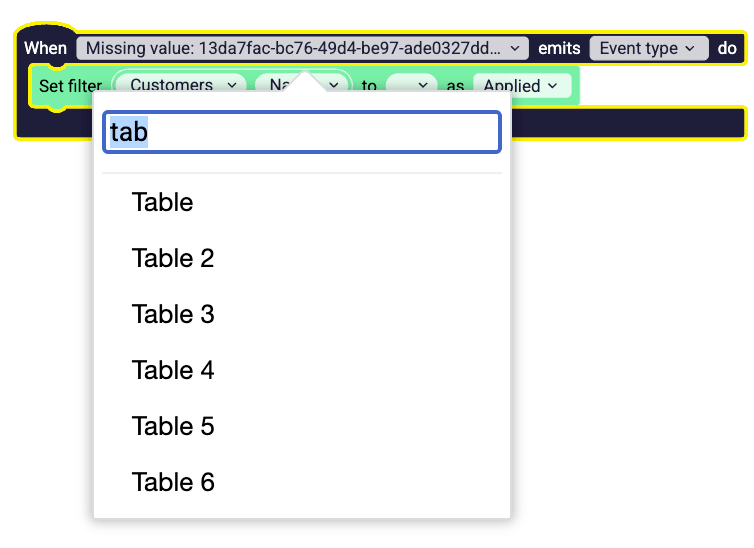
Scatter Chart Heatmap Display Mode
Section titled “Scatter Chart Heatmap Display Mode”Heatmaps help find insights in high-volume data. For example
Patterns and Trends
-
Quickly spot high and low values based on color intensity.
-
Identify clusters of similar values.
-
Observe gradual increases or decreases across axes (e.g. time, categories).
The new heatmap display mode exposes even more data insights for end-users.
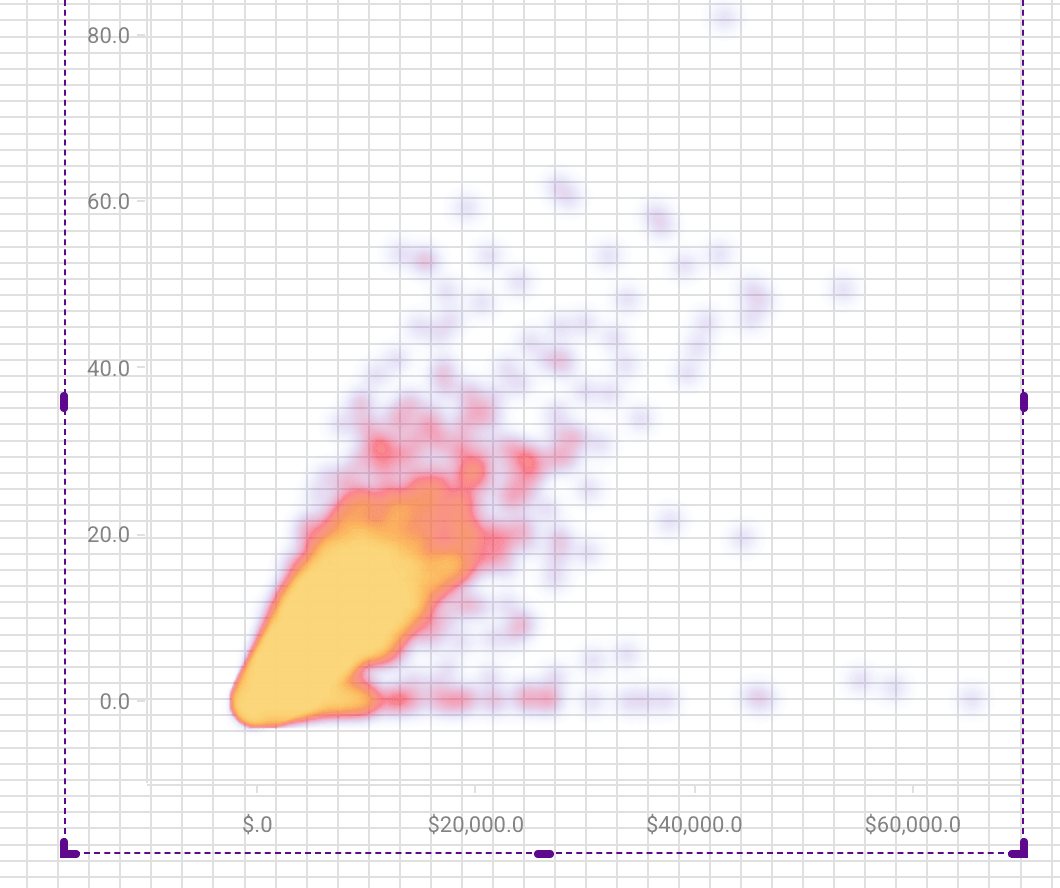
3.9 - 29 April 2025
Section titled “3.9 - 29 April 2025”Native Support for Snowflake Cortex LLM
Section titled “Native Support for Snowflake Cortex LLM”You can now connect Snowflake Cortex LLM directly to Astrato, giving users secure, in-warehouse AI capabilities with no data movement.
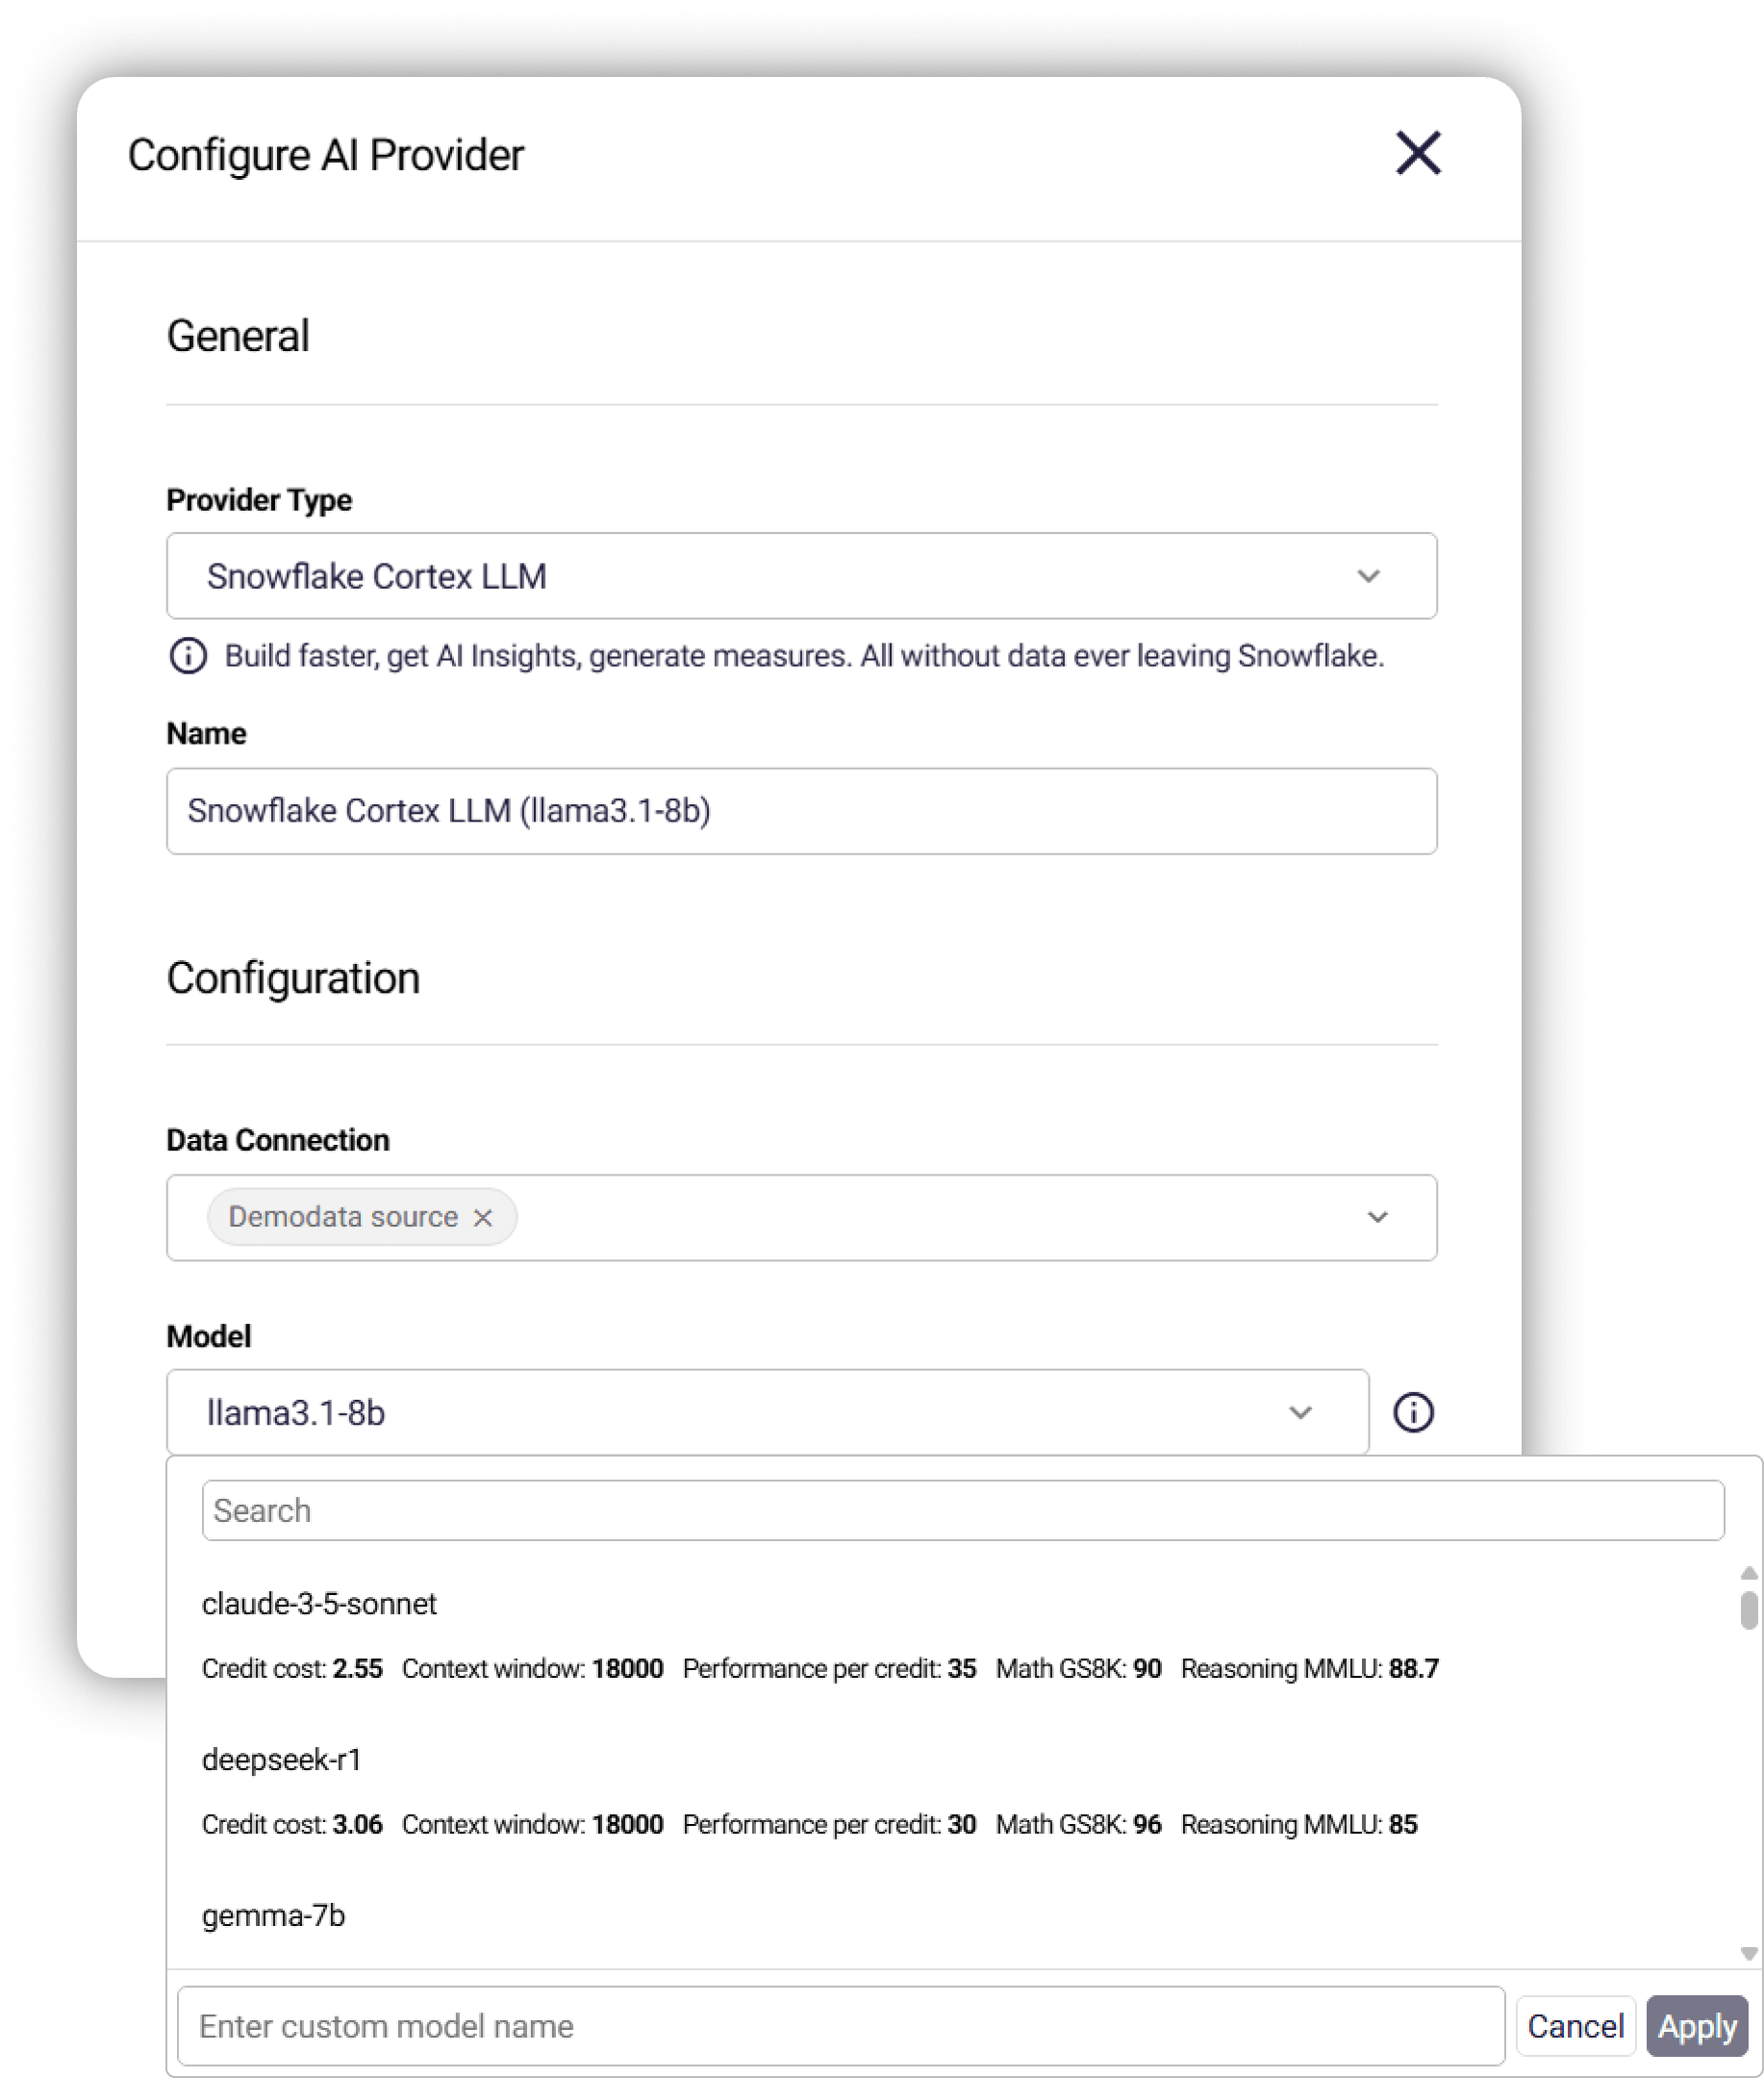
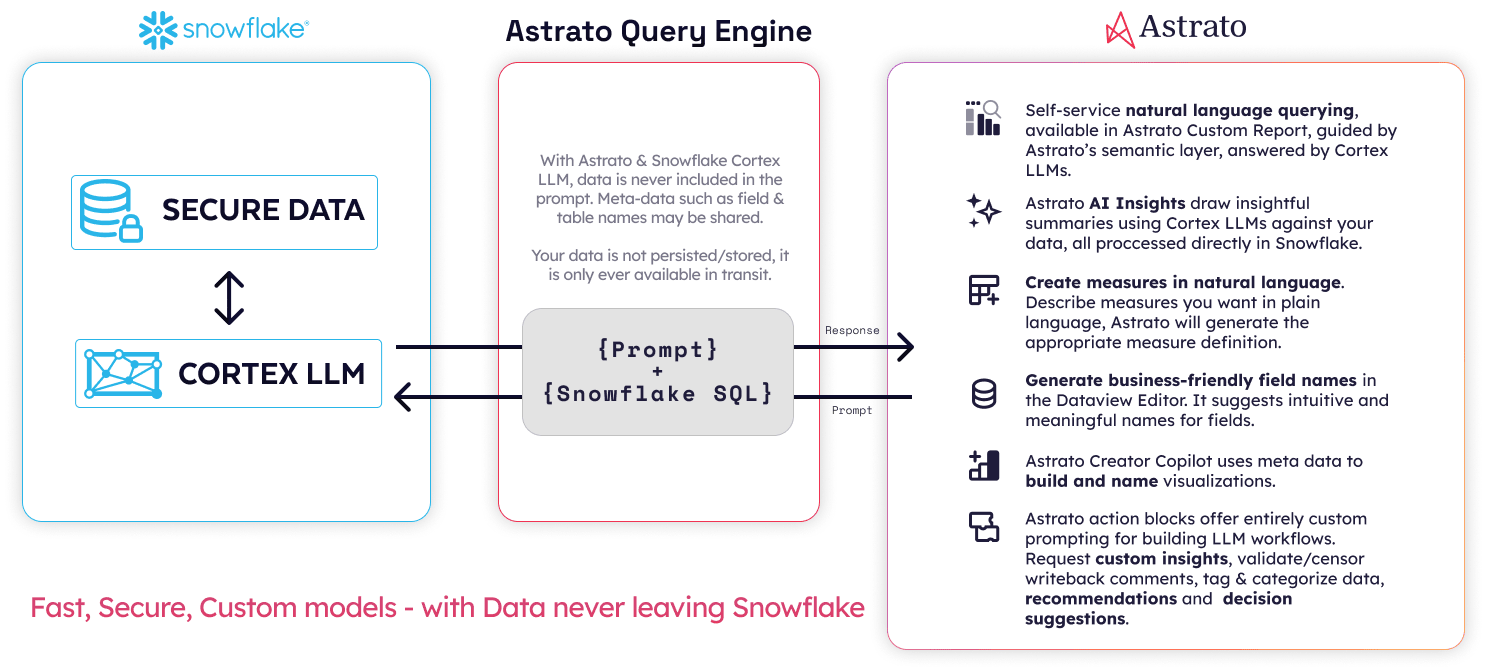
✅ What’s New
Section titled “✅ What’s New”-
Plug-and-play integration with Snowflake Cortex
-
Support for leading models like:
-
llama3.1-8b -
claude-3-5-sonnet -
deepseek-r1
-
-
Context-rich model metadata: performance per credit, math reasoning scores, and more
-
Custom model support via manual entry
🔐 Enterprise Grade Security
Section titled “🔐 Enterprise Grade Security”-
Full RBAC alignment using Snowflake’s
CORTEX_USERrole -
Cross-region AI access supported
-
Keeps data within your Snowflake account at all times
💡 Why it matters
Section titled “💡 Why it matters”Business users now get faster insights, smart measure suggestions, and context-aware generation, all from live data. No prep, no pipelines, just results.
Heatmap Visualization Enhancements
Section titled “Heatmap Visualization Enhancements”The new features in the heatmap visualization enable better display and explanation of heatmaps, which can tell a more compelling story and reveal additional insights.
The new features include:
-
Option to place the X-axis labels on top.
-
Better sorting that maintains individual axes sorting.
-
Null values styling.
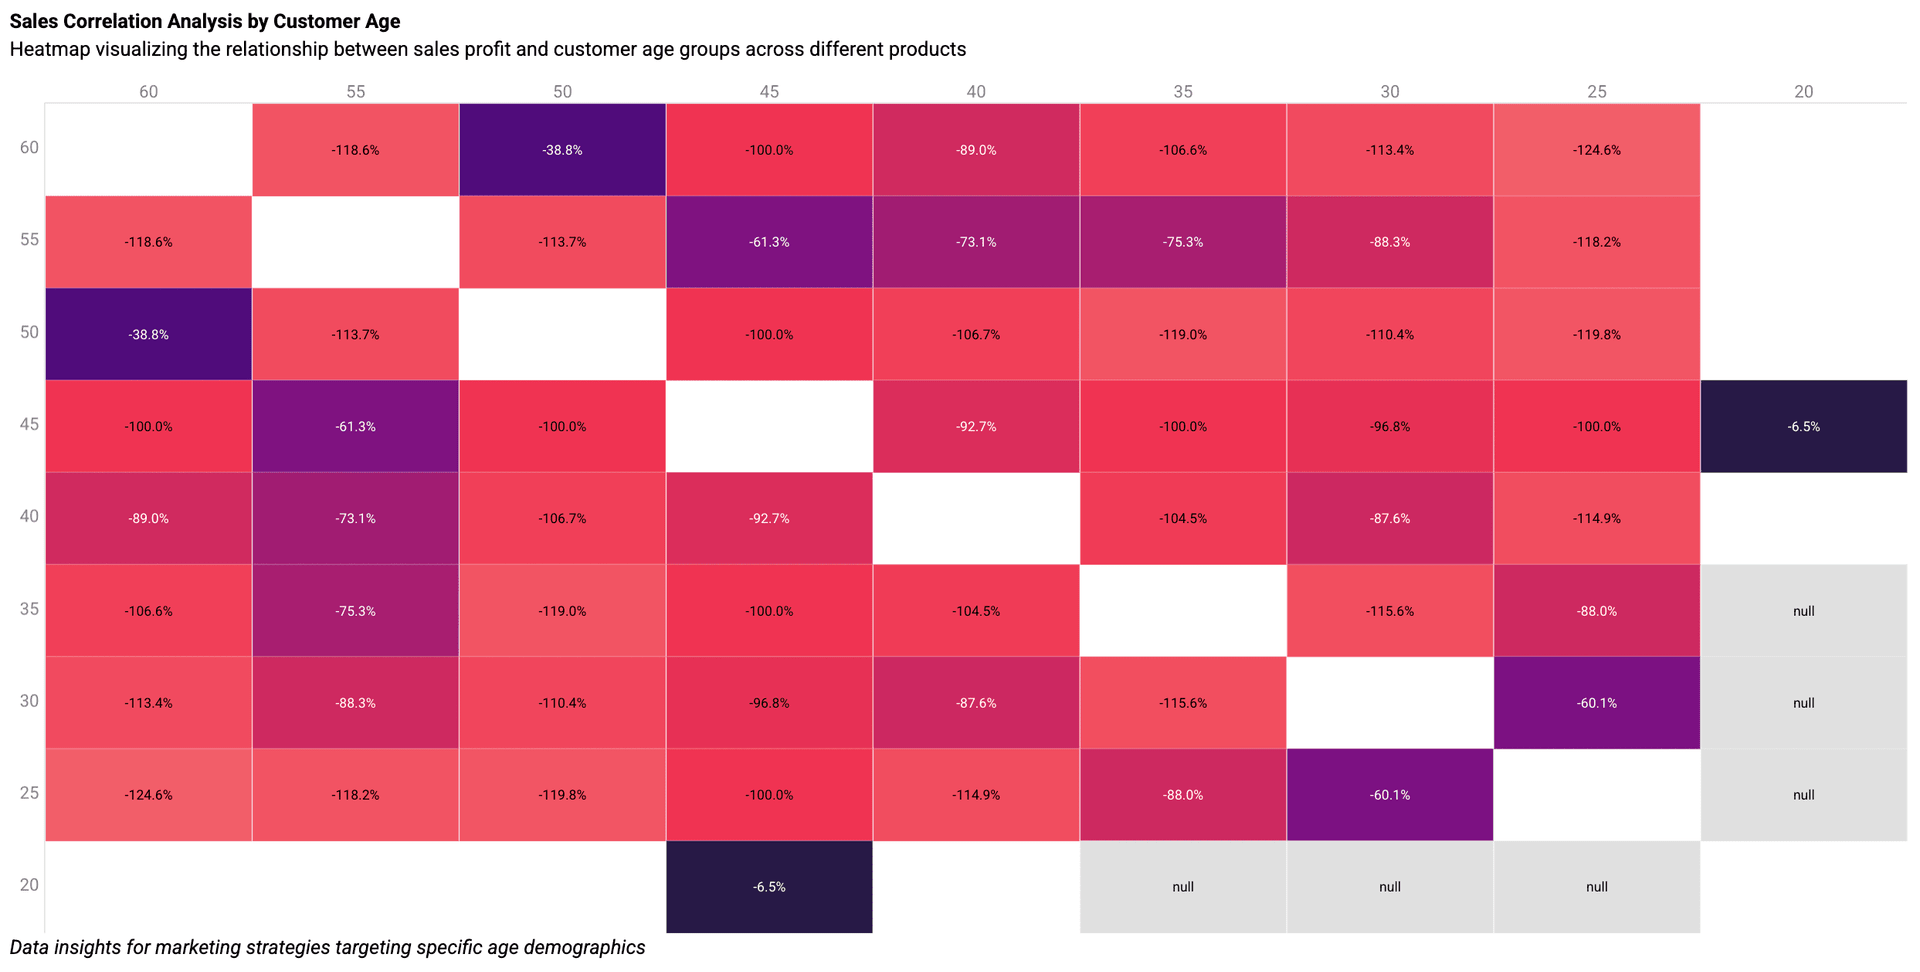
Absolute Function Support
Section titled “Absolute Function Support”The absolute function can be applied to measures. Some use cases where the absolute result is usefulCalculating variances or differences
-
Handling outliers or error values
- If you’re flagging data quality issues, you may want to calculate the absolute difference between a value and its target and check if it exceeds a specified threshold.
-
Aggregating values where negative signs are irrelevant
- For example, if you’re summing transaction amounts but only care about total volume, not direction (sales vs returns).
-
For distance or deviation calculations
- In statistical contexts, such as calculating Mean Absolute Deviation (MAD) or Mean Absolute Error (MAE).
-
Simplifying visuals
- If you’re displaying error bars, deltas, or deviations on a chart and don’t want negative numbers cluttering the interpretation
3.7 - 10 April 2025
Section titled “3.7 - 10 April 2025”[Private Preview] Writeback Update Action
Section titled “[Private Preview] Writeback Update Action”A new option to update existing records in tables using the writeback action. These new options simplify several use cases:
-
What if scenarios- users can easily make small changes to scenarios
-
Forecast updates- users can update forecast numbers on the fly.
With these new options, Astrato data apps are more powerful and open more options to act on data insights in a streamlined manner.
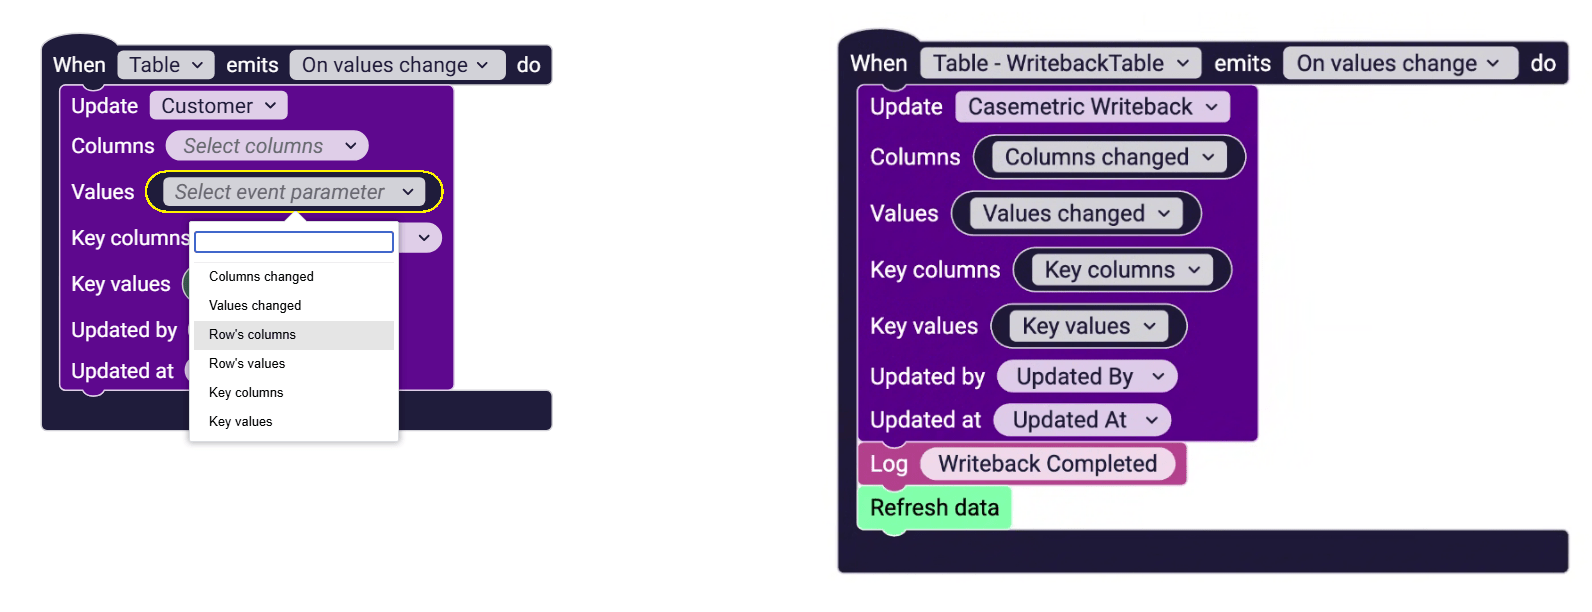
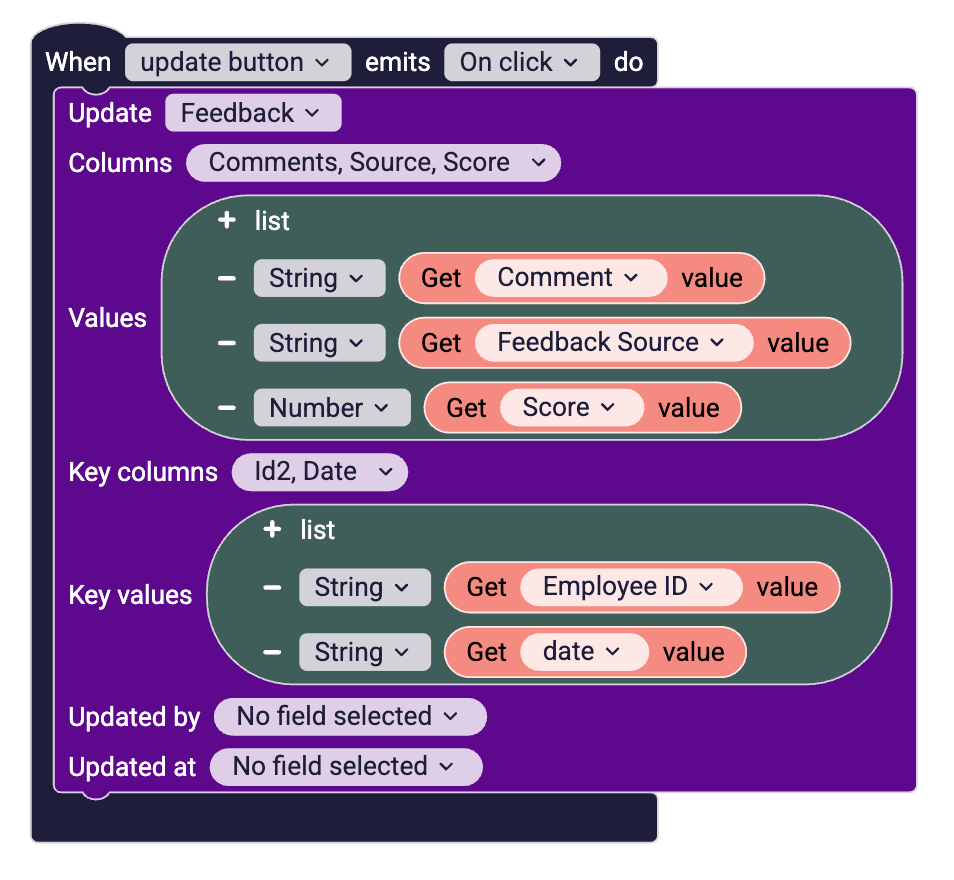
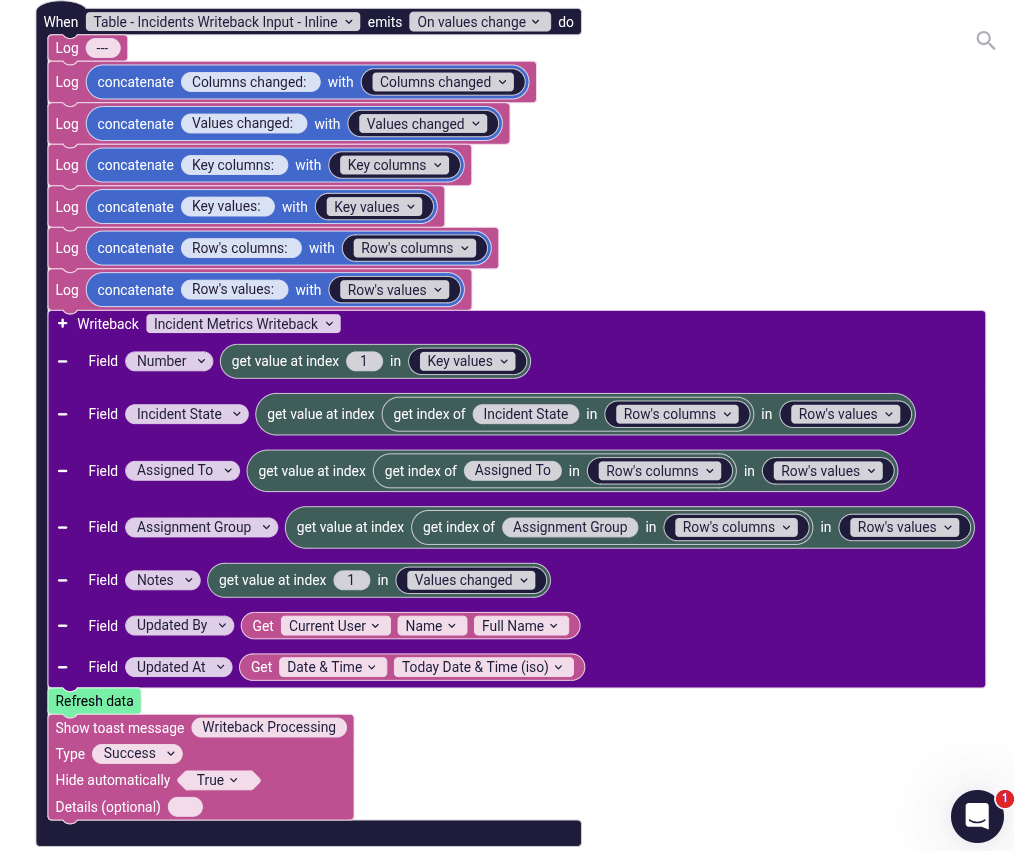
If you’d like to join the private preview, you can contact our support.
Advanced Calculation Correlation
Section titled “Advanced Calculation Correlation”A correlation matrix is a powerful data analytics tool that summarizes relationships between multiple variables. It displays the pairwise correlation coefficients (typically Pearson) between variables in a grid format. Here’s a breakdown of the insights you can gain and everyday use cases:
🔍 Insights from a Correlation Matrix
Section titled “🔍 Insights from a Correlation Matrix”-
Identify Strong Relationships
-
High positive correlation (close to +1): Variables increase together.
-
High negative correlation (close to -1): One increases while the other decreases.
-
Near-zero correlation (around 0): Little to no linear relationship.
-
-
Detect Multicollinearity
- When two or more variables are highly correlated (e.g., >0.8 or <-0.8), it can cause problems in regression models by inflating variance.
-
Feature Selection
- You can remove redundant features that are highly correlated with each other, reducing dimensionality without losing much information.
-
Hypothesis Generation
- Spot interesting variable relationships that warrant deeper investigation.
-
Data Quality Checks
- Unexpected correlations may reveal issues (e.g., data leakage, incorrect encodings).
📊 Common Use Cases in Data Analytics
Section titled “📊 Common Use Cases in Data Analytics”-
Exploratory Data Analysis (EDA)
- Quickly understand how variables relate to each other before diving into modeling.
-
Financial Analysis
- Correlate stock returns, macroeconomic indicators, or portfolio assets.
-
Marketing Analytics
- Correlate customer behaviors, preferences, or demographic features.
-
Healthcare & Bioinformatics
- Analyze relationships between biological markers, symptoms, or patient data.
-
Sensor or Time-Series Data
- Detect correlated patterns across multiple sensors or time-series variables.
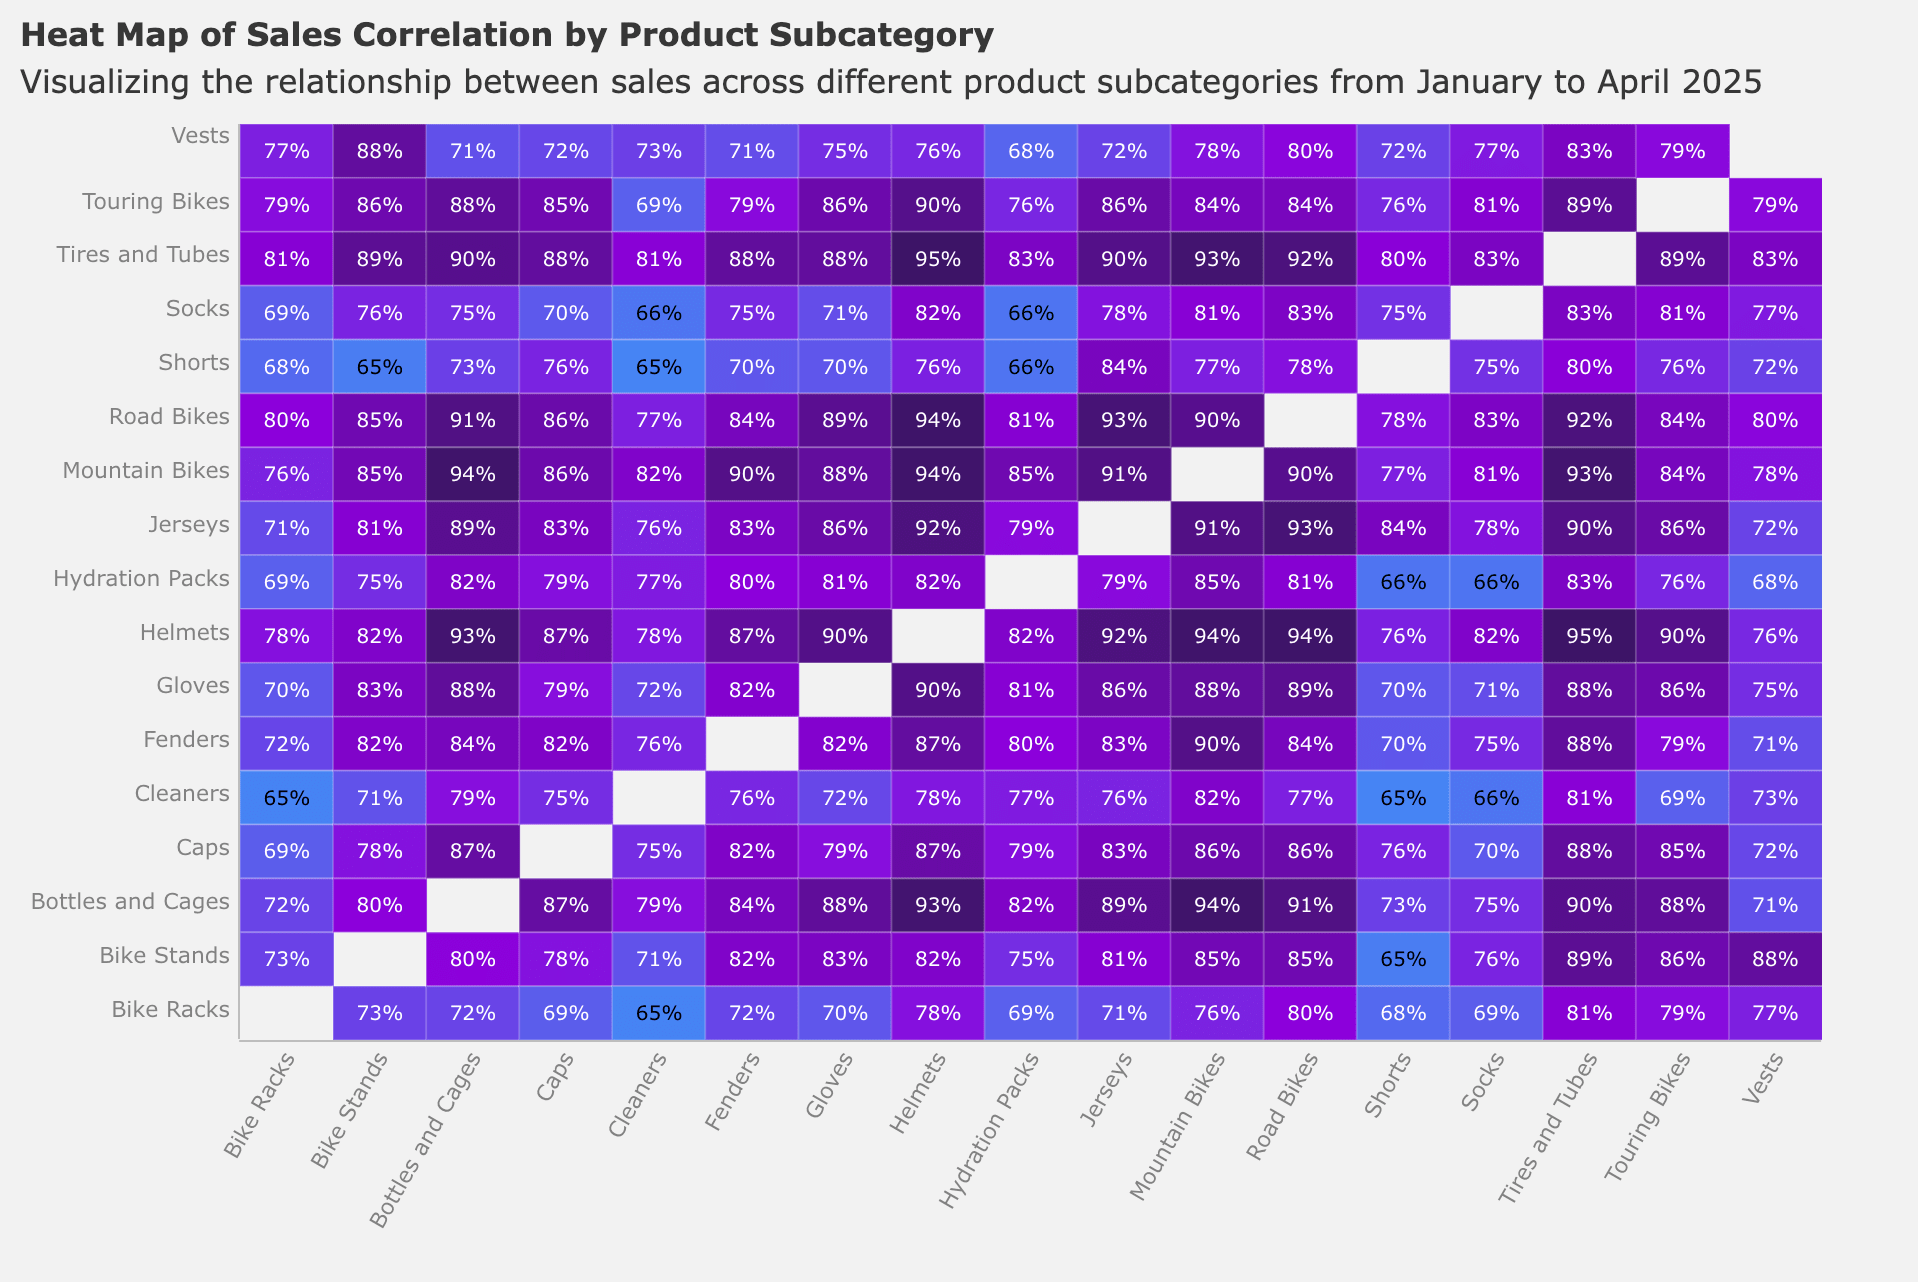
3.6.1 - 07 April 2025
Section titled “3.6.1 - 07 April 2025”Date Picker- Atomic Input Form
Section titled “Date Picker- Atomic Input Form”A new type of atomic input is from a date picker. This new form simplifies assigning date values to variables; several use cases became more straightforward with this new option.
-
Assigning values to variables for period-over-period analysis.
-
Writeback actions with date input.
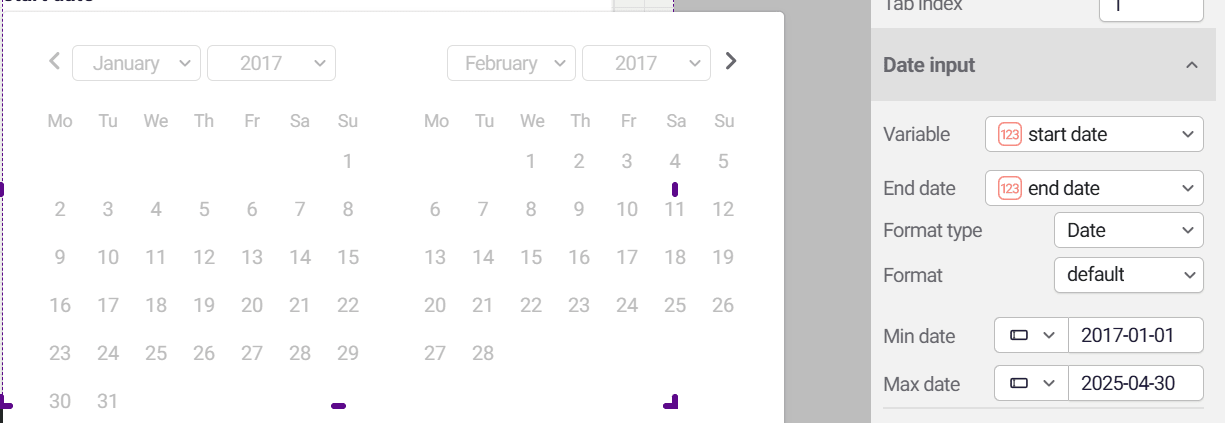
Table Cells Actions
Section titled “Table Cells Actions”Call on actions when clicking or hovering over a table cell. With these new options, hovering or clicking on a cell can trigger any set of actions. Use cases supported by this feature:
-
Show a custom tooltip when hovering over a table.
-
Writeback a cell or row values when clicking on a cell
-
Navigate to the detailed view.
3.6 - 03 April 2025
Section titled “3.6 - 03 April 2025”Improved AI Providers’ Management
Section titled “Improved AI Providers’ Management”AI features are a core component in Astrato’s self-service offering, enabling natural language measure creation and data analysis.
Using the right AI model and prompts for your organization is the best way to get the most out of AI Features. The new management screen simplifies Admins and creators’ ability to define and maintain the right AI provider.
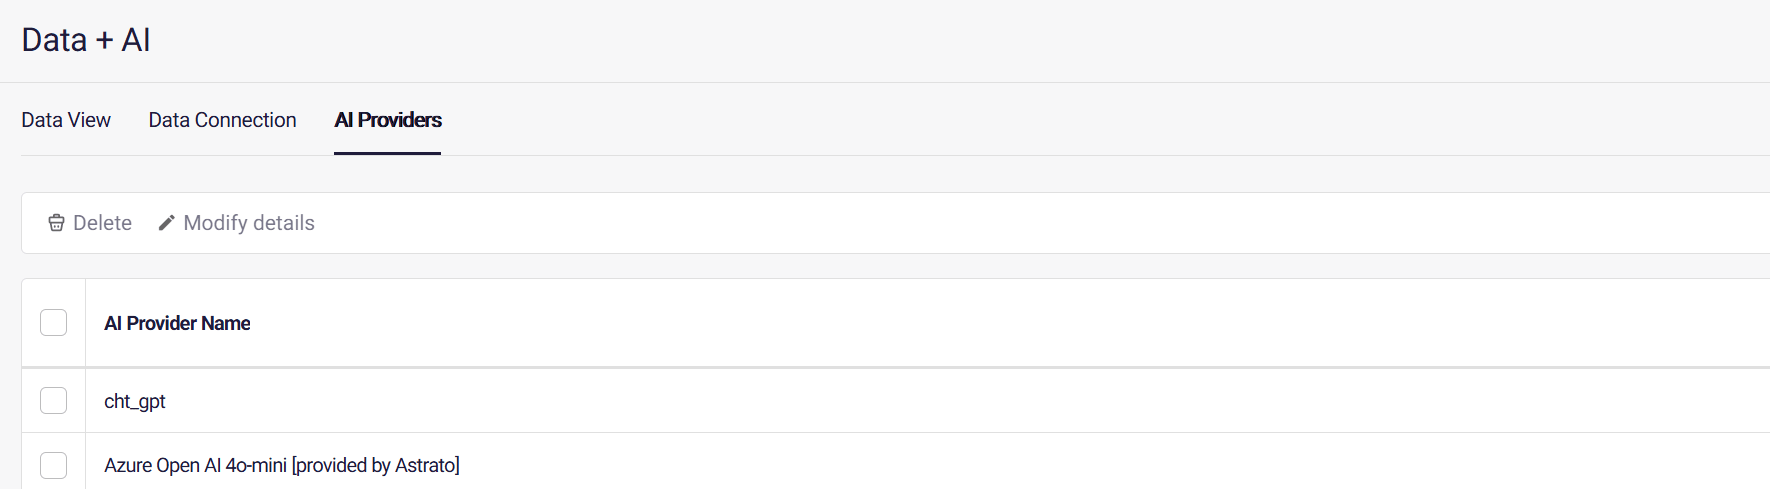
Improved Published Workbook Metadata
Section titled “Improved Published Workbook Metadata”When hovering over the published tag of a workbook tile, it shows all the workbook collections.
3.5.1 - 25 March 2025
Section titled “3.5.1 - 25 March 2025”Drill-Through Dimension in a Table Dimension
Section titled “Drill-Through Dimension in a Table Dimension”Drilling through data is essential to any analytics process that looks for the root causes in data insights.
Tables are another essential part of displaying detailed data for users.Combining drill-through with a table enhances self-service analytics; it provides end-users with a simple and powerful tool to find data insights.
Send Schedule Reports To External Emails
Section titled “Send Schedule Reports To External Emails”Schedule reports can be distributed to any email address, including external addresses outside the user’s organization.
3.5 - 20 March 2025
Section titled “3.5 - 20 March 2025”Natural Language Measure Generation (AI-assisted) - Public Preview
Section titled “Natural Language Measure Generation (AI-assisted) - Public Preview”Self-Service Analytics is about simplifying the data journey from source to insight. This new capability will allow more users to generate a measure by describing the measure in natural language. Speed up and simplify measure generation. Describe the measure and get a suggested result; measure generation includes checks and warnings to ensure the measure’s validity.Easily reuse previous prompts or previously generated measures for small changes.
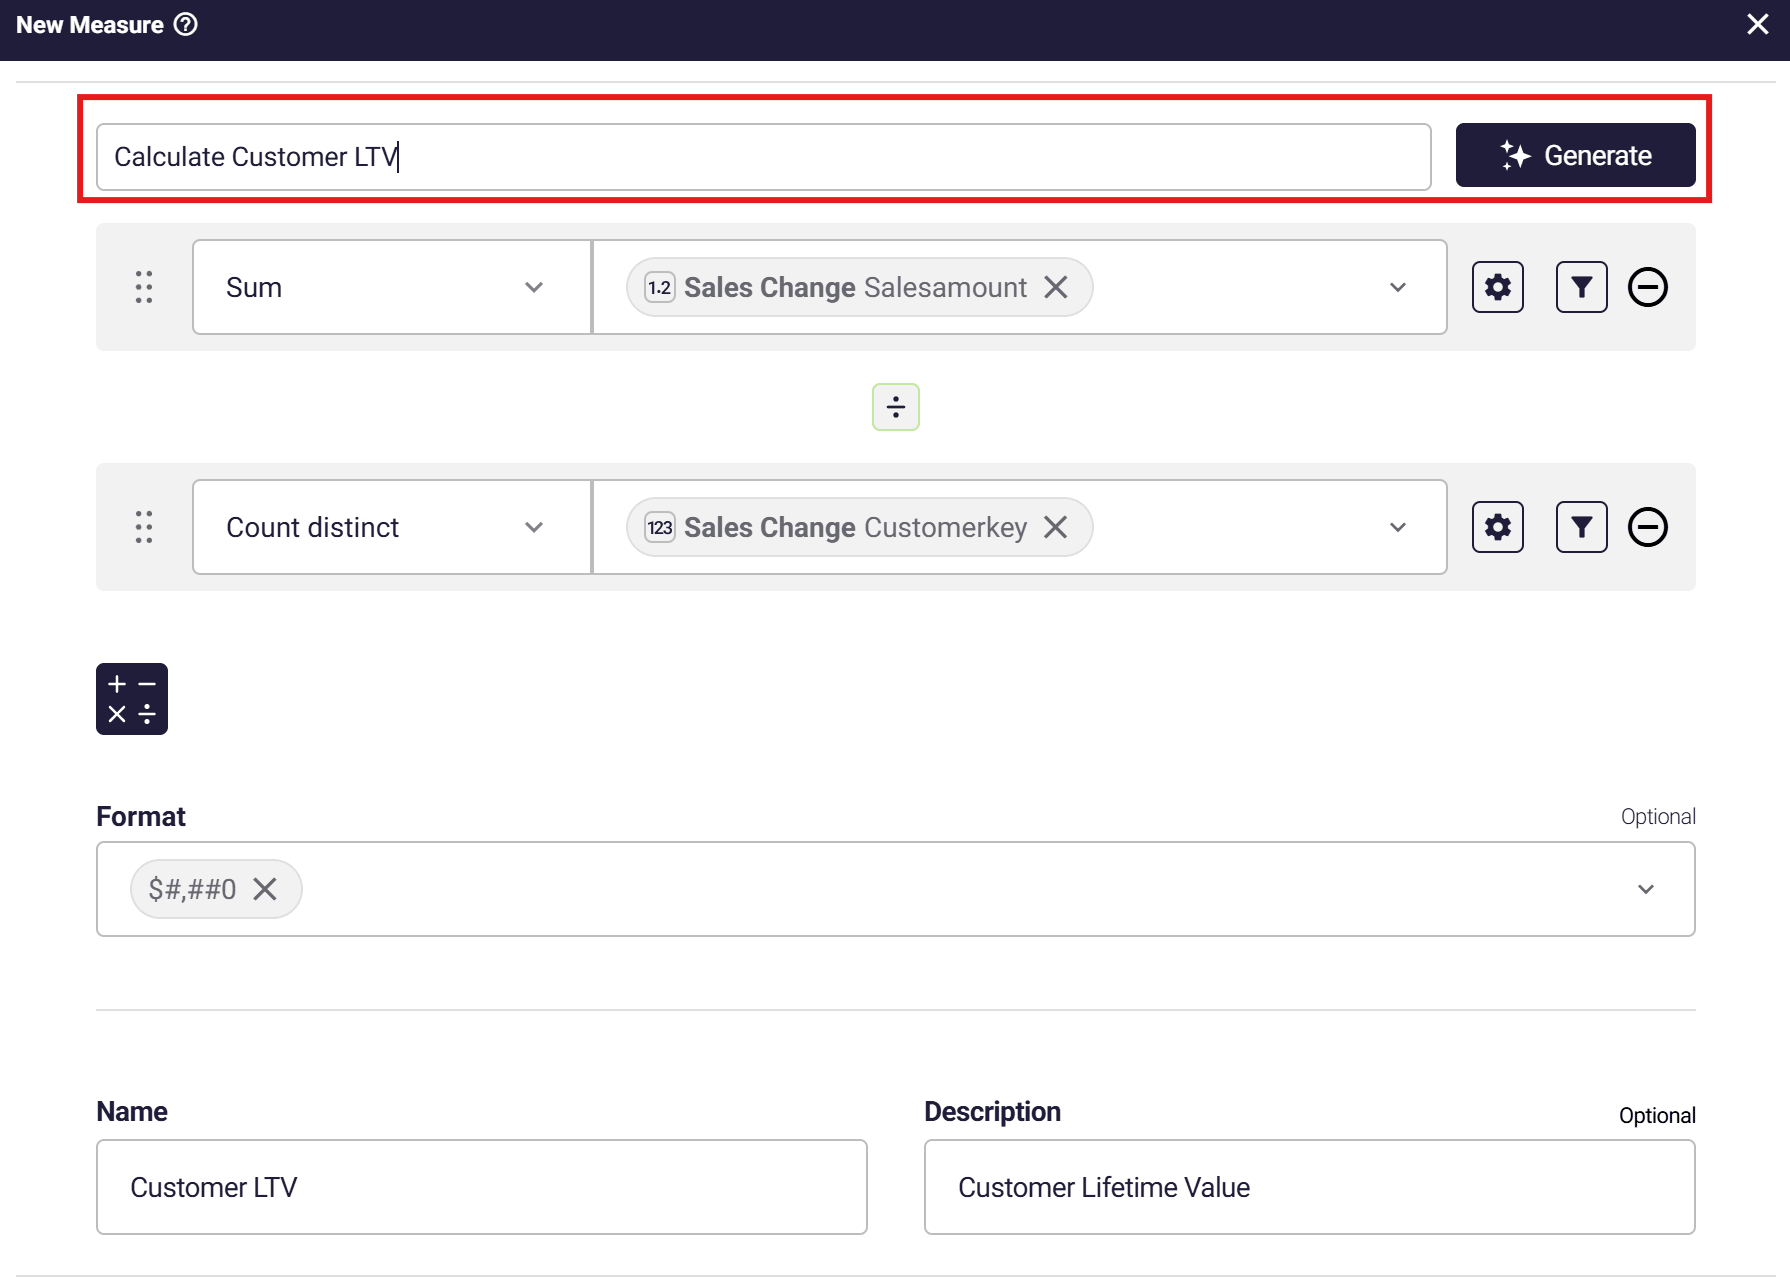
Pivot Table Selections
Section titled “Pivot Table Selections”A pivot table is one of the most potent tools end-users have to analyze by slicing and dicing the data from different angles.
The new selections allow users to quickly drill down and drill through data.
Selections can be made in one or more dimensions or in a cell, selecting all dimensions that intersect in the cell.
AI Custom Prompts in Insights describe
Section titled “AI Custom Prompts in Insights describe”With the new AI providers, you can now provide custom prompts for the Insights Describe object. Prompts can be entered manually in the property panel or dynamically generated using variables, allowing Astrato actions to adapt based on user interactions.
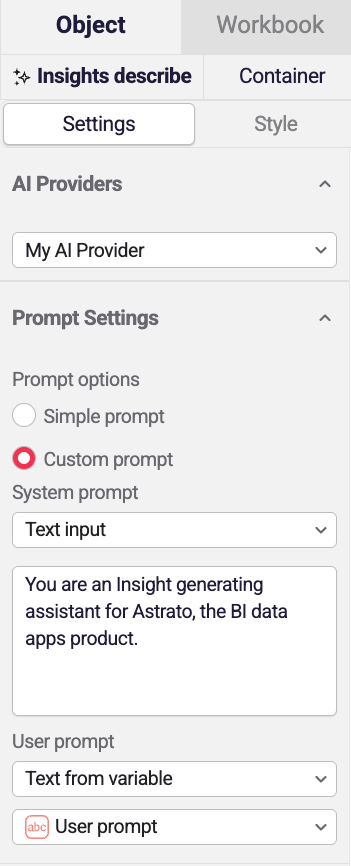
AI Actions
Section titled “AI Actions”New actions to use AI to generate insights from a selected chart or responses from a generic prompt. Combining these actions with existing capabilities helps build tailor-made AI interactions for users.
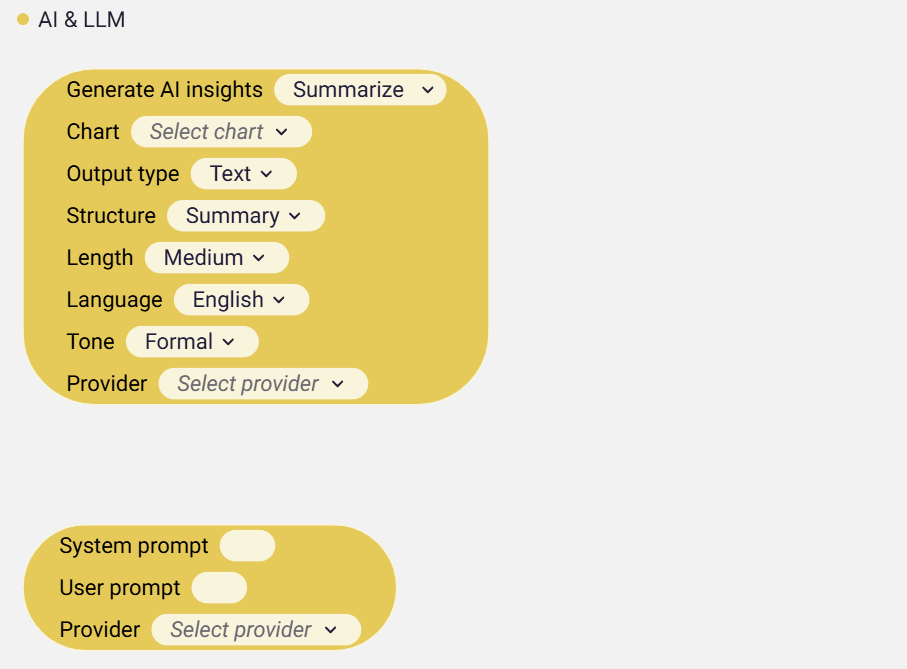
Actions Improved Help
Section titled “Actions Improved Help”Actions are powerful tools when building data apps; the improvement helps describe the action block when hovering over it. This helps lower the level of expertise needed to use this powerful tool.
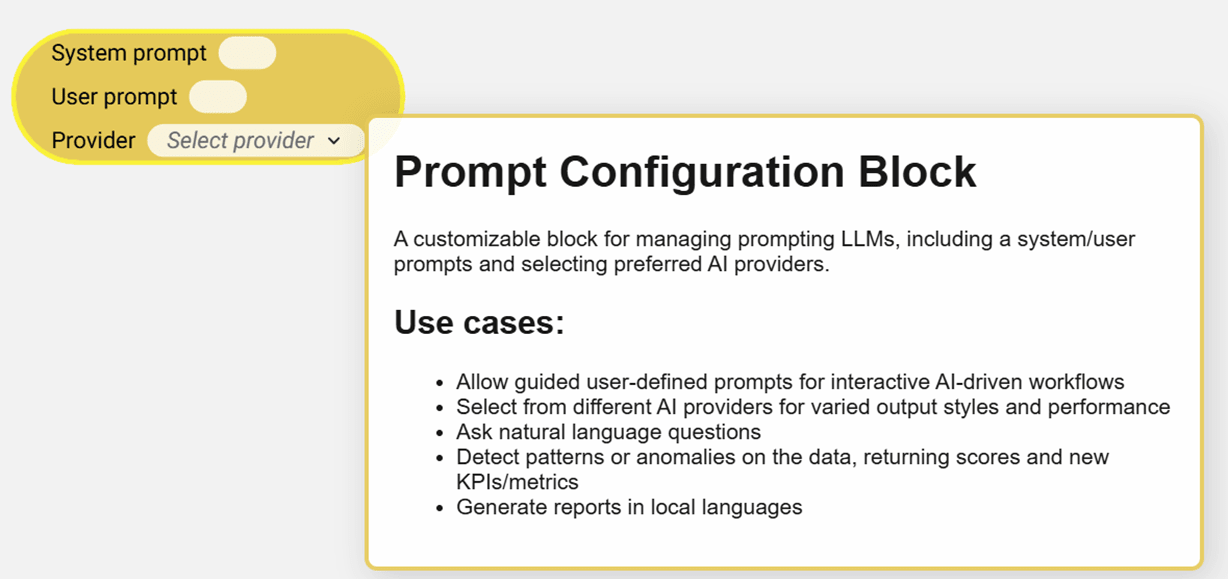
3.4 - 04 March 2025
Section titled “3.4 - 04 March 2025”🆕 Map Layer - Flow
Section titled “🆕 Map Layer - Flow”This map layer is powerful for showing movement patterns, relationships, and connections between geographic locations. Here are some common use cases and data insights that can be derived from such visualizations:
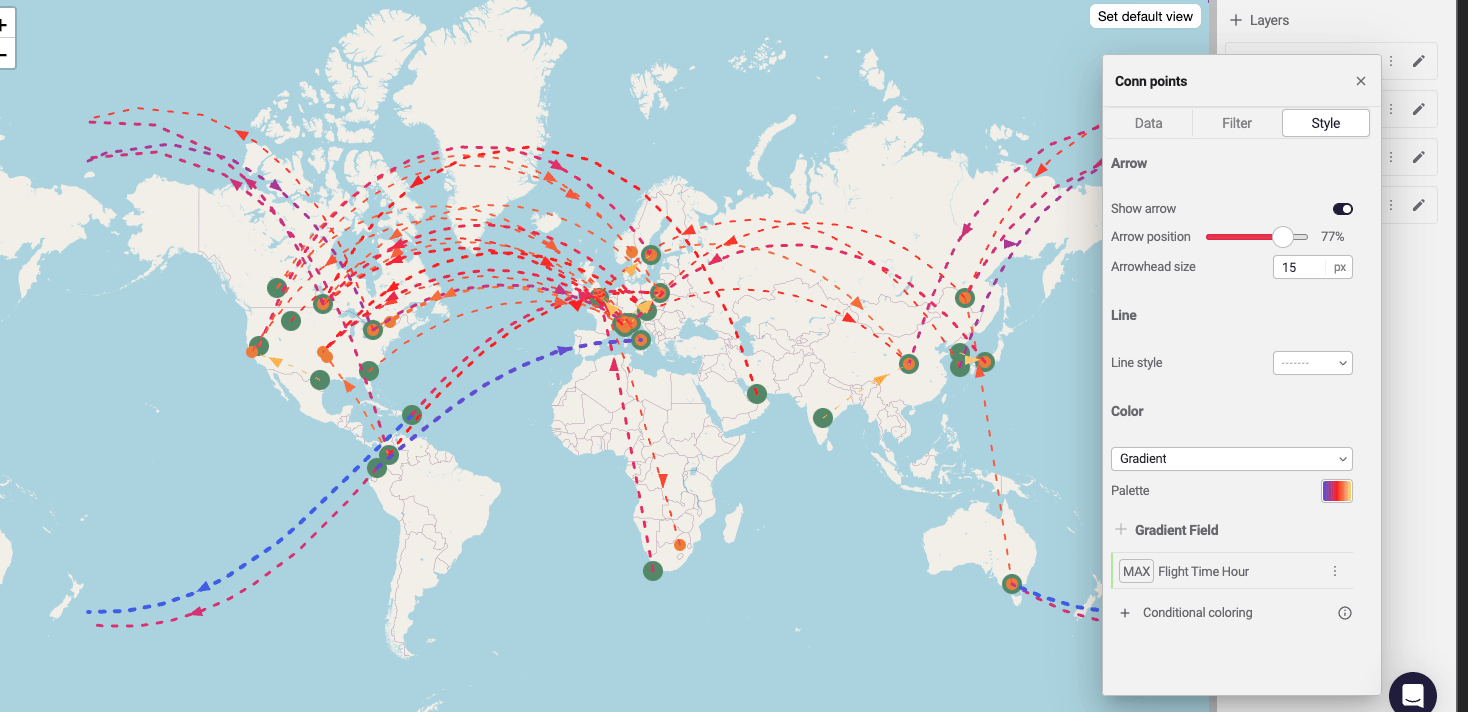
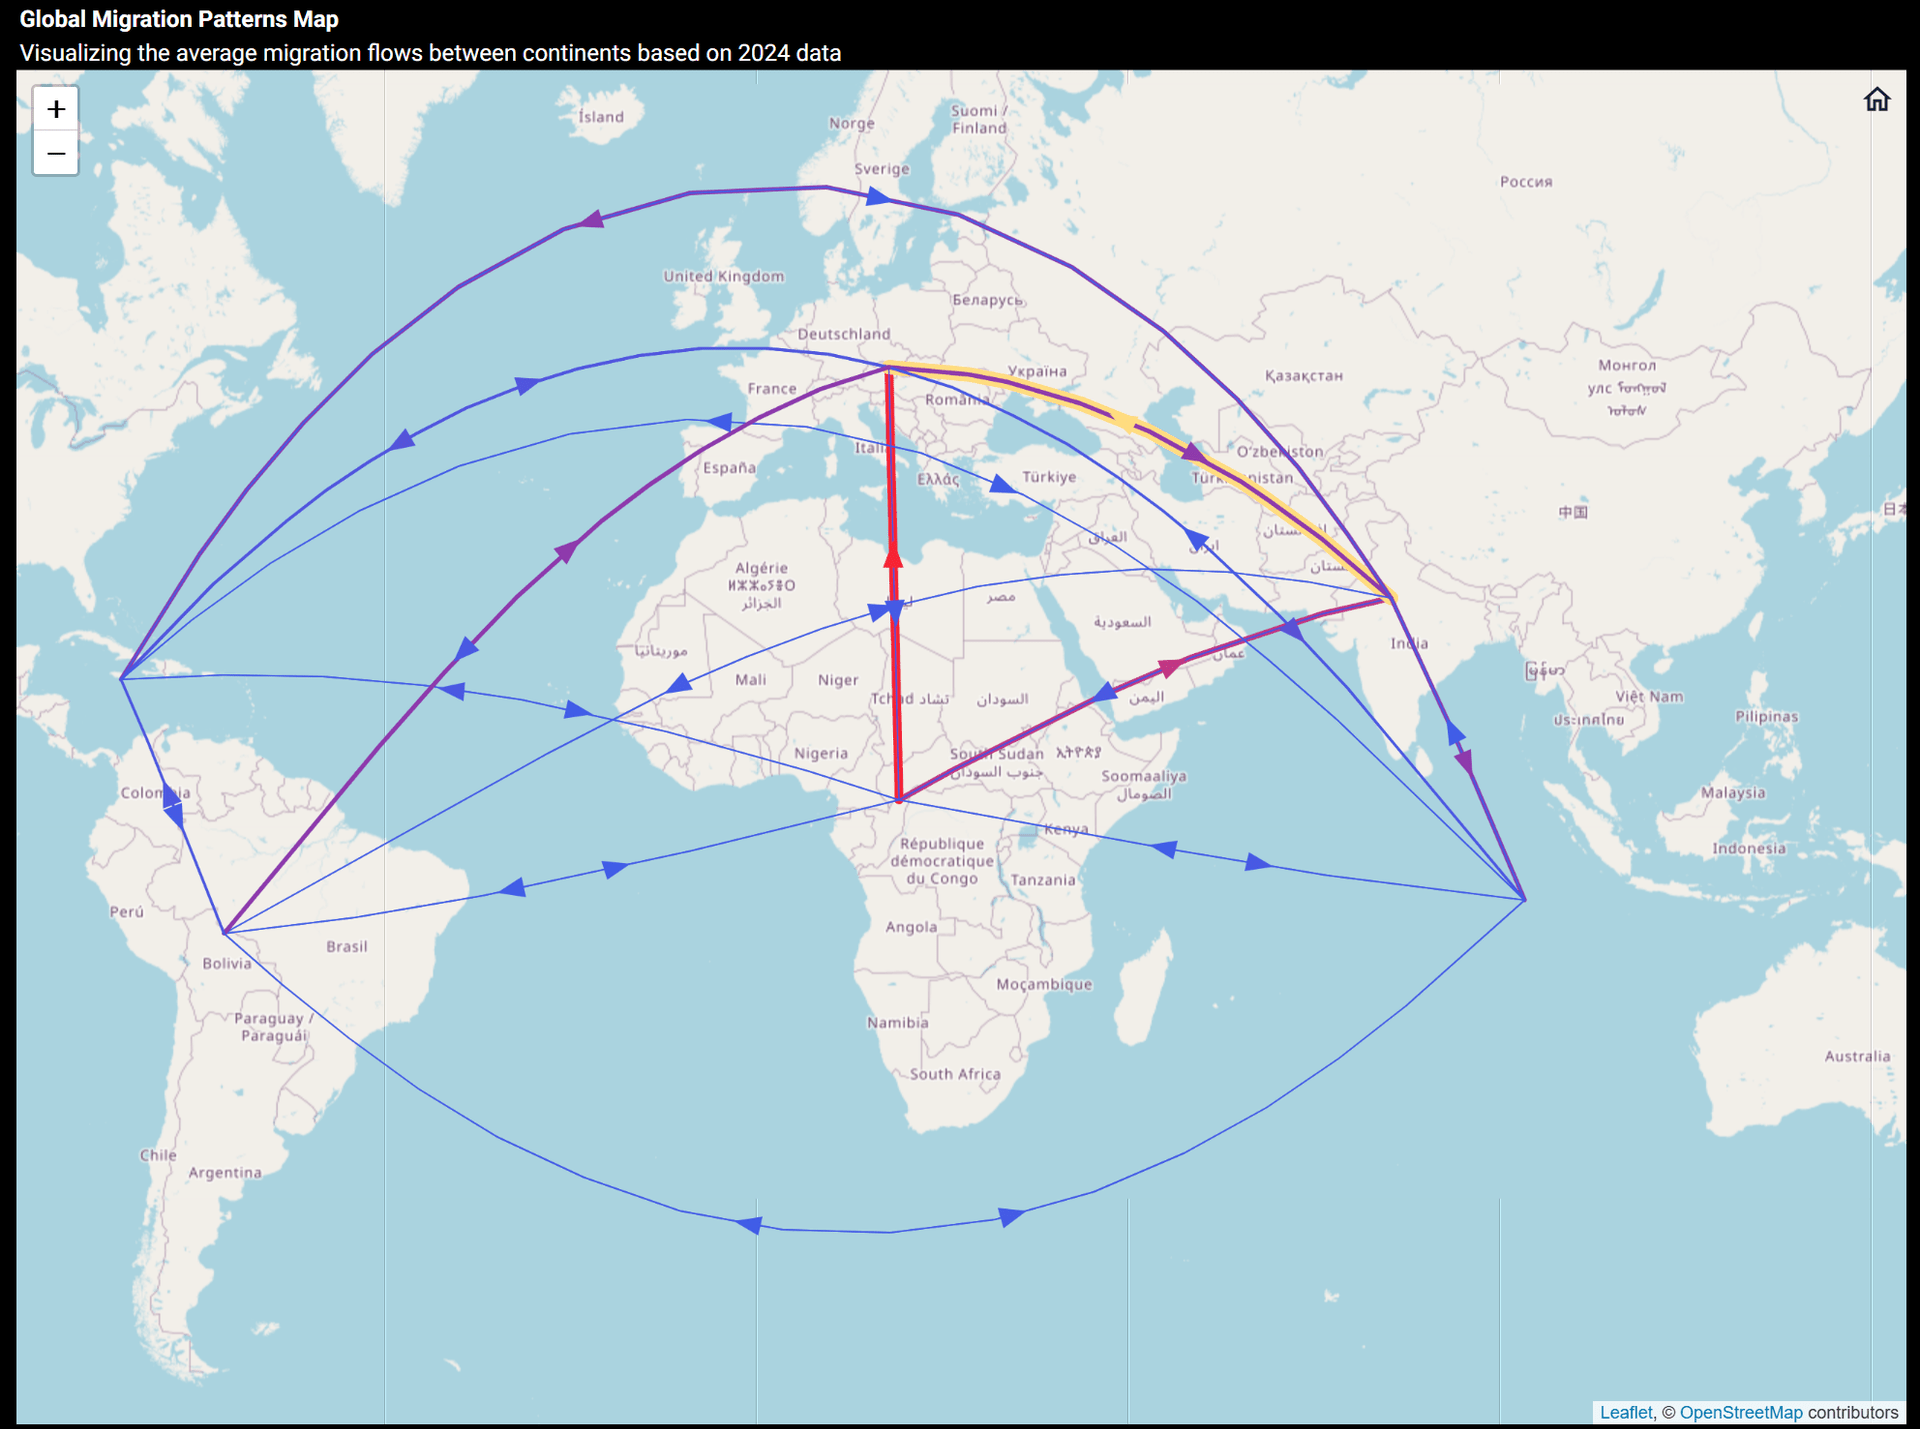
Transportation and Logistics
Section titled “Transportation and Logistics”-
Flight route analysis: Airlines can visualize their network to identify high-traffic corridors, optimize route planning, and find underserved markets.
-
Shipping patterns: Cargo companies can track the flow of goods between ports or distribution centers, identifying key shipping lanes and bottlenecks.
-
Public transit planning: Transit authorities can map commuter flows to understand demand and optimize service frequency.
Migration and Population Movement
Section titled “Migration and Population Movement”-
International migration: Researchers can visualize immigration and emigration patterns between countries over time.
-
Internal migration: Governments can track population movement between states or regions to better plan for infrastructure needs.
-
Refugee displacement: Humanitarian organizations can map refugee movements to coordinate aid efforts.
Business and Economic Analysis
Section titled “Business and Economic Analysis”-
Supply chain visualization: Companies can map their supply networks from raw materials to manufacturing to distribution.
-
Market expansion: Businesses can identify where customers are coming from to target new market opportunities.
-
Regional economic interdependence: Economists can visualize trade flows between regions to understand economic relationships.
Communications and Network Analysis
Section titled “Communications and Network Analysis”-
Internet traffic: Network engineers can map data flows between servers and data centers.
-
Telecommunications: Phone companies can visualize call patterns between cities to optimize network capacity.
-
Social network connections: Researchers can map relationships between communities or groups.
🆕 New Fonts in visualizations & themes
Section titled “🆕 New Fonts in visualizations & themes”New fonts are available in Astrato objects. Themes support thew newly added fonts, making it easy to update your fonts in one go.
|  |
***If the new fonts are not yet loaded, please conduct a hard refresh.***To hard refresh in Google Chrome on a Windows computer, you can press Ctrl + F5 or hold down Ctrl and click the Reload button. On a Mac, you can press Cmd + Shift + R.
3.3 - 25 February 2025
Section titled “3.3 - 25 February 2025”Excel Template Reporting
Section titled “Excel Template Reporting”
Astrato transforms Excel reporting with its live query capabilities, enabling seamless collaboration on financial data. Our BI tool streamlines workflows, allowing users to make real-time adjustments, add commentary, and easily manage approvals. Once finalized, reports can be exported to Excel, complete with the latest data and professionally formatted, all powered by Astrato’s continuous live data connections.
Import our new Excel demo workbook to your tenant by clicking on this button below.
Note for BETA users: The Import data and Get Export data from object blocks have been updated for better performance, date handling, and now respecting the column order of tables. If you used the beta version of Excel template reporting, the beta blocks have been deprecated and need to be updated to take advantage of the new improvements.
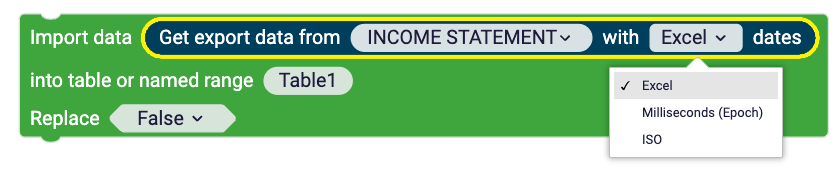
BETA Notifications and alerting
Section titled “BETA Notifications and alerting”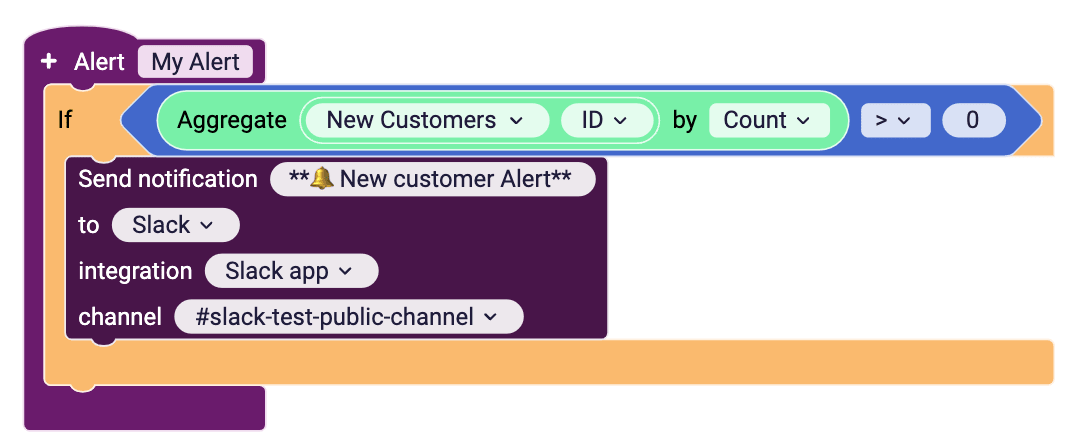
We are excited to introduce our new Notifications and Alerting feature, currently available in beta. This innovative feature enables you to conditionally trigger notifications for key events, such as new customer sign-ups or when specific thresholds are exceeded.

This beta version is being offered to a select group of customers for initial feedback and testing. If you are interested in participating and exploring the capabilities of our new alerting functionality, please contact our team or your dedicated customer representative to activate it on your tenant.
Leverage Notifications and Alerting to stay informed and responsive to critical business activities.
-
To participate in the BETA program, reach out to Astrato support.
Section titled “To participate in the BETA program, reach out to Astrato support.”
3.2 - 04 February 2025
Section titled “3.2 - 04 February 2025”Associative Filters
Section titled “Associative Filters”Associative filters allow users to ask new and more advanced business questions that use the association between different entities in the data.Here are some examples of business questions:
-
Find the customers who bought Product A and not Product B
-
Find products that were sold this month in store A or sold last month in store B
-
Find employees who know how to code both in Python and SQL
When an associative filter is applied, the user can still see all the information about the filtered population, unlike regular filters that reduce the information to the specific question asked.
Associative filters allow users to ask advanced business questions intuitively.
Users can easily edit the filter and save them for repeated usage.
3.1 - 21 January 2025
Section titled “3.1 - 21 January 2025”Stacked Bar Chart Data Label
Section titled “Stacked Bar Chart Data Label”A stacked bar chart can highlight multiple layers of insights. Comparison between the total height of each stacked bar
Comparison of the bar inside each bar and the overall stacked bar height share.
For example, what was the revenue each quarter splitter by customer type?This chart shows the overall revenue trend and the significance of each customer type in each quarter. It also tracks changes in the different types’ significance over time.
The new settings allow users to define which information will be presented on the bars. There are three options:
-
Value- show the bar value
-
Share- show the bar share out of the total stacked bar value
-
Combined- show both value and share.
3.01 - 15 January 2025
Section titled “3.01 - 15 January 2025”AI Insights Improved Display
Section titled “AI Insights Improved Display”AI insights are now easier to read and finding insight. AI insights help users find insights in a dashboard or specific visualization.
Vertical Display For Gauge Chart
Section titled “Vertical Display For Gauge Chart”Gauge Charts are good when comparing performance against targets for multiple entities.
With the new display, more intuitive gauge charts can be created.
3.0 - 09 January 2025
Section titled “3.0 - 09 January 2025”🆕Workbook Development Life-Cycle (Workbook Versions)
Section titled “🆕Workbook Development Life-Cycle (Workbook Versions)”Workbook development reimagined with the introduction of workbook versions, The creators work is simplified and improved. Here are the key benefits of the Workbook Life-Cycle (Versioning) feature:
-
Effortless Version Logging: Easily log and describe each version for clear documentation.

-
Quick Recovery: Restore previous versions to mitigate disruptions from errors.

-
Flexible Publishing: Unpublish and republish workbooks with different versions for better control.

-
Version Consolidation: Unified view of drafts and published versions to reduce clutter.

-
Enhanced Collaboration: Merge drafts and manage versions across workbooks for effective teamwork.

-
Rollback for Safety: Revert to earlier published versions for stability and data integrity.

-
Streamlined Migration: Simplified transition to the new versioning system.
Advanced Chart Calculation- Percentile
Section titled “Advanced Chart Calculation- Percentile”The percentile function is a valuable tool in data analytics, providing a deeper understanding of data distribution and supporting robust decision-making. Here are the primary benefits of using it:
Improving Decision-Making
Percentiles help organizations make informed decisions, such as identifying top-performing regions, products, or services, by providing a clearer view of data characteristics.
Example Application
If you’re analyzing employees’ salaries in a company:
The 10th percentile might represent the lower earners.
The 90th percentile could represent top earners.
This information could be used to evaluate pay equity or design compensation policies.
Other benefits of using percentile in the analysis are:
-
Understanding Data Distribution
The percentile function helps divide data into 100 equal parts, offering insight into how data points are spread across a range. For instance, the 25th, 50th, and 75th percentiles (quartiles) show the spread of the dataset’s lower, middle, and upper sections. -
Identifying Outliers
Percentiles are crucial for detecting outByning by analyzing data points below the 1st or above the 99th per, analysts can flag anomalies needing special attention or cleaningcentile. -
Comparing Relative Performance
Percentiles allow comparison of a value’s position relative to the dataset. For example, a student’s score in the 90th percentile means they performed better than 90% of their peers.
The percentile function is essential for summarizing, interpreting, and applying data insights effectively.
The percentile function is available in these advanced calculations:
-
Total- calculate the selected percentile of the dataset
-
Compare to total- compare entity values to the chosen population percentile value
-
Nested calculation- calculate the selected percentile value for a defined dataset.
Big Data Analysis - Extend Queries Runtime
Section titled “Big Data Analysis - Extend Queries Runtime”This is a new option for extending the running time of queries, which is essential for data analysts and report creators working with large datasets. The new options allow users to extend the queries running time to handle long-running queries.
Improved table Filtering
Section titled “Improved table Filtering”Users can filter table dimensions by using range selections for numbers and dates. The new option to apply range filtering directly in the table enhances the simplicity of asking business questions in Astrato.
2.892 - 17 December 2024
Section titled “2.892 - 17 December 2024”Record Count in Table
Section titled “Record Count in Table”When working with a big dataset and trying to reduce the population, it’s important to see the population size at any step in the way.
The new record count feature displays the number of records in the underlined query of a table or a custom report. This helps users filter the data to a desired number of records and then act on the insight from the filtered population.
Some use case examples :
-
Build a list of customers for a campaign, and keep it focused on the right number of targets.
-
Analyzing events and producing a report.

Dynamic chart drill-through
Section titled “Dynamic chart drill-through”Changing a chart or group of chart dimensions enables the user to follow a natural analytics process by answering a string of questions that drill down into the dashboard’s data.
This new feature enables users to drill through for data insights with the need to navigate between sheets and look at charts and dashboards from different angles easily.
Allowing users to focus on different entities.
Text Object and Table Markdown Support
Section titled “Text Object and Table Markdown Support”Great-looking dashboards and data apps increase user engagement with data and finding data insights.
With this new feature, creators can elevate the display of the tables and dashboard with fully customizable and styled text combined with images.
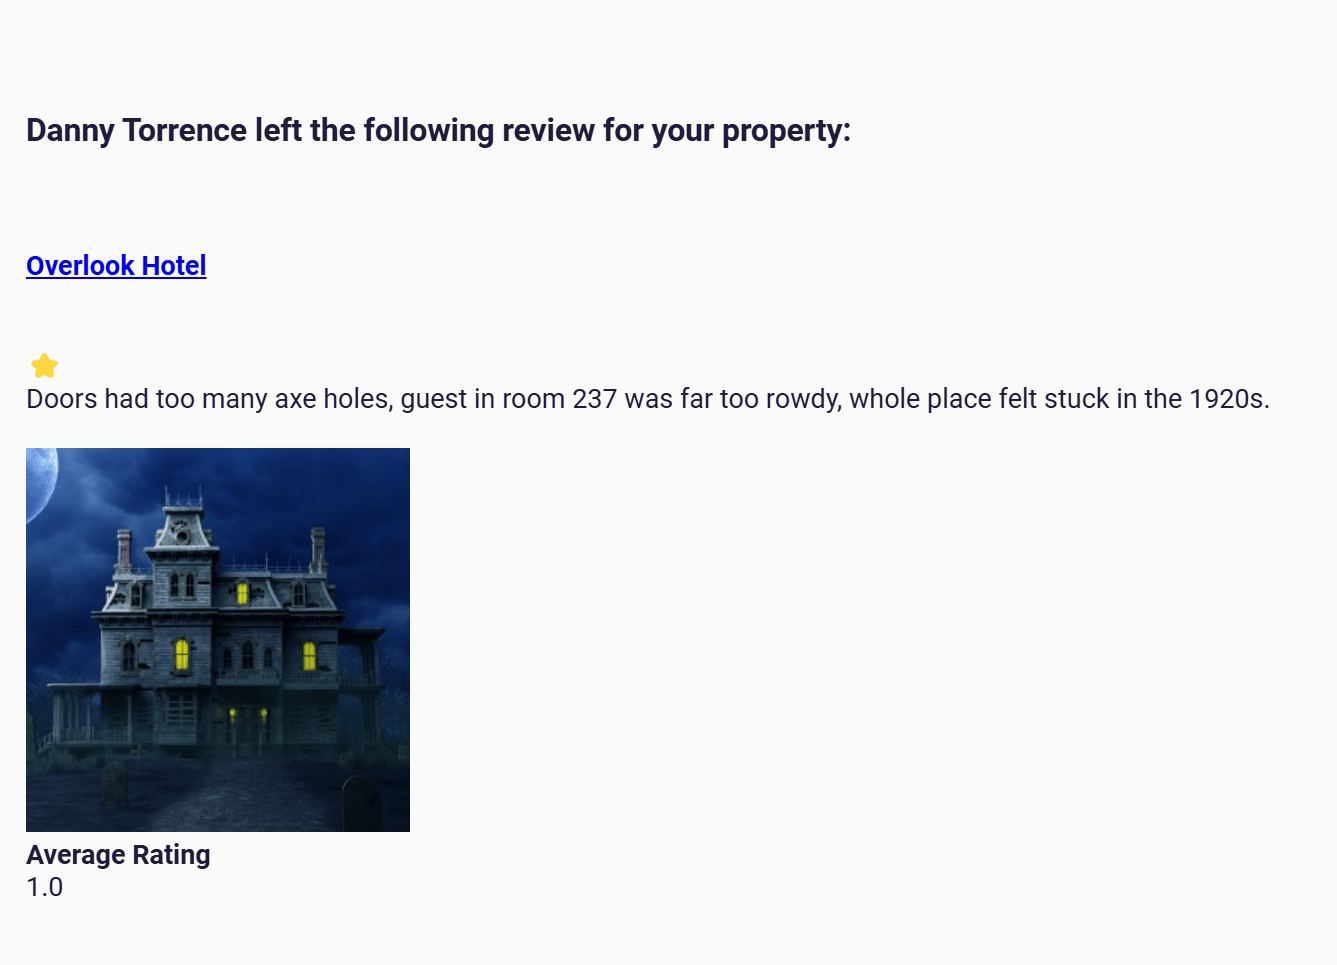
2.891 - 03 December 2024
Section titled “2.891 - 03 December 2024”🆕Radar Chart
Section titled “🆕Radar Chart”Clarity is key when visualizing complex data. That’s why we’re thrilled to announce the release of Radar Charts in Astrato! 🎉 This new visualization makes it easier to compare and analyze data across multiple dimensions in a single, intuitive view.
What Are Radar Charts?
Radar charts, also known as spider or web charts, are a type of visualization that uses a circular layout to show data across several axes. Each axis represents a different metric or dimension, and the data points are connected to form a shape—offering a visual snapshot of relationships and trends.
Imagine comparing sales performance, customer satisfaction, and market reach across multiple regions—all in one chart. That’s the power of radar charts.
- In the example below, we’re delving into employees’ skills and charting the average scores across the company for key competency areas.
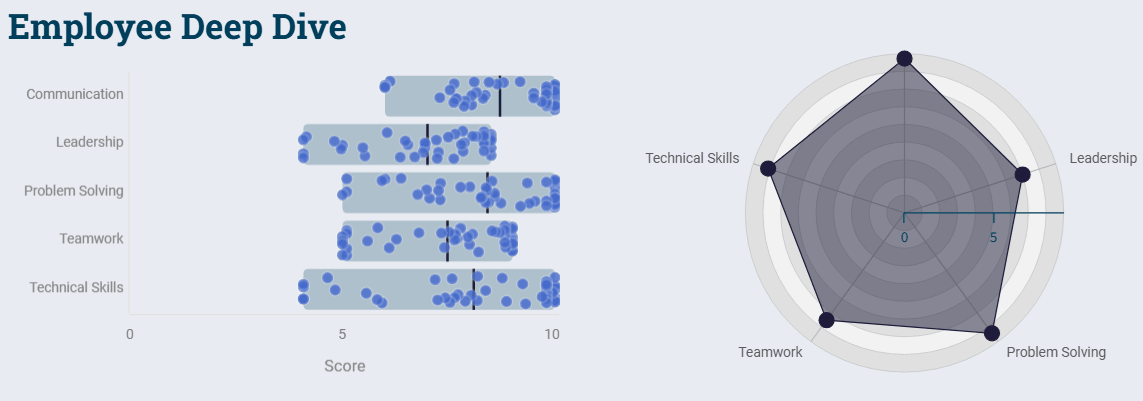
2.89 - 27 November 2024
Section titled “2.89 - 27 November 2024”Semantic Layer - Developer View
Section titled “Semantic Layer - Developer View”This new feature allows dataview creators to see the whole dataview structure in a code display and export it to a YAML file.
The new display simplifies looking for specific fields and seeing where the field is used.
The exported file can train the LLM model to write Astrato measures and dimensions and improve user suggestions.
Action- Embeds Communication
Section titled “Action- Embeds Communication”A new action block allows external apps to pass information to an Astrato app.
And listen to events on an Astrato app.
The new actions allow external apps to pass information such as filter values, sheet names for navigation, and more to an Astrato app.
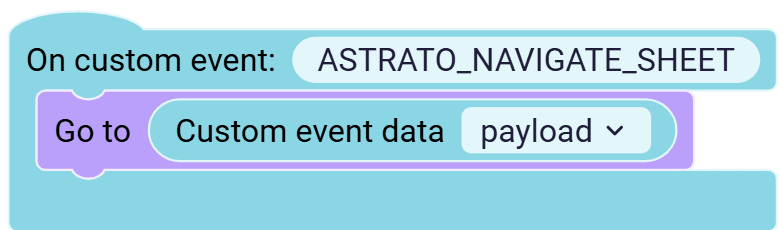
Set Your Own AI Provider
Section titled “Set Your Own AI Provider”A new option to set the AI provider of choice is selecting the LLM model to generate AI suggestions in Astrato.
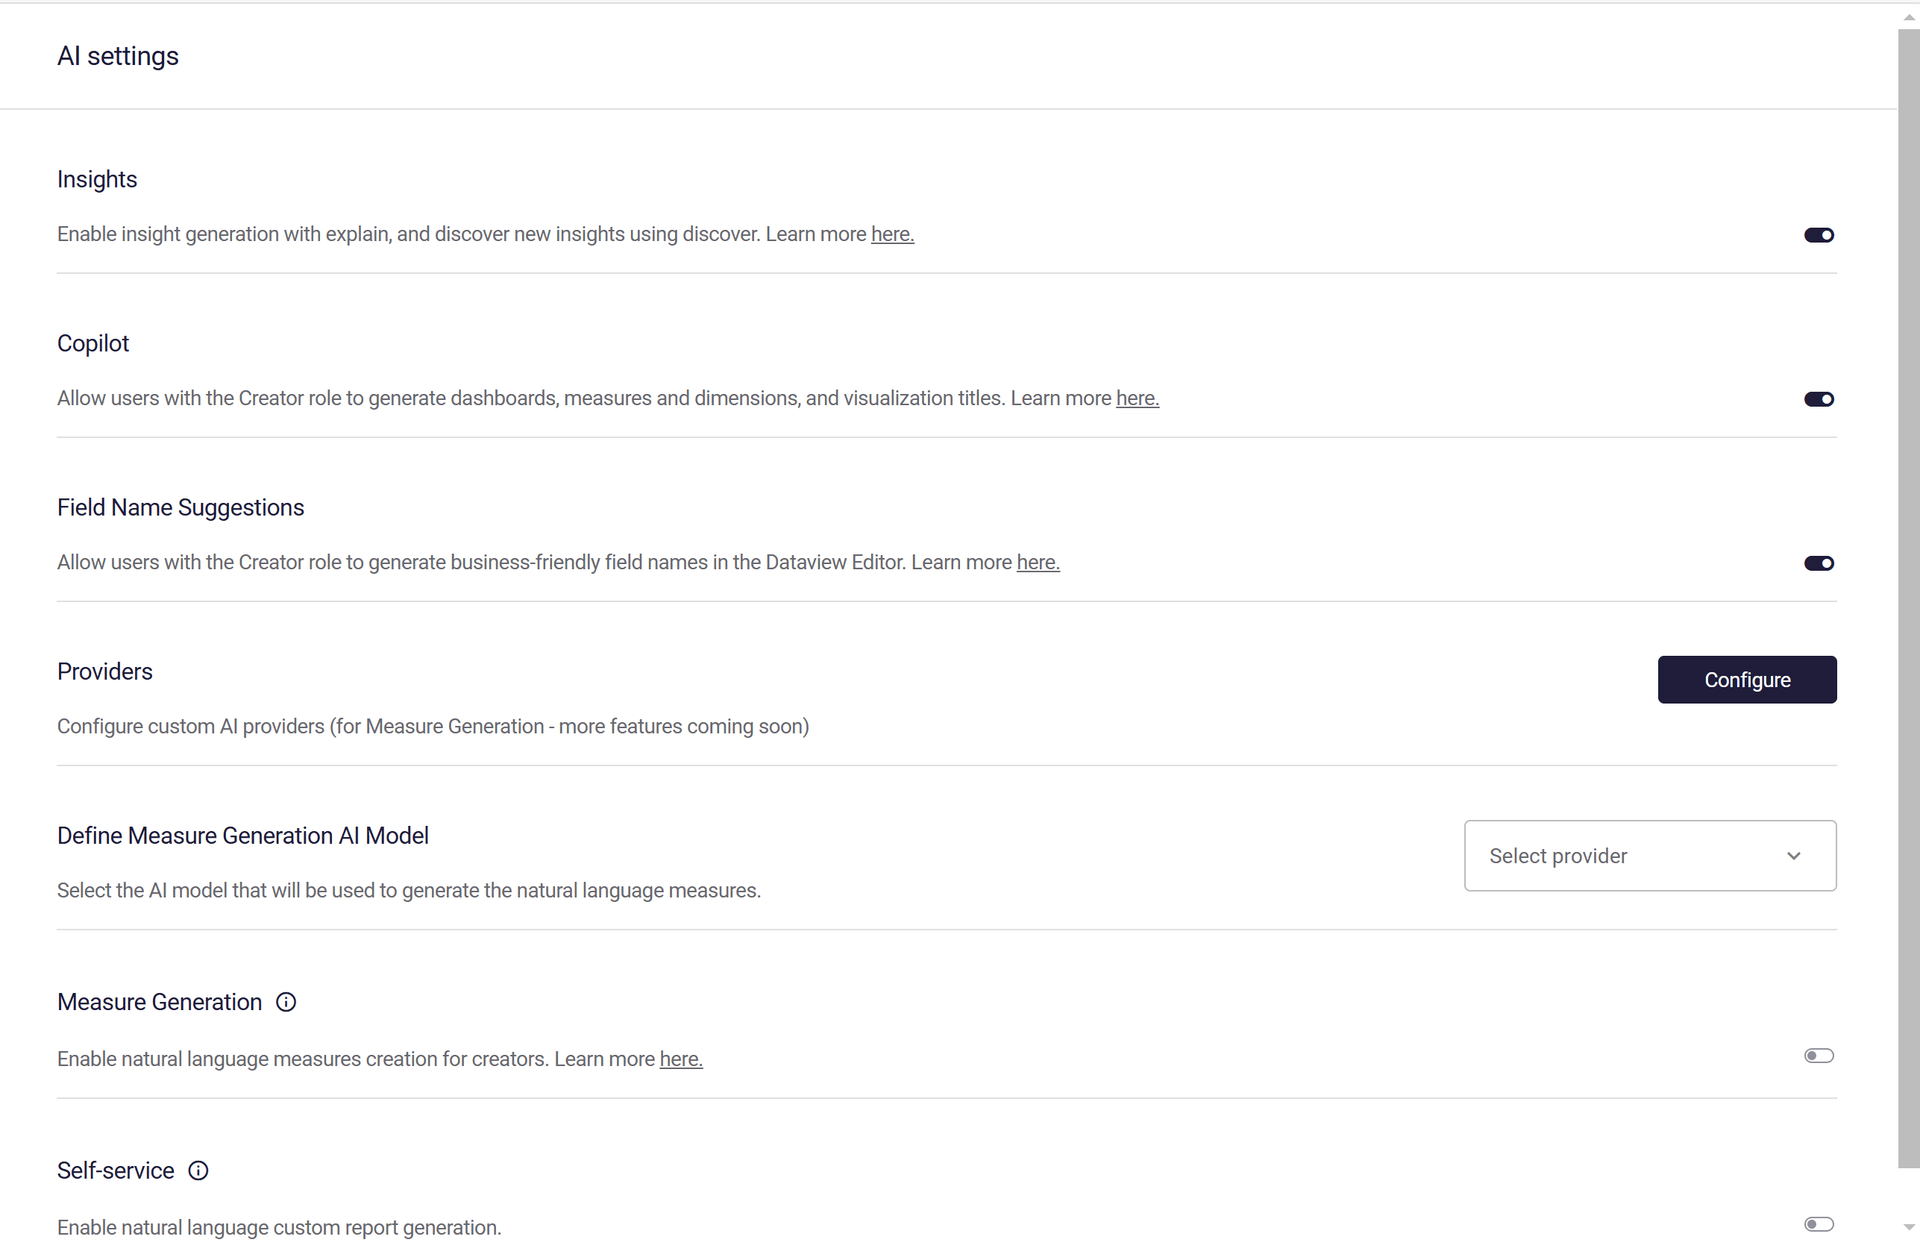
2.88.1 - 21 November 2024
Section titled “2.88.1 - 21 November 2024”Advanced Calculation - Running Rate
Section titled “Advanced Calculation - Running Rate”New option in advanced chart calculations- running rate.
Running rate is useful when comparing different entities’ performance over time.
For example, the running rate for closing deals by different types of products and learning which products are more accessible to close.
For the customer memberships period, identify the type of customers that are more likely to churn early.
This analysis can provide valuable insights, such as:
-
Identifying the overall customer retention rate over time
-
Detecting trends in churn, such as if the cumulative churn percentage is accelerating or decelerating
-
Comparing the cumulative churn percentage to industry benchmarks or your own historical performance
-
Pinpointing specific periods or events that may have contributed to higher churn
Filter Bar- Hide Drill-Through Dimension Icon
Section titled “Filter Bar- Hide Drill-Through Dimension Icon”A new option in the filter bar to hide the drill-through dimension icon from the filter bar.
This option is valuable in a guided analytics app where actions and variables change drill-through dimensions.
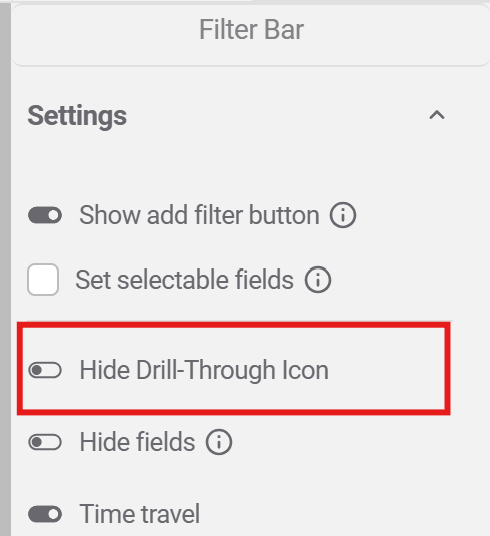
2.88 - 14 November 2024
Section titled “2.88 - 14 November 2024”OIDC Groups & Roles Synchronization
Section titled “OIDC Groups & Roles Synchronization”Syncing groups and roles from the OIDC provider reduces the admin work in Astrato and improves security management.
This will improve the efficiency and control of managing user access in Astrato.
Custom Null display in Export
Section titled “Custom Null display in Export”There is a new option to set the null value display when exporting data from Astrato.
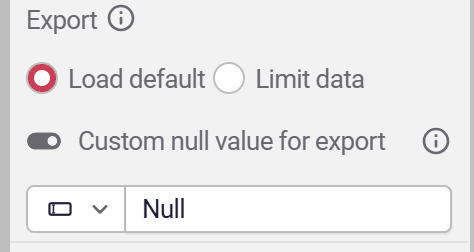
Enterprise Connection - New Identity Providers
Section titled “Enterprise Connection - New Identity Providers”Astrato now supports three additional identity providers for setting up enterprise logins.
-
Microsoft Azure AD
-
Ping Identity
-
Keycloak
2.87.1 - 13 November 2024
Section titled “2.87.1 - 13 November 2024”Treemap Visualization
Section titled “Treemap Visualization”Treemaps are a versatile visualization technique that excels at displaying hierarchical data in a compact and informative manner. By representing data as nested rectangles, treemaps provide a clear visual overview of the relative sizes and relationships between different categories within a hierarchy.
Benefits of Treemaps
-
Compact Visualization: Treemaps efficiently display large amounts of hierarchical data in a limited space.
-
Clear Hierarchy: The nested structure of rectangles clearly represents the hierarchical relationships between different categories.
-
Quick Insights: Users can quickly identify the relative sizes and proportions of different categories.
-
Interactive Exploration: Treemaps can be interactive, allowing users to drill down into specific categories for more detailed analysis.
2.87 - 31 October 2024
Section titled “2.87 - 31 October 2024”Improved UX for Filtering
Section titled “Improved UX for Filtering”Asking business questions by applying filters is one of the core functionalities in data analytics tools.
Filtering in Astrato just got simpler faster and more intuitive, this will allow all users to ask more complex business questions, by selecting ranges of dates and values.
Measures - more options to compare two fields in measure filters
Section titled “Measures - more options to compare two fields in measure filters”Measure filters support the creation of complex measures with a complete no-code experience.
Measures filters now support more ways to compare two fields as part of the measure filters.
For example, finding a combination of products bought together without repeating the combination in a different order.
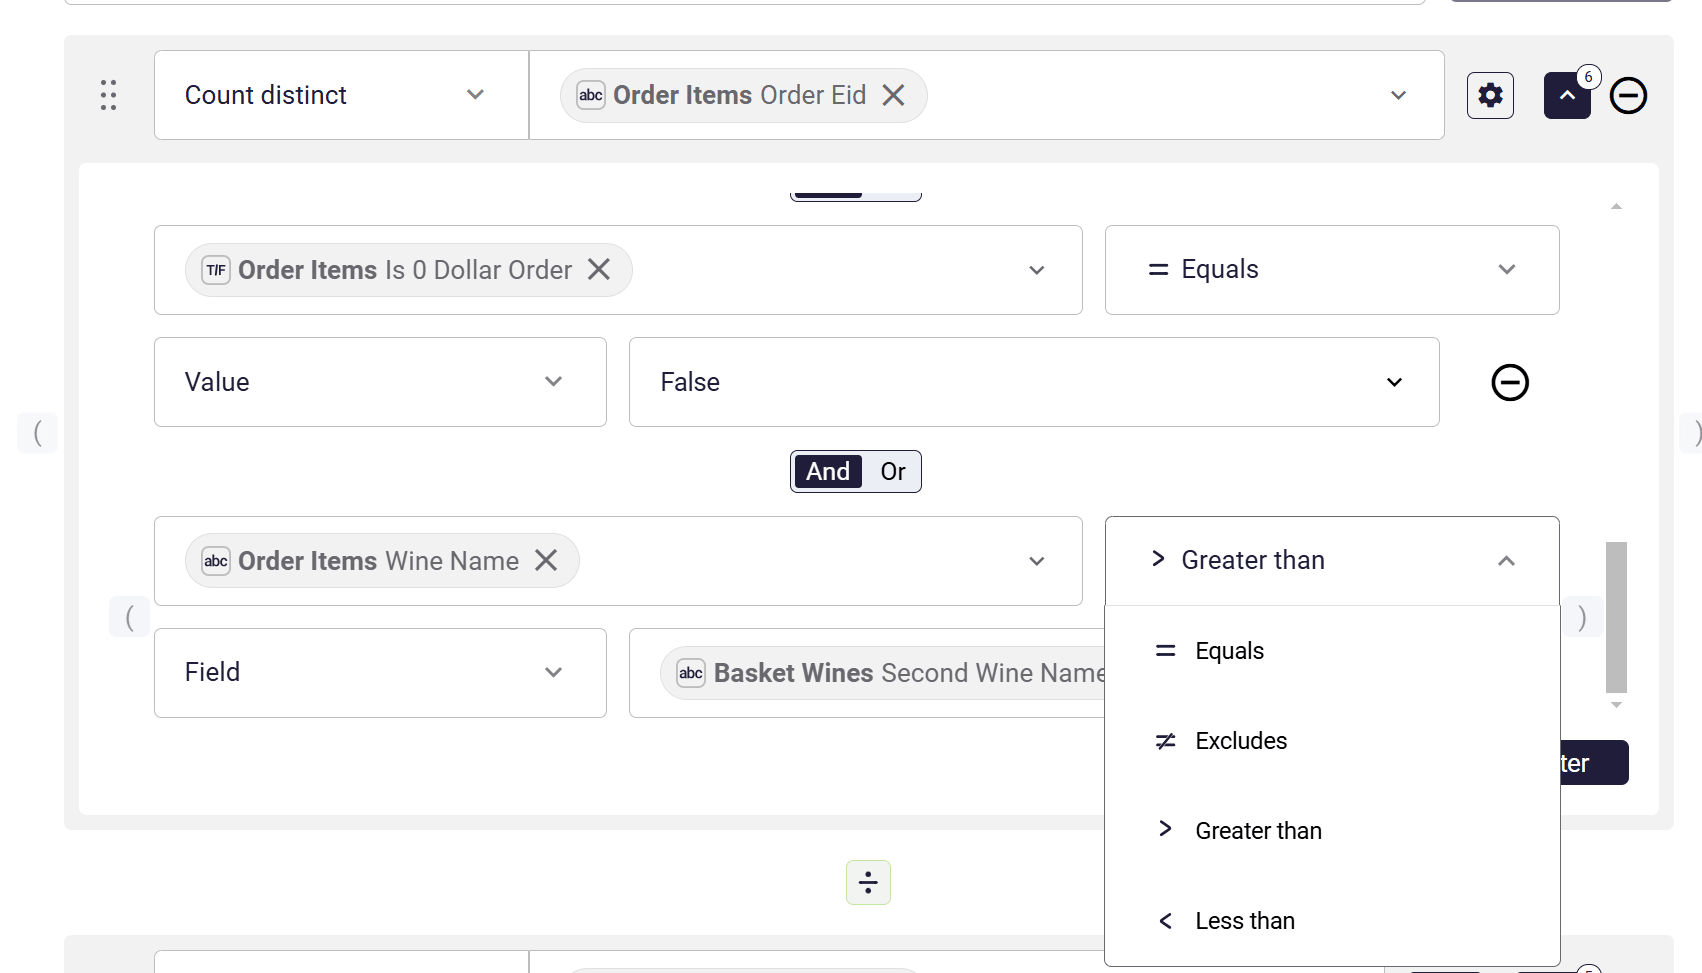
2.86.10 - 24 October 2024
Section titled “2.86.10 - 24 October 2024”Combo Chart Tooltip Enhancements
Section titled “Combo Chart Tooltip Enhancements”Tooltips are an essential part of a good visualization; they give users a view of the full information in the visualization and additional information like the total of the measures displayed in the chart.
The new feature allows users to define which measures will be included in the total result displayed in the chart.
This is useful when measures with different units are included in the chart.
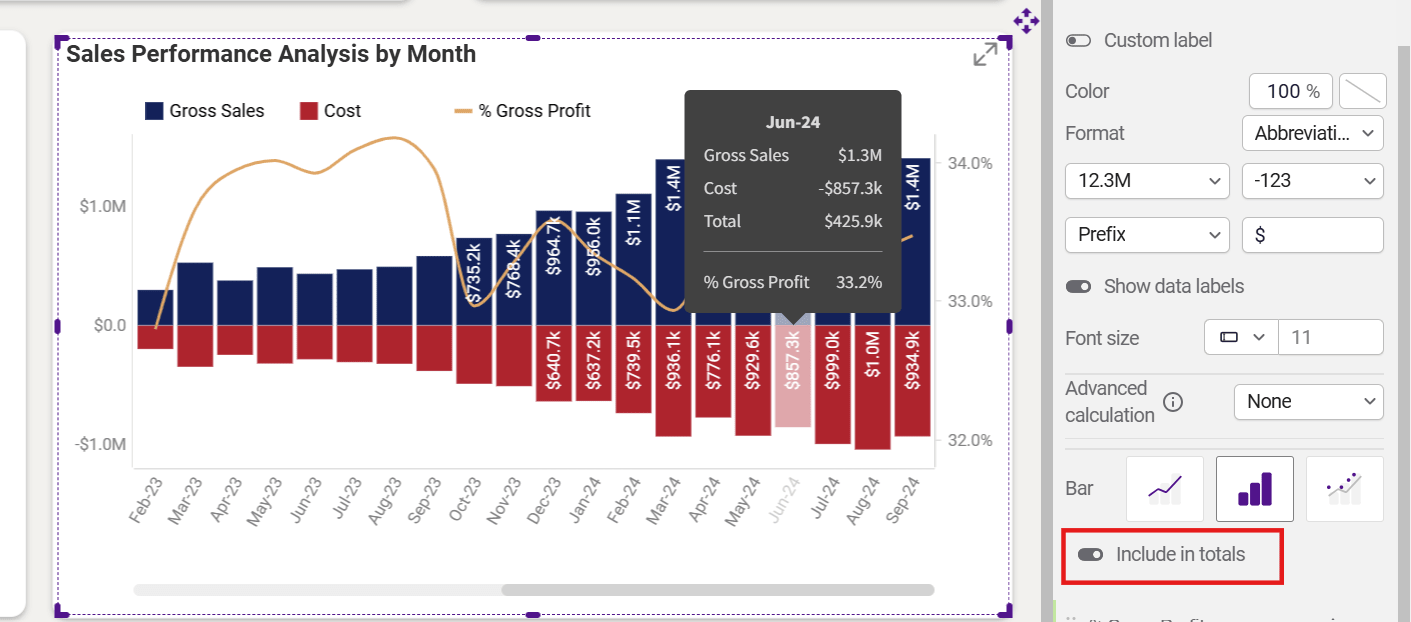
Advanced Manual Joins
Section titled “Advanced Manual Joins”The new type of Join supports users in answering questions like:
-
Show me the active tickets in a specific date range.
-
Show me stocks whose open and close value falls within a specific range.
The new manual join type supports using more operators to define the relationship between two tables.
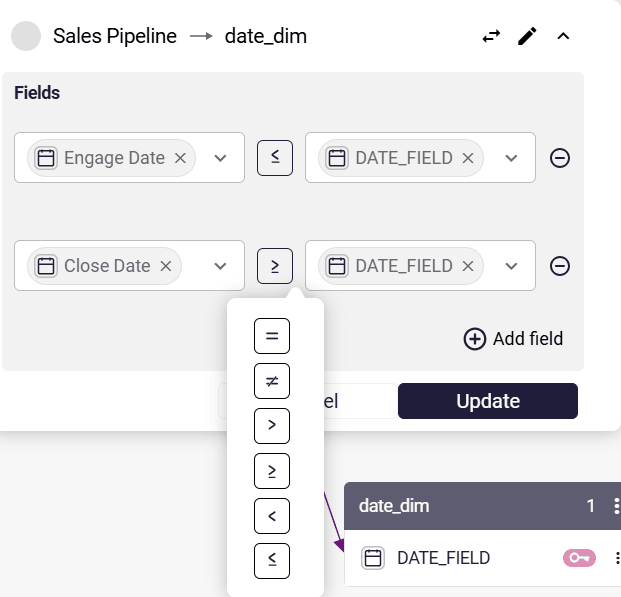
2.86.9 - 22 October 2024
Section titled “2.86.9 - 22 October 2024”Bookmark Sharing with Groups and Users
Section titled “Bookmark Sharing with Groups and Users”Bookmarks sharing allows users to share their insights with other users, enhancing decision-making by utilizing the collaborative insights of all users.
Bookmark sharing also helps get users to start exploring new apps with example insights and speed up self-service usage of data apps.
The new feature allows users to share their bookmarks with specific users and groups.
Hide Fields From The Filter Bar
Section titled “Hide Fields From The Filter Bar”Creators can define a list of fields that will not show in the filter bar even if a selection is made in them.
This feature supports complex guided analytics apps that require default selections in some areas of the app.
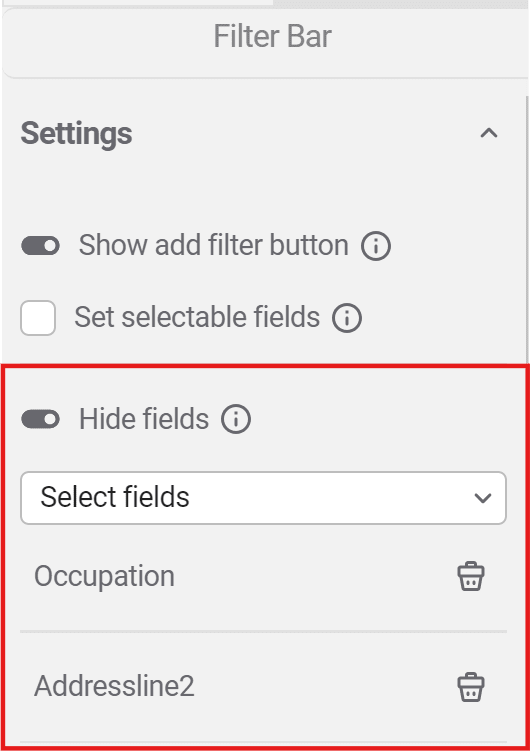
2.86 - 15 October 2024
Section titled “2.86 - 15 October 2024”Advanced Calculations are available in more visualizations
Section titled “Advanced Calculations are available in more visualizations”Advanced calculations enable all users to answer more complex business questions like:
-
What is the six-month moving average revenue trend?
-
What is the share of revenue of each category in each country?
-
What is the trend of the daily average number of users on my website?
The Full list of Advanced Calculations includes:
Category | Type | Description | Formula |
Moving Aggregations | Running total | returns the cumulative result of all records up to the current record, including the current record | |
Moving Calculation | Returns the cumulative result of a set of records as defined by the user. | ||
Period over Period | Value | Returns the value of the comparison record | [comparison record] |
Difference | Returns the difference between the current record and the comparison record | [current record] - [comparison record] | |
Rate | Returns the rate between the current record and the comparison record | [current record] / [comparison record] | |
Growth | Returns the growth rate between the current record and the comparison record | ([current record] / [comparison record])-1 | |
Accumulated Growth | Returns the growth rate by comparing the running total of two measures | running total(measure) / running total(reference) -1 | |
Others | Rank | Returns the rank of a measure by the selected dimensions | Rank(measure) |
Total | returns the total value of a measure by the selected dimension | Sum(measure) | |
Compare to total | returns the result of a measure vs the total result of a measure. | measure/ sum_total(measure) measure - avg_total(measure) | |
Nested Calculations | Nested Calculation | Returns the aggregate result of a measure after calculating an internal virtual table using an additional dimension just for this measure. | avg(measure splited by dimension) |
Nested Ratio | Returns the ratio of the measure aggregated on two different internal levels | avg(measure split by dimension 1) / max(measure splited by dimension 2 |
Advanced calculations are available in this release’s KPI object, scatter, and dot charts.
Merge cell display in the table.
Section titled “Merge cell display in the table.”When displaying a table with multiple dimensions, showing the same values in the dimension in every row might make it hard for users to read the table.
This new feature simplifies the table display and allows users to find insights faster.
Custom Labels Enhancements
Section titled “Custom Labels Enhancements”Custom labels allow for the display of measure & dimensions labels that update dynamically according to selections or time changes.
Custom labels simplify chart reading and help users focus on the data and find insights.
Custom labels now appear in all tooltips, and when charts are exported to Excel, they help users share insights.
New Bar Chart Display
Section titled “New Bar Chart Display”A new option to display measures only bar chart in grouped mode; this enables the creation of comparison of multiple measures in one bar chart.
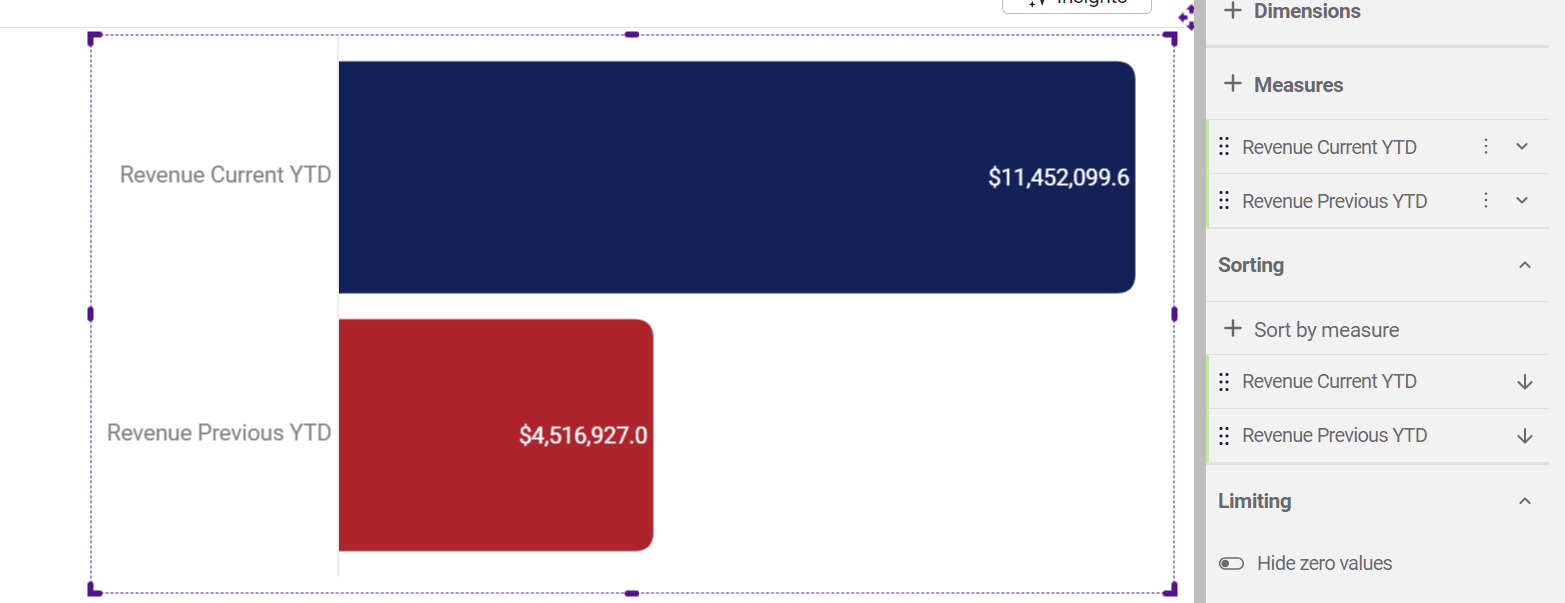
Slider Filter Formatting
Section titled “Slider Filter Formatting”Slider filters enable users to quickly select a range of numbers in a field or a range of dates.
With the new formatting option, the numeric/date field can be formatted to help users understand the type of field they are using.
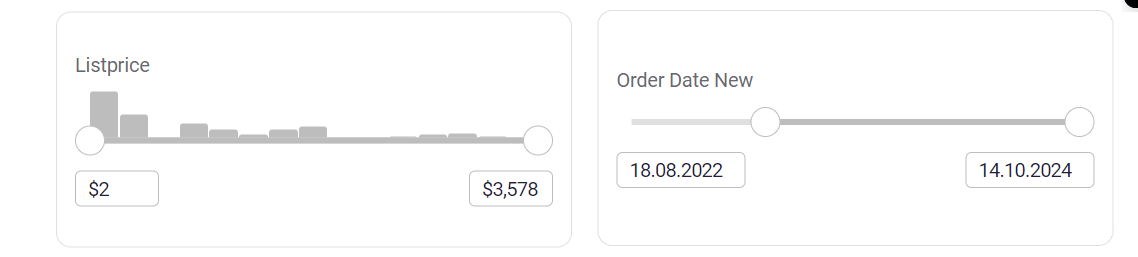
2.85 - 10 October 2024
Section titled “2.85 - 10 October 2024”New data connection - Clickhouse (Beta)
Section titled “New data connection - Clickhouse (Beta)”Astrato now supports integration with Clickhouse. Users can connect to Clickhouse databases directly, enabling seamless querying and analysis within Astrato’s live-query environment. This new connection expands data source flexibility and enhances support for fast and scalable analytics. Currently available in Beta, with further enhancements coming soon.
Date action - get week
Section titled “Date action - get week”The get date component block now includes support for retrieving the week from a given date. Users can choose between ISO week or standard week options for more flexibility in handling date-related data. This enhancement provides a streamlined way to extract week information directly within action blocks.
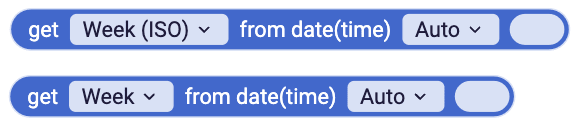
Reporting - enhanced error messages
Section titled “Reporting - enhanced error messages”Report error messages have been improved to provide clearer feedback. Errors, such as deleted variables, will now be displayed at the end of the report, making them easier to identify and resolve.
2.84 - 04 October 2024
Section titled “2.84 - 04 October 2024”Measures filters in the table and custom report
Section titled “Measures filters in the table and custom report”The new measures filters enable users to answer business questions like:
Show customers who purchased more than five times and spent less than 1000$ ?
In each category, which products have a YOY growth higher than 10% and generate revenue higher than 100k$?
User can combine filters on multiple measures to answer their questions.
The results can be applied as global filters in the app for further exploration.
2.83 - 26 September 2024
Section titled “2.83 - 26 September 2024”Variable actions - Set multiple variables at once
Section titled “Variable actions - Set multiple variables at once”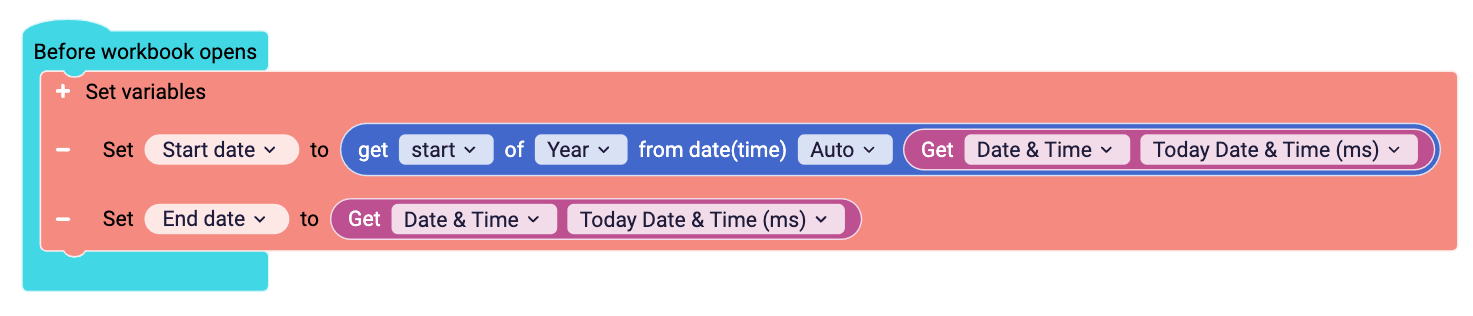
Introducing the new Set Variables block, designed to enhance both performance and ease of use. Instead of triggering separate queries for each individual variable change, all updates are applied at once, making it particularly efficient when used in measures or filters. By consolidating variable changes into a single action, this block not only reducing complexity in your setup but also improves performance by minimizing redundant query executions.
Favicon - Custom workbook favicon
Section titled “Favicon - Custom workbook favicon”
We’re excited to announce a new feature that allows users to customize their analytics experience by adding their company’s favicon via a simple URL link in the workbook settings.

With the addition of favicons, businesses can further align their analytics environment with their corporate identity.

This is a must-have for OEMs or customers with data meshes who share data with customers, partners, or suppliers.
Quick Export to Excel and CSV
Section titled “Quick Export to Excel and CSV”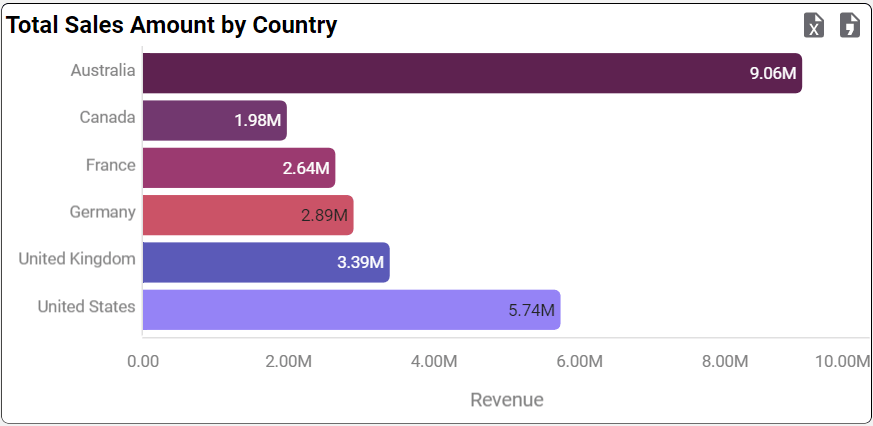
Exporting a dataset from a data analytics tool is integral to the natural analytics and thinking process.
The exported data can be shared with other users or programs to exploit the data’s insights further.
This new feature enables creators to add an export icon to an object, simplifying the process of exporting data for end users.
Advanced Calculation- Nested Aggregations
Section titled “Advanced Calculation- Nested Aggregations”Astrato’s advanced calculation enables all users to create measures that answer complex business questions with just a few mouse clicks.
The new options of Nested aggregation and Nested ratio enable users to answer questions like:
What is the daily active user average on the website?
What is the product stickiness rate in SAAS?
How many products have had positive growth compared to last year in each category?
Answering these business questions in Astrato is as simple as answering any other business question, further enhancing the self-service offering.
Astrato’s Advanced calculation includes also:
-
Accumulated and moving aggregations
-
Period-over-period functions
-
Ranking, Subtotals, and comparing to the total results.
Linked Object\Visualization
Section titled “Linked Object\Visualization”Efficient building and simple maintenance of data apps for guided analytics and OEM data products are essential for the quick time-to-market release of new versions and capabilities.
The Linked object is going to be one of the creators’ most used tools in Astrato.
This new option allows for the reuse of buttons and visualizations inside an app.
All the linked objects are edited in one place and can perform the same set of actions.
After copying an object, there is a new option in the menu paste as linked.
2.82 - 18 September 2024
Section titled “2.82 - 18 September 2024”Map Actions- Advanced Tooltips in a map point layer
Section titled “Map Actions- Advanced Tooltips in a map point layer”Adding context to map visualization helps users to understand the data easily and to make educated decisions.
The new feature allows creators to build an interactive data analytics experience using map event actions.
Use can range from tooltips to any dashboard filtering and chart-adjusted display.
Filter Bar Custom Buttons
Section titled “Filter Bar Custom Buttons”Buttons help creators build guided analytics apps that shorten the time to insight for users.
The new feature allows creators to add a button to the filter bar.
The same button on the same position across an app helps users learn the curve.
This new type of button can run the same action flow on multiple sheets, reducing the app’s complexity and maintenance time when changes are needed.
Hide Zero Records
Section titled “Hide Zero Records”In the data analysis process, it’s important to remove noise and outliers to facilitate the visualization of insights and the making of educated decisions.
This new feature allows users to hide records that all the measures return null or zero, creating a more meaningful display.
HTML Text Object
Section titled “HTML Text Object”Using HTML code enhances the design and functionality options of the text object in Astrato.
This new option enables creators to enhance the display of text objects with the full design range of HTML text, including fonts and coloring parts of the text, interactive backgrounds, and more.
HTML Display for Dimensions in a Table
Section titled “HTML Display for Dimensions in a Table”Using HTML code enhances the design and functionality options of the dimensions in a table.
This new option enables creators to enhance the display of dimension columns with the entire design range of HTML text, including fonts and coloring parts of the text, interactive backgrounds, and more.
2.81 - 05 September 2024
Section titled “2.81 - 05 September 2024”Sheet Scrolling
Section titled “Sheet Scrolling”When creating guided analytics apps and data storytelling, including more information without confusing the users is essential.
With the new sheet scrolling option, data storytelling and guided analytics can be better than before, leveraging the option to include more insights in a single page.
Maximize Chart
Section titled “Maximize Chart”In a good data app, we include several visualizations that give users the bigger picture view, combining the insights from all visualizations.
But there are times when users want to dive deep into a certain visualization. With the new feature of maximizing objects, users can easily focus on a specific visualization to see the data insights without the distractions of other visualizations.
Self-Service Custom Report Sorting
Section titled “Self-Service Custom Report Sorting”Astrato’s custom report is an essential part of the self-service analytics offering,
It allows a creator to create a secure and controlled self-service environment for end-users.
Ad-hoc reports can be built and saved on the fly with a selected measure and dimension.
With the new improvements, users can easily re-order dimensions and measures, sort the visualization display, and much more.
2.80.13 - 12 August 2024
Section titled “2.80.13 - 12 August 2024”Chart Filters: Variable support
Section titled “Chart Filters: Variable support”Variables for chart filters have arrived! Variables in filters enable use cases like creating filter groups for multiple charts or bulding comparative analysis data apps.
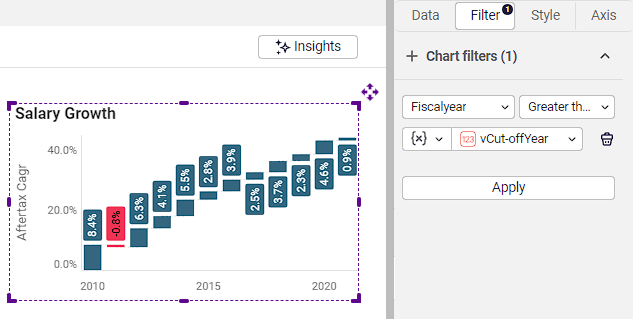
Using variables, comparative analysis is now even more powerful, enhancing your data storytelling capabilities. You can link filters between charts or even connect individual measures across different visuals. Whether you’re comparing against competitors, assessing neighboring retail stores, or analyzing performance across regions, the possibilities are at your fingertips.
Setting up chart filters with variables:
Chart label size customization & variable options
Section titled “Chart label size customization & variable options”Data label (measures) and axis label size can now be customized and even linked to variables. Customize label size between charts to show users a clear hierarchy of insights.
Need to make a chart stand out after an interaction? That;’s where variables come in, to make the data that matters,come to life.
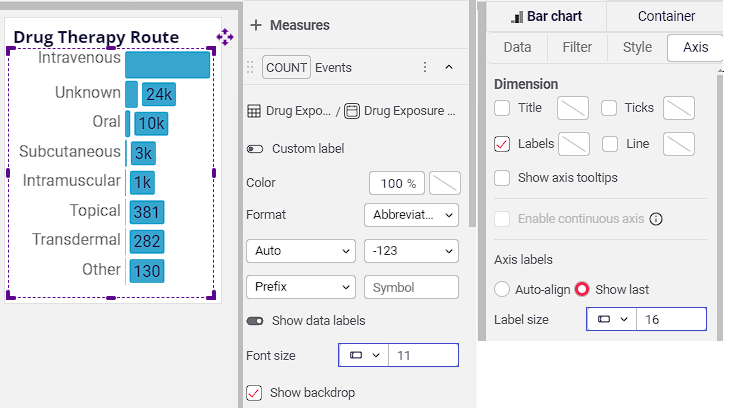
Number: Enhanced threshold coloring
Section titled “Number: Enhanced threshold coloring”We’ve enhanced the color customization options for the number object. Now, you can not only select which measure to color by but also independently set unique colors and thresholds for each measure.
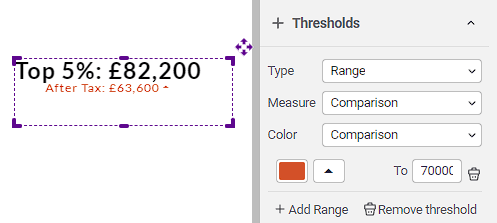
Chart Scrolling: Start scroll at end
Section titled “Chart Scrolling: Start scroll at end”Charts are able to set by default to the end of the data - perfect when working with time based data.
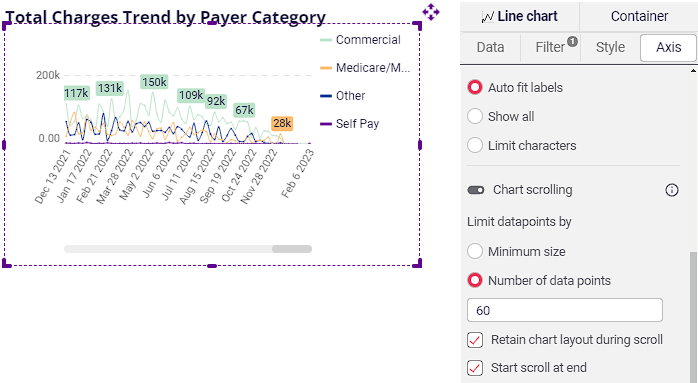
New Shortcut Available: CTRL + SHIFT + L
Section titled “New Shortcut Available: CTRL + SHIFT + L”Introducing a helpful shortcut—CTRL + SHIFT + L—that instantly reverts your workbook to its default state by clearing all user states and applied bookmarks. This feature ensures you can quickly reset your workbook if needed.
2.80 - 06 August 2024
Section titled “2.80 - 06 August 2024”Writeback support for Redshift and Postgres SQL
Section titled “Writeback support for Redshift and Postgres SQL”In the evolving data analytics landscape, writeback capabilities are emerging as a game-changer. But what’s the real business value? Let’s break it down:
-
🔄 Closed-Loop Analytics
-
Enable real-time updates to source systems
-
Seamlessly integrate insights back into operational processes
-
-
🎯 Improved Decision-Making
-
Make data-driven decisions directly within analytics tools
-
Reduce time-to-action by eliminating system switches
-
-
💡 Enhanced Collaboration
-
Foster a culture of data democracy
-
Allow team members to contribute insights and annotations
-
-
🔬 Scenario Planning
-
Test “what-if” scenarios and immediately update forecasts
-
Adapt quickly to market changes and internal shifts
-
There are many more use cases that can be done with writeback as a native part of the data analytics apps.
Key-Pair authentication For Snowflake
Section titled “Key-Pair authentication For Snowflake”Key pairs are more secure because they use two keys (one public, one private), keep the private key secret, allow you to verify who sent a message, are easier to manage, and provide proof of sending messages.
1. Two Keys: A key pair uses two keys – a public key and a private key. The public key locks (encrypts) the data, and only the private key can unlock (decrypt) it. This means if someone gets the public key, they still can’t read the data without the private key.
2. Private Key Stays Secret: The private key is kept secret and never shared. This means only you can unlock the locked data with your public key, making it very secure.
3. Verify Identity: Key pairs allow you to sign messages with your private key. The recipient uses your public key to verify the signature, ensuring the message is really from you and hasn’t been tampered with.
4. Easier Management: Instead of sharing one key with everyone (like with a single password), each person has their own key pair. This makes it easier to manage and more secure because you don’t have to share your private key with anyone.
5. Proof of Sending: When you sign a message with your private key, it proves you sent it. No one else could have signed it because no one else has your private key.
Improved Display in the Semantic Layer.
Section titled “Improved Display in the Semantic Layer.”The new display of the assets panel in the dataview now includes indicators for the number of items for each category.
This makes tracking the changes in the items and management of items much more efficient.
Manage user’s access and permission in the data-view
Section titled “Manage user’s access and permission in the data-view”This new feature enhances the control of admins and creators on what each user can do in a dataview; it also enhances the flexibility of controlling user access to data and reduces the number of data connections needed.
2.79v - 24 July 2024
Section titled “2.79v - 24 July 2024”🆕 More advanced calculations available for use in measures
Section titled “🆕 More advanced calculations available for use in measures”More calculations to support self-service analytics, Easily create measure the shows advanced calculations such as:
-
Rank by a selected measure and grouped by selected dimensions.
-
Compare to total - compare a result to total values (Avg, Max, Min), compare actual values, or calculate the difference to the total result.
-
Total- Calculate a total aggregation result for a selected set of dimensions.
These option are added to the existing option of period over period and moving calculations that were part of previous releases.
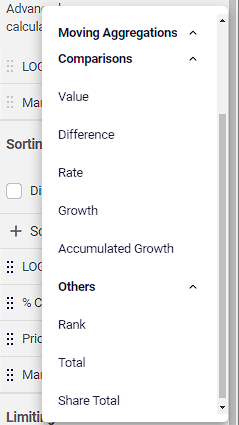
Table Conditional Coloring: string measure support
Section titled “Table Conditional Coloring: string measure support”For measures aggregations that support string values (listagg, max, min, any_value), we now support the use of strings in conditional coloring.
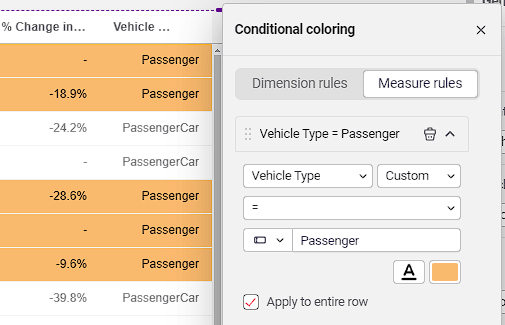
Table: Handling missing images
Section titled “Table: Handling missing images”No more broken images - add a fallback URL to specify the next best image when there is one missing (or no longer valid).
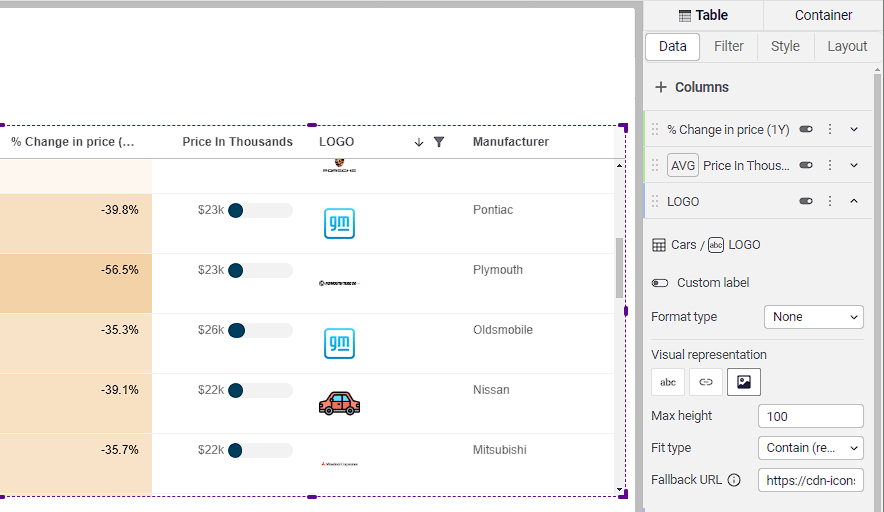
2.79 - 18 July 2024
Section titled “2.79 - 18 July 2024”Stored Procedure Action Blocks For Big Query
Section titled “Stored Procedure Action Blocks For Big Query”Astrato’s Data apps just became even more powerful with the addition of a stored procedure action block.

Using this action opens up new use cases:
-
Loading relevant external data on the fly and combining it with internal data to uncover new insights.
-
Write back data and then call on AI models to analyze and store the new data.
-
Refreshing data when a stored procedure is needed
Writeback For Big Query
Section titled “Writeback For Big Query”Adding writeback functionality to a data analytics app provides several significant benefits,
to name a few:
-
Improved data accuracy and timeliness:
-
Users can correct errors or update information in real-time
-
Reduces lag between insight discovery and data updates
-
-
Enhanced user engagement:
-
Transforms passive data consumption into active interaction
-
Increases user investment in data quality and analysis outcomes
-
-
Streamlined workflows:
-
Eliminates the need to switch between analytics and data entry systems
-
Reduces data transfer errors and inefficiencies
-
-
Faster decision-making:
-
Enables immediate action based on insights
-
Supports agile business processes and rapid response to market changes
-
-
Collaborative analysis:
-
Facilitates team input and shared decision-making
-
Allows for the capture of diverse perspectives and expertise
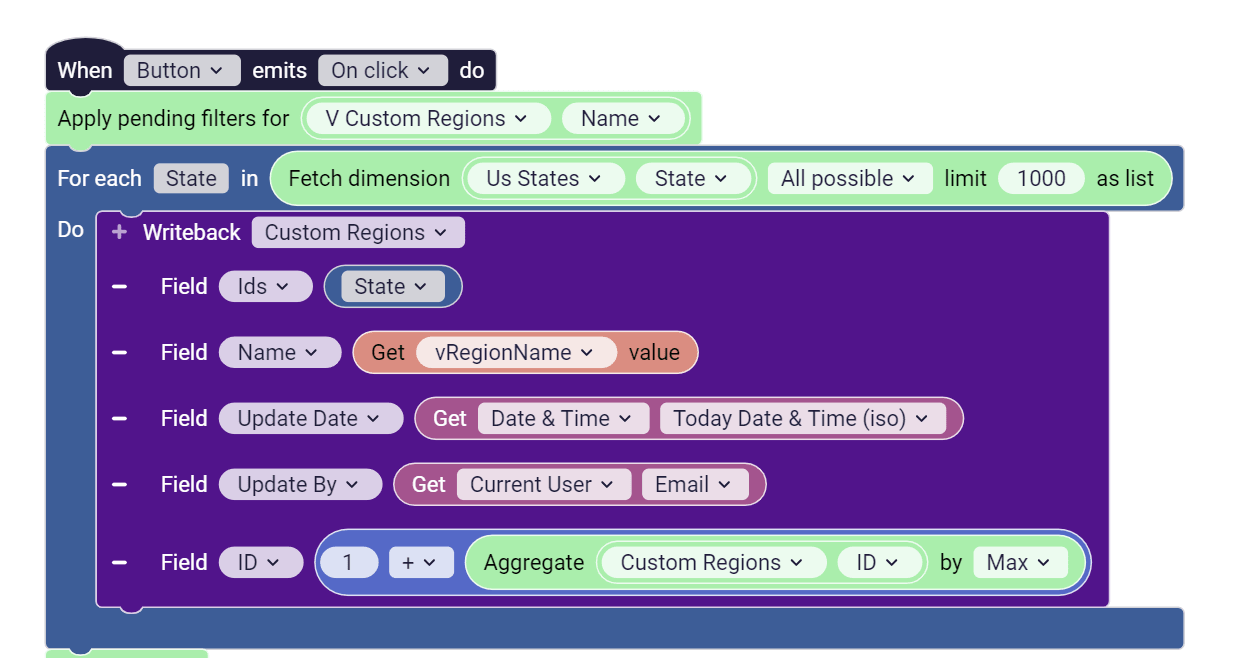
-
2.78 - 11 July 2024
Section titled “2.78 - 11 July 2024”Bookmarks Object
Section titled “Bookmarks Object”Bookmarks speed the time for insight for users by saving commonly used filters and reports.
The new bookmark object makes the bookmark list more accessible, allowing users to save their preferred display and share it with others.
Date Action Blocks
Section titled “Date Action Blocks”Actions enable creators to build guided analytics data apps for end-users, automating users’ data exploration and insights.
The new actions enable date actions such as range selection and finding the latest data available; using these actions to build time makes data exploration simpler and faster.
Example: Select the date range and update the drill-through dimension
Section titled “Example: Select the date range and update the drill-through dimension”
Map- Zoomed Controlled Layer Display.
Section titled “Map- Zoomed Controlled Layer Display.”Changing dynamically the levels of details presented in a Map object enhances the user’s natural way of thinking and focusing on data insights.
As the user zooms in to an area of interest, the level of display changes, and new and more detailed insights can be uncovered.
Labeling enhancements: Backdrop
Section titled “Labeling enhancements: Backdrop”More charts now contain label backdrops, improving label visibility and association with the related data point.
Label backdrops are available on the following charts: 🆕 Bar, Scatter, Line.
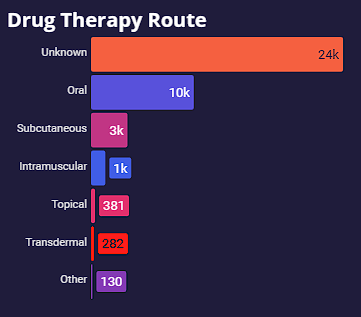
Variable Support: Axis Bands
Section titled “Variable Support: Axis Bands”Benchmarking just became effortless! Use axis bands to create a richer data-driven experience and get instant visual feedback when updating targets and benchmarks.
Data-view Manage Access
Section titled “Data-view Manage Access”Manage the level of access of different users to a data-view (semantic model)
Control who can contribute and consume the data in the model to supply end users with analytics-ready data and simplify Self-Service analytics.
Group Container Properties
Section titled “Group Container Properties”The pixel-perfect dashboard design has just become simple with the new group properties. These settings will enhance builders’ control of group design and reduce the number of objects needed to design dashboards. Groups now have new properties that allow setting a background, border, and other properties to the group.
Advanced Calculation- Accumulated Growth
Section titled “Advanced Calculation- Accumulated Growth”Accumulated growth uncovers insight on a larger set of inputs and reduces the impact of outliers to expose changes in growth trends in important measures.
Creating a measure for accumulated growth usually requires good knowledge of SQL writing, but in Astrato, it requires only a few mouse clicks.
2.77.1 - 26 June 2024
Section titled “2.77.1 - 26 June 2024”🆕 Shape (Polygon) Layer in The Map Object
Section titled “🆕 Shape (Polygon) Layer in The Map Object”Polygon maps are valuable tools for visualizing and analyzing geographical data across various business applications.
Key use cases include:
-
Market analysis
-
Site selection
-
Risk assessment
-
Customer segmentation
-
Competitive analysis
These applications allow businesses to transform complex spatial data into actionable insights, supporting more informed decision-making by revealing patterns, trends, and relationships tied to specific geographic areas.
2.77 - 24 June 2024
Section titled “2.77 - 24 June 2024”🆕 Centralized Access Control
Section titled “🆕 Centralized Access Control”A new centralized access control for data connections, data-views, and collections.
The new access control service includes these features:
-
A user can ask for access to the underlined data-view of workbooks that he tries to open with a few simple mouse clicks.
-
Centralized access requests management and alerts for requests for Astrato tenant admins.
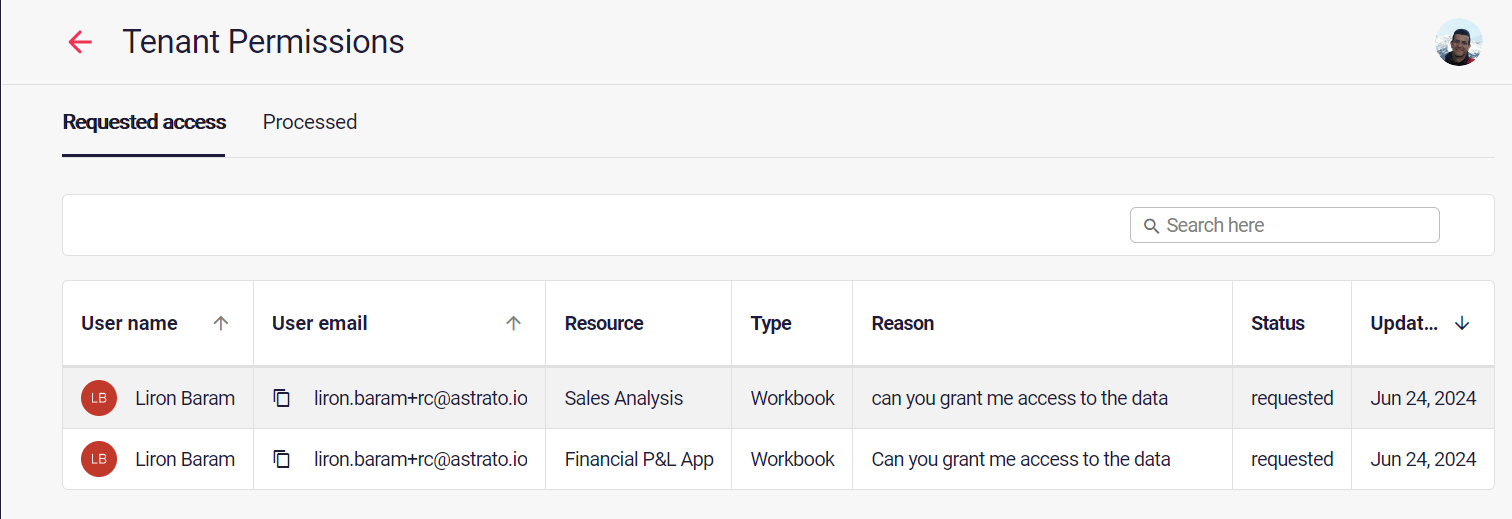
Easily approve or reject requests.
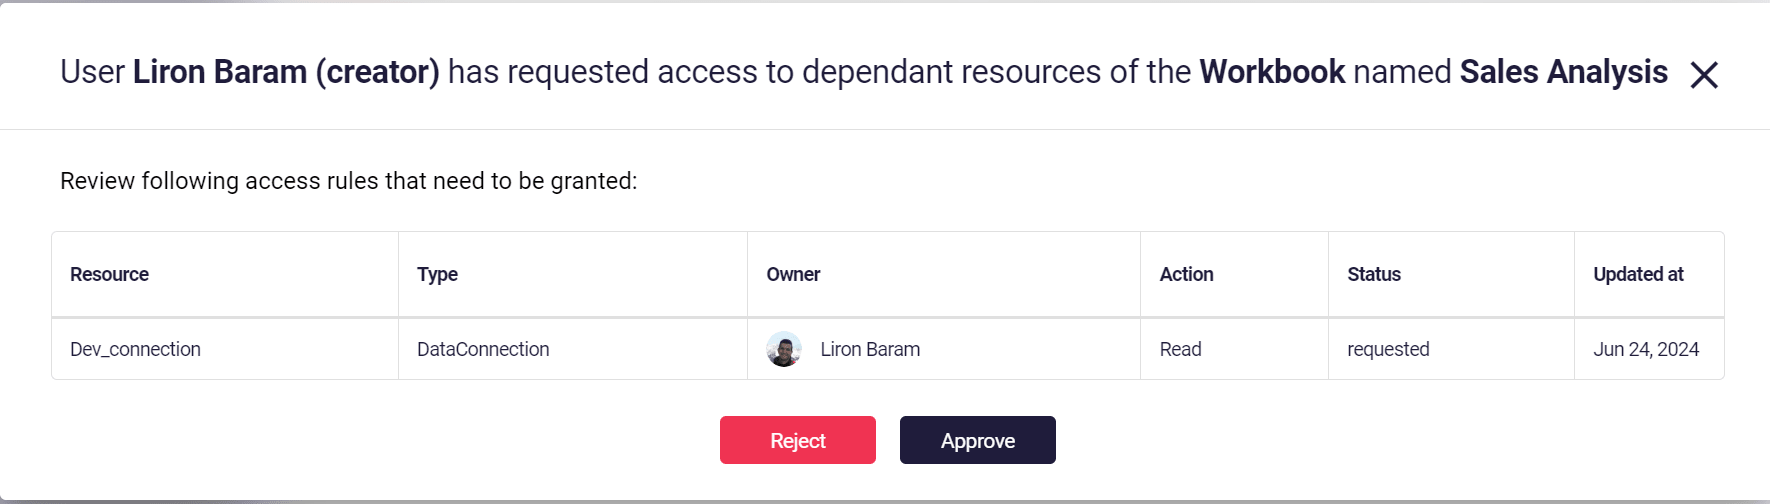
-
Grant access to either Astrato roles, Groups, or Specific users.
The same dialog is used to manage access to all assets.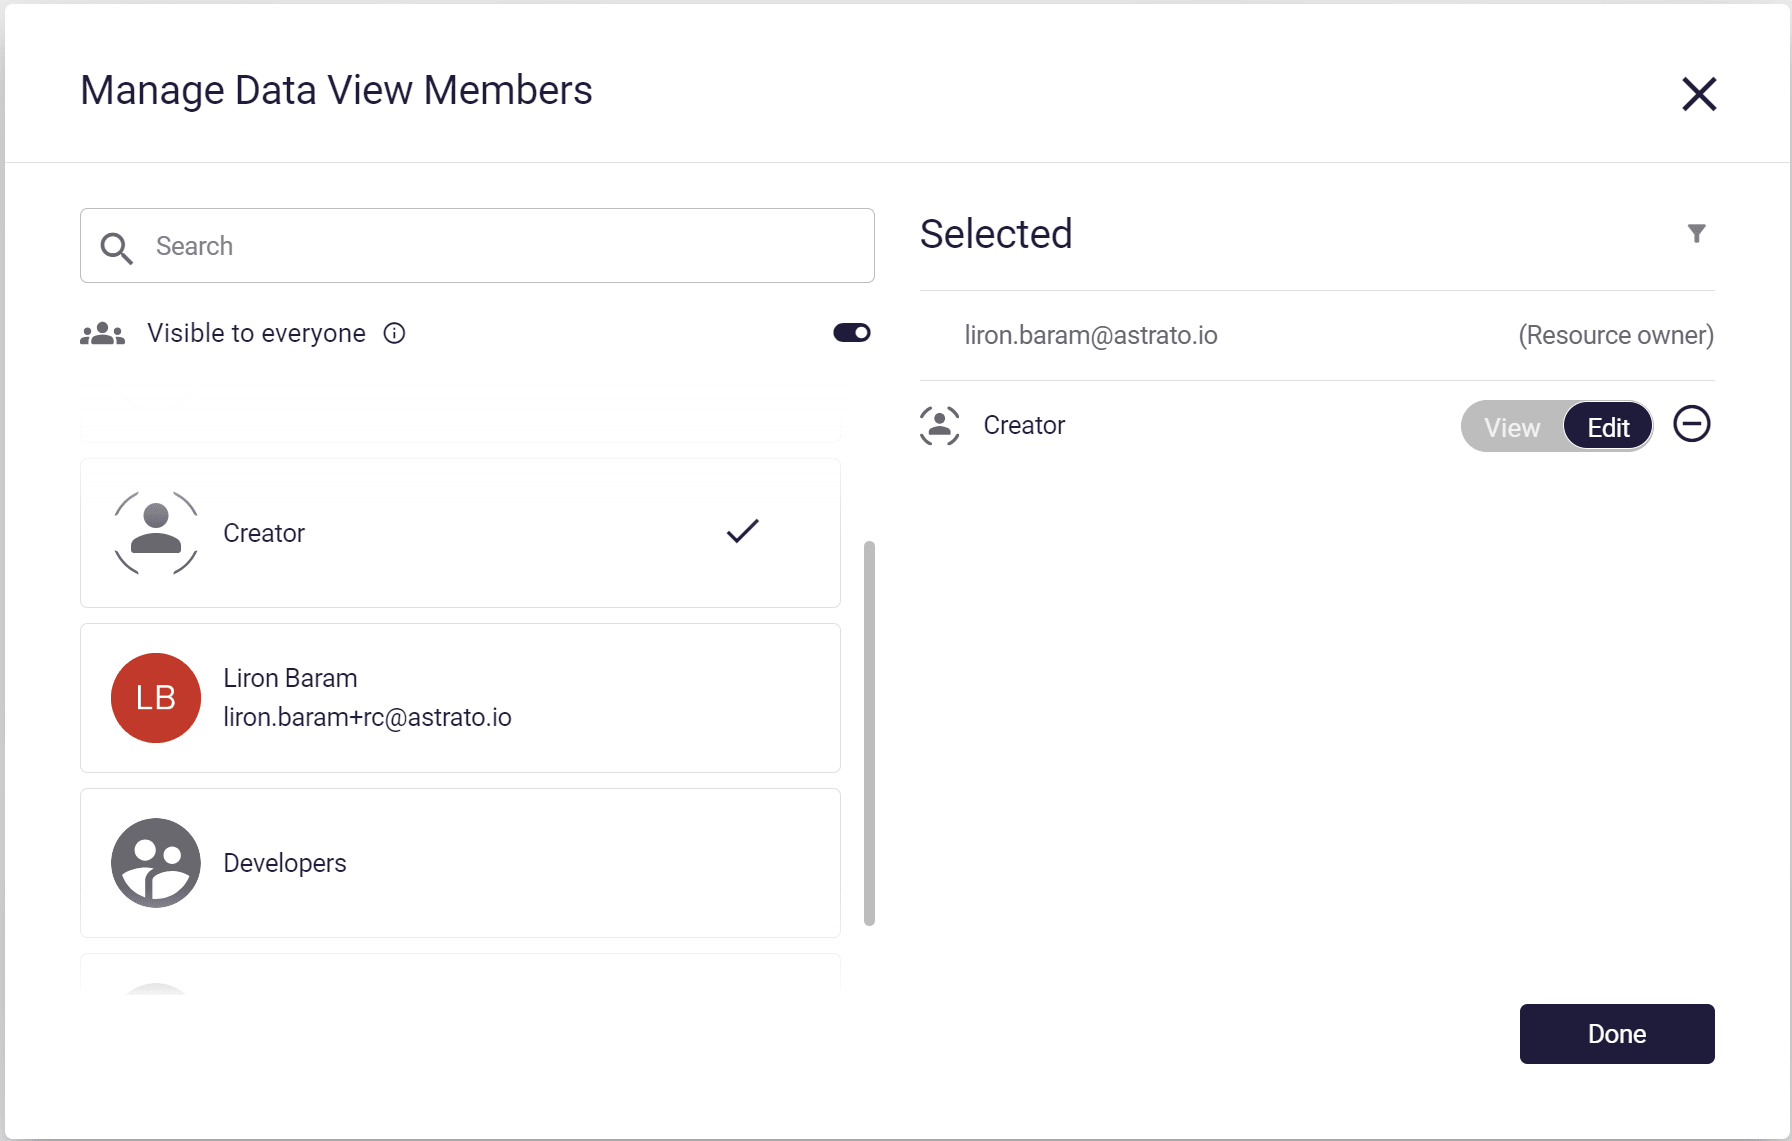
-
Please note that all new assets are created with access granted only to the asset creator and the tenant admins.
Convert the Selected Range of Values to Individual Values
Section titled “Convert the Selected Range of Values to Individual Values”A new and easy way to select a range of numeric values or dates and focus on existing values inside a range.
With this new feature, data exploration is simpler and faster, and dashboards are cleaner with fewer static filter objects on the screen and more exploration options for users.
2.76.1 - 04 June 2024
Section titled “2.76.1 - 04 June 2024”🆕 Fetch dimension action block
Section titled “🆕 Fetch dimension action block”Have you ever wanted to create an animated chart? With the new fetch dimension block it’s easy to fetch all possible/selected/not selected values from a field. The output of the block can be used in loops or for advanced filter use cases or creating cyclic reports to name a few.
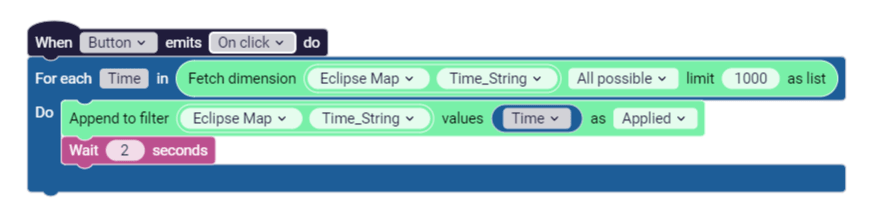
Report parameters and improvements
Section titled “Report parameters and improvements”Reports now support up to 250 pages with high resolution with a DPI factor 2 for crisp, printable reports.
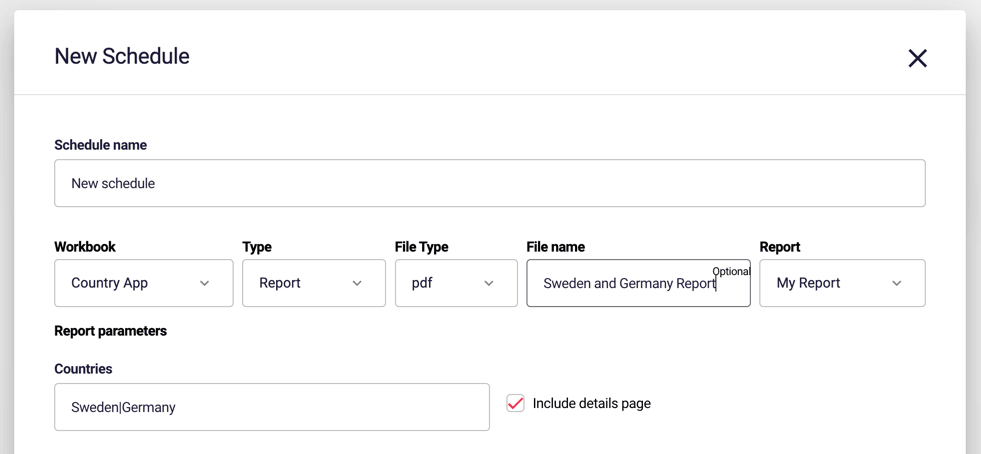
With the addition of parameters you can now reuse the same report in different schedules. Add string, number or boolean parameters to your report definition block and those becomes available in the scheduler or the Send and Open report blocks.
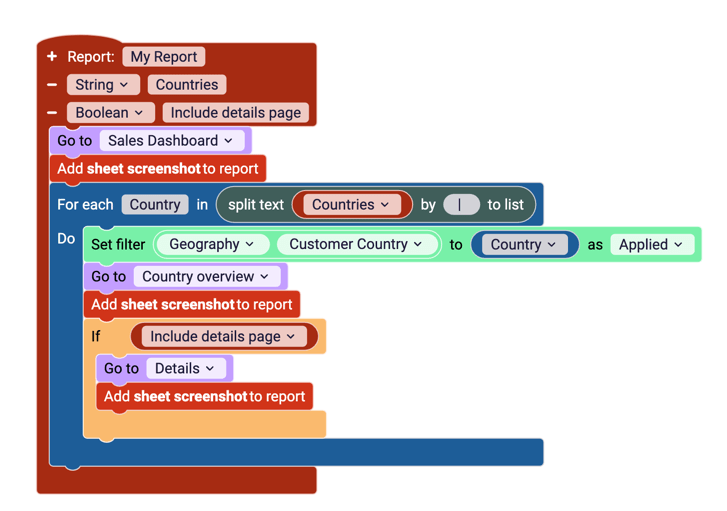
Send report and open report blocks have options to use a custom filename, leave blank for the default, name of the report with a timestamp at the end.
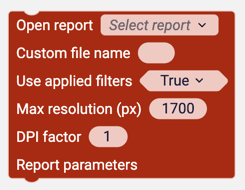
Send report block have options for the Email body and supports the PDF to be encrypted with an optional password.
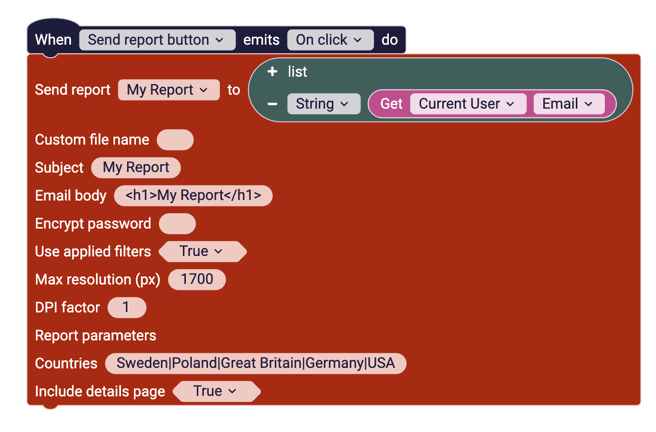
2.76 - 29 May 2024
Section titled “2.76 - 29 May 2024”🆕 Mini Chart Scroll In Line Chart
Section titled “🆕 Mini Chart Scroll In Line Chart”By incorporating mini charts with scroll bars, you ensure that your visualizations remain clear, navigable, and insightful even when dealing with extensive dimension values.
Combo Chart Vertical Display
Section titled “Combo Chart Vertical Display”Combo charts are valuable assets in data analytics. They provide a versatile and powerful way to combine different data visualizations.
They enable deeper insights, efficient data presentation, and enhanced storytelling, making them an essential tool for analysts and decision-makers.
With this new setting, you can display a combo chart vertically to make ranking charts easier to read.
2.75.2 - 21 May 2024
Section titled “2.75.2 - 21 May 2024”Top N Sorting
Section titled “Top N Sorting”Showing the Others record using the TopN feature helps users see the full data context. They can see the significance of the entities’ tail ends.
With this new setting, you can set the other record sorting position.
Improved Date Picker
Section titled “Improved Date Picker”The new version of the Date Picker allows users to navigate between years and months using the new controls easily.
Focusing on a certain range of dates is now simple and easy.
Improved Vertical Line
Section titled “Improved Vertical Line”The new line shape has a setting for a vertical line; this new setting fits the line to the vertical space while disregarding the width of the shape.
This new option will improve the design of data stories and guided analytics dashboards.
2.75.1 - 16 May 2024
Section titled “2.75.1 - 16 May 2024”🆕 Drill-through Actions
Section titled “🆕 Drill-through Actions”drill-down and drill-through functionalities provide a comprehensive framework for data analysis:
-
Multidimensional Insights: Users can gain insights from multiple dimensions and perspectives, starting from broad overviews to in-depth details and related contextual information.
-
Increased Flexibility: These functionalities provide the flexibility to navigate data in a way that aligns with specific analytical needs, improving the efficiency and effectiveness of the data analysis process.
-
Scalable Analysis: They support scalable analysis, accommodating both high-level executives who need summary views and analysts who require detailed data exploration.
With the five new actions, building different use cases of drill-through and drill-down with a complete no-code experience is simple and easy.
-
- This trigger can run a set of actions when the active field in a drill-through dimension is changed.
For example, update a custom label with the active field name, navigate to another sheet, show and hide charts, etc. -
- This action gets the active field in a drill-through dimension; the field is represented in this format: Table Name.Field Name
-
- This action sets a new active field in the drill-through dimension. When used with the a get variable action, the input can be static by selecting a value from the dropdown menu or dynamic by using a variable.
-
- This action changes the active field of a drill-through dimension to the next field in the list.
This action won’t have any effect when the active field is the last field in the dimension.
It’s useful when building drill-down charts -
- This action changes the active field of a drill-through dimension to the previous field in the list.
This action won’t have any effect when the active field is the first field in the dimension.
It’s useful when building drill-down charts.
2.75 - 10 May 2024
Section titled “2.75 - 10 May 2024”🆕 Cumulative Waterfall Chart
Section titled “🆕 Cumulative Waterfall Chart”The new waterfall chart covers the use cases when there is a need to visualize individual entities’ contribution to a KPI’s overall results, for example:
-
Budget Allocation: Waterfall charts can be used to track budget allocations for a project, showing how funds are distributed across different categories, such as labor, materials, equipment, and overhead costs.
-
Sales Performance: Waterfall charts can illustrate changes in sales revenue over time or across different products or regions, showing the contributions from factors such as price changes, volume changes, discounts, and returns.
-
Cost Breakdown: Waterfall charts can break down total costs into individual components, showing how each cost item contributes to the overall cost structure.
Dynamic Custom Labels in Visualizations
Section titled “Dynamic Custom Labels in Visualizations”Custom Labels for dimensions and measures allow the label to change dynamically according to users’ interactions in an app.
Common use case for custom labels:
-
The dimension label changes according to the active field in a drill-through dimension.
-
The dimensions label indicates a filter that is applied in the chart.
-
The measure label indicates the time period of the measure; for example, instead of current year-to-date, it is 2024 year-to-date, and it changes dynamically when a year changes.
New Default Display for Text Object
Section titled “New Default Display for Text Object”A new design option to control the display of long texts allows you to opt for an ellipsis mode and define a static number of rows for the text display.
Or opt for a responsive display that automatically adapts the text size and number of rows.
Ellipsis mode is the default option for all new text objects.
Input Box Deprecatation
Section titled “Input Box Deprecatation”The Input Box (the first version of the input form) will be deprecated from this version forward.
Instead, multiple Atomic Input objects replace the input box.
All existing input boxes will continue to work; there will be no option to create new input boxes.
2.73.1 - 29 April 2024
Section titled “2.73.1 - 29 April 2024”🆕 Axis scroll support for Dot plot, Bar-, Combo- and Line chart
Section titled “🆕 Axis scroll support for Dot plot, Bar-, Combo- and Line chart”With this new option to limit the visible domain and add a scroll bar to the Dot plot, Bar-, Combo- and Line chart, the chart can tell a more focused and detailed story without losing the context of the entire dataset.
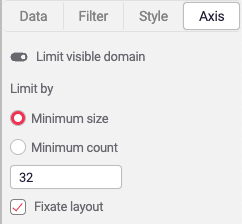
Bar chart example with scroll bar.
2.73 - 17 April 2024
Section titled “2.73 - 17 April 2024”🆕 Top N Analytics
Section titled “🆕 Top N Analytics”In analytics, the term “Top N” refers to the highest-ranking or performing items in a given set according to some measurable criteria. “N” stands for a numerical value that you specify when you want to limit your analysis to a certain number of top items. This is commonly used in business intelligence and data analysis to identify and focus on the most significant data points out of a larger dataset.
For instance, here are a few examples of how “Top N” might be used:
-
Top 10 Best-Selling Products: This would refer to the 10 products that have sold the most units over a certain period.
-
Top 5 Most Visited Pages on a Website: This would indicate the five pages that receive the most traffic.
-
Top 3 Regions in Sales: This might identify the three geographic regions that contribute the most to a company’s sales revenue.
-
Top 20% of Customers: This could be used to describe the customers who are responsible for the top 20% of a company’s sales or profits, a principle also known as the Pareto principle or the 80/20 rule.
The “Top N” analysis is useful for prioritizing actions, allocating resources, or focusing on areas that have the most significant impact on the overall performance of a business or system. It’s also a common feature in reporting and data visualization tools, where you can dynamically filter dashboards or reports to display only the top performers based on the selected metric.
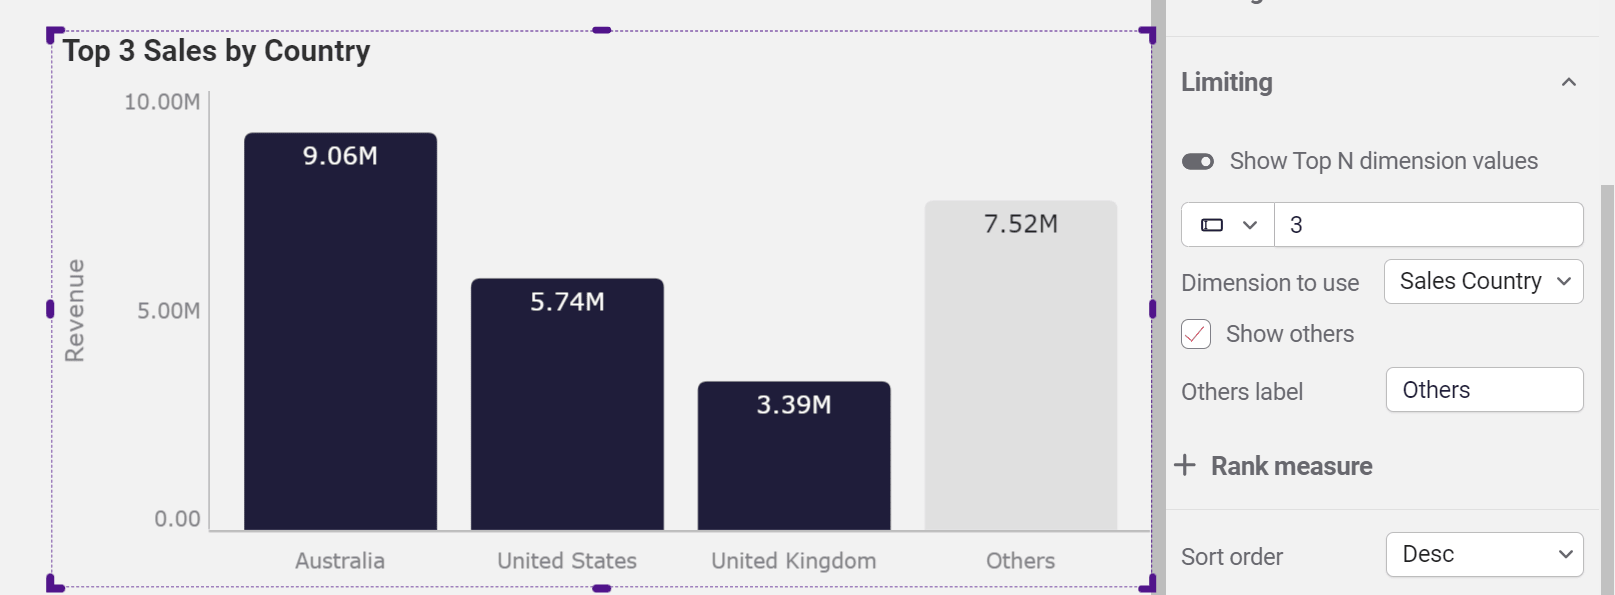
Exporting from embeds
Section titled “Exporting from embeds”Embed now support exporting data and images/PDF via the context menu! 🥳
ℹ️ to enable export on existing embeds, please see our support article for more guidance
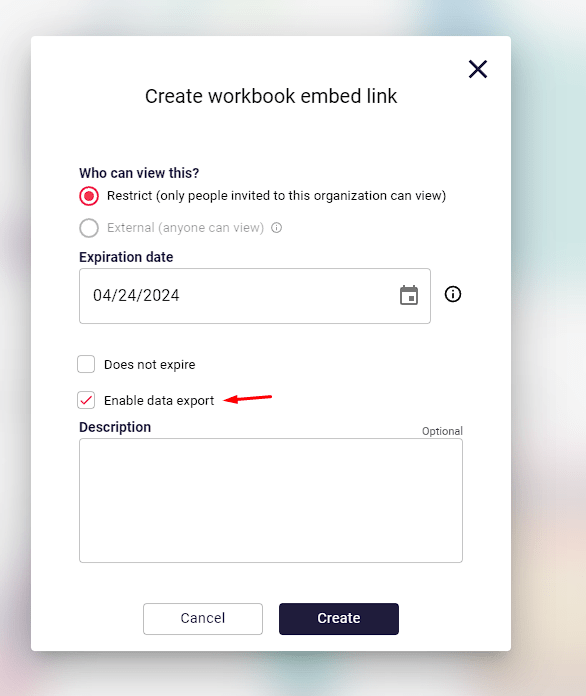
2.71 - 04 April 2024
Section titled “2.71 - 04 April 2024”🆕 Pivot Table in Custom Report
Section titled “🆕 Pivot Table in Custom Report”Pivot tables are among the most powerful data exploration tools, enabling users to slice and dice through data and uncover insights.
Introducing the pivot table into the custom report now enables users to easily add and replace dimensions and measure through their exploration, taking data exploration to the next level.
Dimensions and Measures Groups in Custom Report.
Section titled “Dimensions and Measures Groups in Custom Report.”Measures and dimension groups in the custom report assist end-users in finding the relevant dimensions and measures to their business questions, speeding up and making data exploration more efficient and simple.
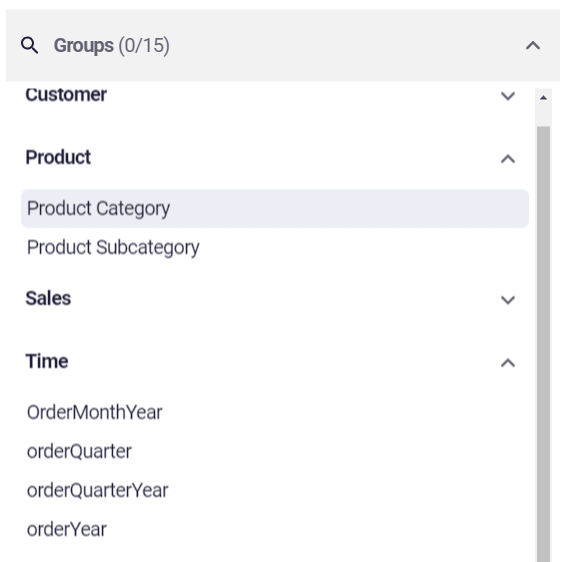
🆕 Stored Procedure Action Blocks
Section titled “🆕 Stored Procedure Action Blocks”Astrato’s Data apps just became even more powerful with the addition of a stored procedure action block.
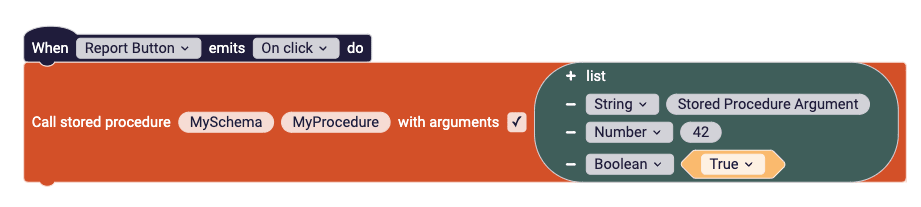
Using this action opens up new use cases:
-
Loading relevant external data on the fly and combining it with internal data to uncover new insights.
-
Write back data and then call on AI models to analyze and store the new data.
-
Refreshing data when a stored procedure is needed
There are many more use cases to take advantage of this new feature.
2.70 - 27 March 2024
Section titled “2.70 - 27 March 2024”AI Insight Object Support More Visualizations
Section titled “AI Insight Object Support More Visualizations”The AI Inisigts objects now support these types of visualizations:
Sankey, Dot Plot, Word Cloud, Waterfall.
Using AI insights helps users uncover hidden insights in the above visualizations. It can also increase users’ data literacy by training them to read the above types of visualizations.
New Actions
Section titled “New Actions”-
Exit Sheet - define a list of actions to be performed when leaving a specific sheet.
-
In data apps and writeback it’s important to separate if a value have changed or not. To help with that we are releasing new action blocks to help with that task.
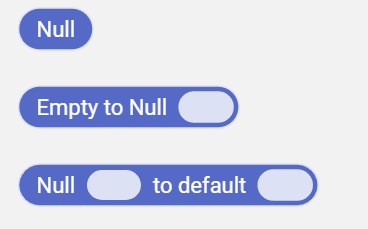
-
Null - Use to writeback Null value
-
Empty to Null - Convert empty values to Null
-
Null to default - Outputs value unless it’s Null, then it outputs the default input value
-
-
Cast string to number - convert strings to numbers

-
Get\Set Sheets Property - get a sheet property or change it via actions, current available properties: Visibility and Title
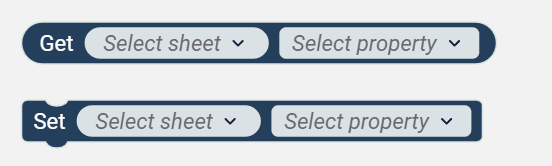
2.69 - 25 March 2024
Section titled “2.69 - 25 March 2024”🆕 Dot Plot chart
Section titled “🆕 Dot Plot chart”Our new dot plot visualization is great for uncovering high-level and detailed insights in one chart.
The dot plot supports these use cases:
Compare the distribution of users by age and gender for products, showing the overall distributions and the individual user value for all of your users.
Read the documentation
Save Tables Layout
Section titled “Save Tables Layout”Tables layout in the semantic view can be saved and retrieved.
So whether you prefer star schema or tree, you can arrange the tables in your preferred way.
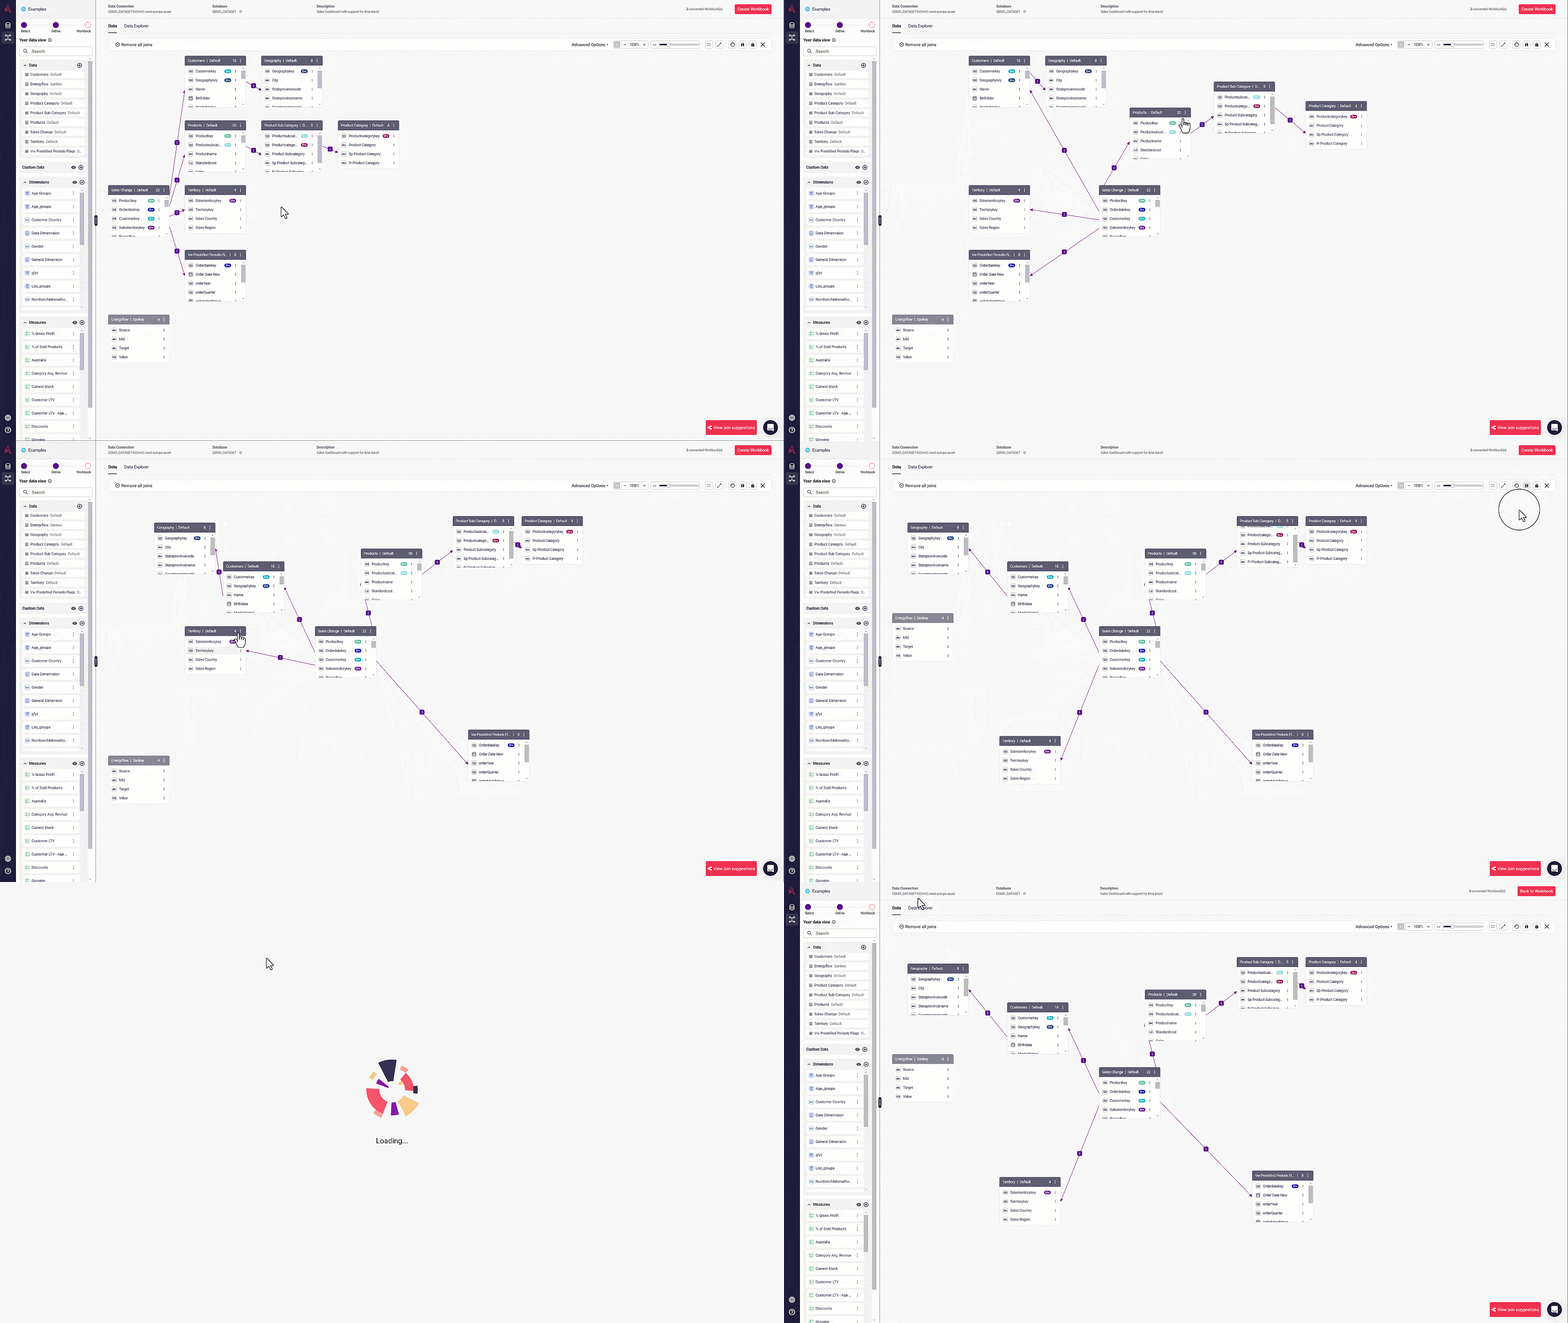
2.68.18a - 19 March 2024
Section titled “2.68.18a - 19 March 2024”🆕 Map Visualization: Heat map Layer
Section titled “🆕 Map Visualization: Heat map Layer”Our new heat map layer is here, as our 4th map layer - extending geospatial analytics. Our heat map is highgly customisable, enabling color customisation, multiple ways to adjust scale and intensity to match the meaning of your data, creating a familiar map experience for all of your users. Read the documentation
2.68.18 - 12 March 2024
Section titled “2.68.18 - 12 March 2024”Advanced calculations: Enhanced user experience and description
Section titled “Advanced calculations: Enhanced user experience and description”Advanced calculations now have descriptions in tooltips for each component, making familiarisation effortless. We’ve renamed a couple of components to make it easier for you. Thank you all for the early feedback!
🆕 Smart data labels for the scatter and line chart
Section titled “🆕 Smart data labels for the scatter and line chart”Enhanced labeling has arrived at the line and scatter chart 🙌
We all know we can’t label every data point, otherwise we’d not be able a thing, they’d all overlap! We’ve introduced super smart labels that will never overlap. Understand the shape and scale of your data at a glance with our smart labels without relying on aligning with axes, gridlines, or tooltips. - great for scheduled reporting!
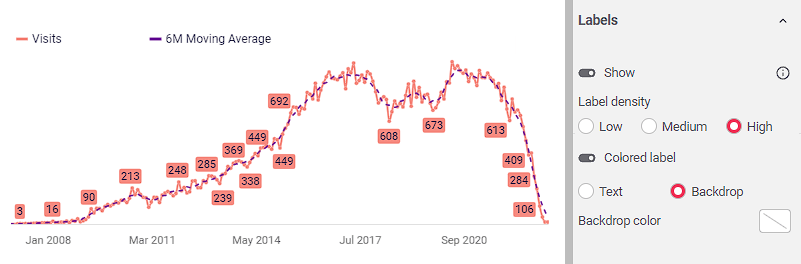
🆕 Searching in Filters
Section titled “🆕 Searching in Filters”We have a new unified approach to searching across various elements, including tables, schemas, semantic layers, workbooks, connections, and user information. This functionality spans both frontend and backend operations, facilitating efficient navigation and data manipulation within our system. Our search uses pushdown SQL, which runs ultrafast, super flexible, and always up to date. Find exactly what you are looking for, searching from hundreds to even billions of rows.
The example below - you can try it out here on our gallery by adding a new filter. Condition Description
To learn more about searching in filters, check this article.
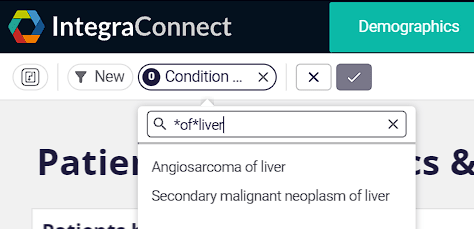
🆕 New user role: Designer
Section titled “🆕 New user role: Designer”Ideal for citizen developers, our new designer role offers access to create and edit workbooks without the ability to manage data connections and views.
Let your creativity flow, working on unchanging governed data, using already created dimensions and measures.
ℹ️ The new designer role can be accessed from the admin section
Gartner: A citizen developer is an employee who creates application capabilities for consumption by themselves or others, using tools that are not actively forbidden by IT or business units. A citizen developer is a persona, not a title or targeted role. They report to a business unit or function other than IT.
🆕 Bookmarks: Introducing the Enhanced Bookmarks Panel
Section titled “🆕 Bookmarks: Introducing the Enhanced Bookmarks Panel”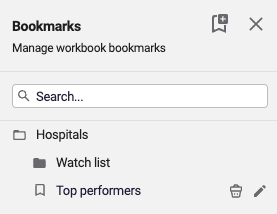
We’re excited to announce a significant update to our bookmarks feature! With the new Bookmarks Panel, users now have the ability to organise their bookmarks more efficiently using a folder structure.
Creating and Organizing Bookmarks:
-
When adding or editing a bookmark, simply use the “Folder” field to specify the folder where you’d like to place the bookmark.
-
To create a subfolder within a folder, use the “/” symbol. For example, entering “Work/Projects” in the Folder field will create a “Projects” subfolder under “Work”.
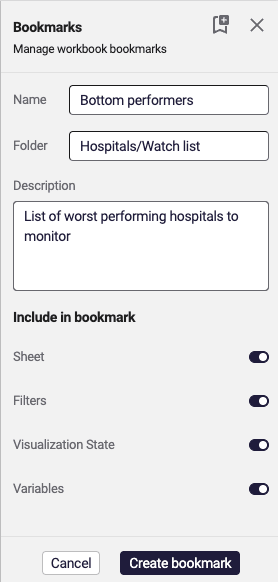
This update is designed to make bookmark management more intuitive and structured, allowing you to navigate your saved sites with ease.
2.66 - 22 February 2024
Section titled “2.66 - 22 February 2024”🆕 Advanced Chart Calculation
Section titled “🆕 Advanced Chart Calculation”in-chart 📊 advanced calculations in your analytics:
📆 Period on Period (# or %) for comparative analytics.
📈 Moving Averages for powerful trend analysis, filtering out the noise in the data
📶 Running/Accumulating Total - transform monthly sales into a visible YTD total visualization.
Implemented with just a click in the UI by any business user: no scripting Astrato writes the SQL for you.
To learn more about advanced Chart calculation, check out this article.
Improved Variable Panel
Section titled “Improved Variable Panel”The experience working with variables just got so much better. Enhancements include:
-
Filter to a specific variable type.
-
Improved variable search.
-
New filter creation improved the experience.
2.65 - 16 February 2024
Section titled “2.65 - 16 February 2024”🆕 Frame Properties Panel
Section titled “🆕 Frame Properties Panel”The new frame properties panel consolidates all the common properties of visualization in one place, making it easier and quicker to customize the visualization display, including new properties such as precision size and position.
To learn more about the frame properties panel, check out this article.
Titles in all visualizations
Section titled “Titles in all visualizations”Titles and subtitles are important parts of the story a visualization tells.
With the frame properties panel’s introduction, all visualizations in Astrato now support titles and subtitles.
Copy Actions Between Workbooks
Section titled “Copy Actions Between Workbooks”Action blocks can now be copied between workbooks; this new feature will speed up data app development and reduce repetitive tasks.
2.64.1 - 14 February 2024
Section titled “2.64.1 - 14 February 2024”Quick rename object
Section titled “Quick rename object”Double click the object or group in the layers panel to quickly rename it.
Action blocks updates
Section titled “Action blocks updates”In this release we added new capabilities to lots of the action blocks, see below on what have change.
ℹ Changes & Deprecations for Action blocks
Section titled “ℹ Changes & Deprecations for Action blocks”Some blocks (get/set variable, write-back, execute sql, call stored procedure, open report) have been deprecated as of February 2024, these will need to be replaced by the new blocks with new capabilities, by April 2024.
How to update deprecated blocks
Section titled “How to update deprecated blocks”-
Add the new version of the block to the action workspace
-
Configure it the same as the block to be updated
-
Move the new block above the deprecated block in the block chain
-
Remove the deprecated block
-
Repeat for all deprecated blocks
Invert block is now the Not block

The invert block has a new label Not to make action chains more readable. The Not block changes the boolean input, if the value is true to false and if the value is false to true.
Variables blocks
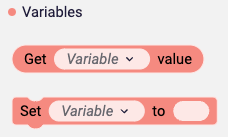
The get and set variable blocks now except a block that outputs a string value for the variable name input. This makes it possible to reference variables by name, to support more advanced use cases.
SQL blocks
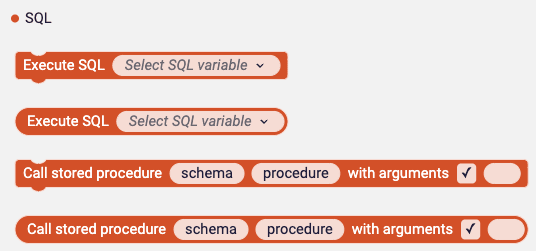
The SQL blocks have been updated with new labels to improve readability. The schema input has been removed from the Execute SQL block.
The Execute SQL blocks now except a block that outputs a string value for the variable name input. This makes it possible to reference variables by name, to support more advanced use cases.
The Write-back block
The write-back block now except a block that outputs a string value for the Field name input. This makes it possible to reference fields by name, to support more advanced use cases. The block has also got an new distinct color to improve readability and set it apart from other blocks.
Aggregate block
The Aggregate have improved labels for better readability.
Report blocks
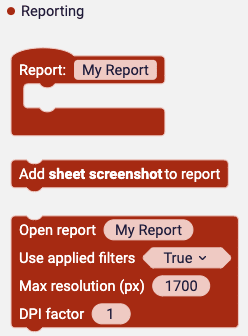
The Report blocks has a new distinct color to improve readability and set it apart from other blocks. The open report block have new capabilities.
Use applied filters - If set to true the current applied filters will be passed to the report when it’s generated. With this Astrato now support On demand report generations and truly dynamic cyclic reporting.
Max resolution (px) - Use this setting to control the height and width of the report. Depending on the aspect ratio of the sheet, the max resolution will be applied to the height if the aspect ratio is higher than wide, or the width if the aspect ratio is wider than high. If no aspect ratio is set on the sheet, A4 Landscape will be used.
DPI factor - Use 2 to double the pixel count when the report needs to be printed on paper. This affects the size of the report and the time to generate the report.
2.63.1 - 07 February 2024
Section titled “2.63.1 - 07 February 2024”🆕 Sankey Chart
Section titled “🆕 Sankey Chart”Our new Sankey chart gives users a view of data flow between dimensions.
Sankey chart insights identify the significance of a path that connects all the dimensions in the chart.
Sankey chart common use cases are:
-
Energy Flow Diagrams
-
Material Flow Analysis
-
Cost Allocation Diagrams
-
Supply Chain and Logistics
-
Website Traffic Flow
-
Population Migration
-
Carbon Footprint Analysis
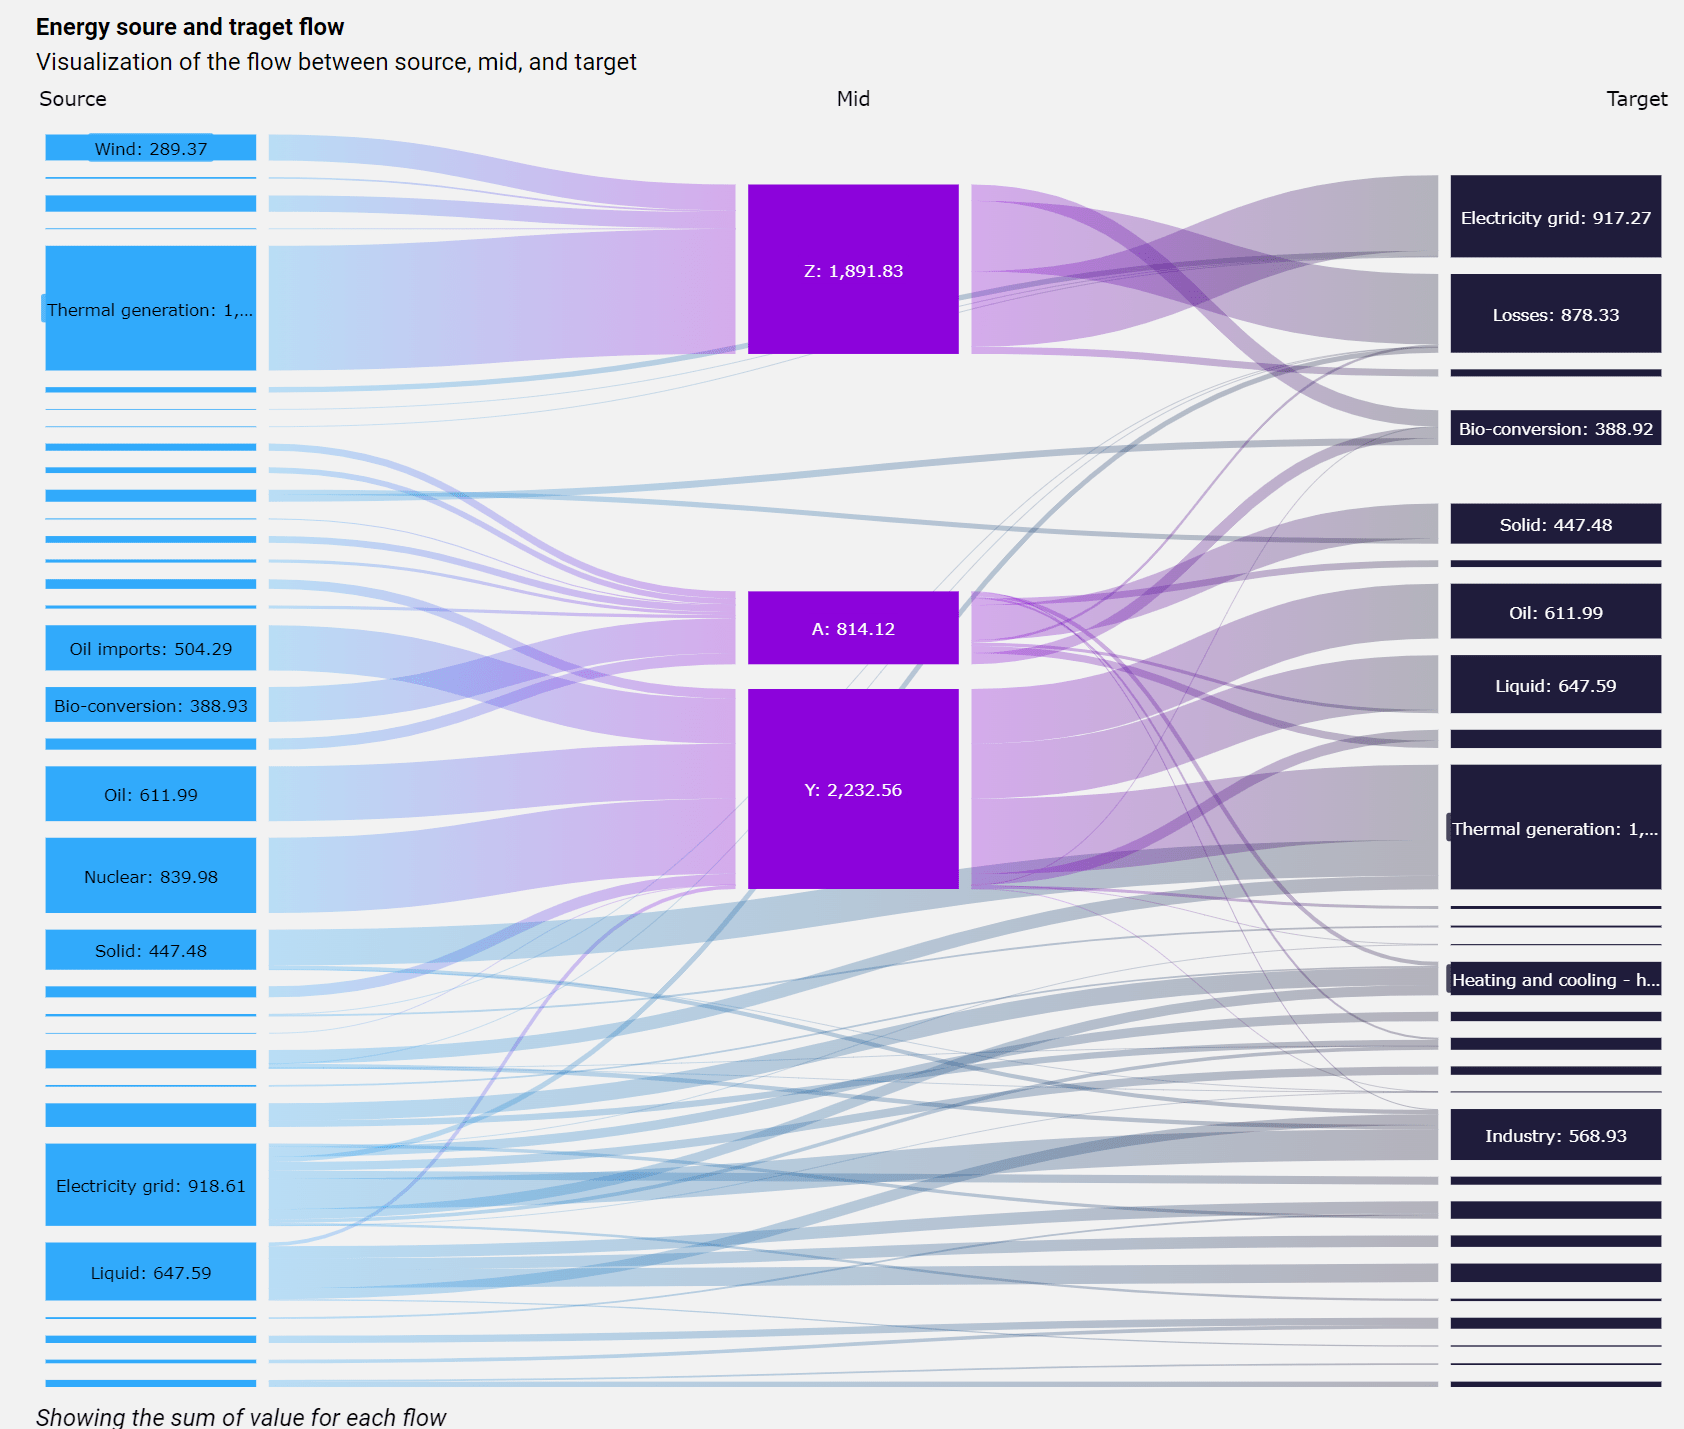
ℹ Changes & Deprecations for Action blocks
Section titled “ℹ Changes & Deprecations for Action blocks”Some blocks (used to get/set object properties) have been deprecated as of February 2024 (initial release 13th March 2023), these will need to be updated to the new blocks defined in the article below, by April 2024.
🆕 Access removed workbooks
Section titled “🆕 Access removed workbooks”
When a workbook is deleted, it can only be viewed in the “removed” tab of the user who originally created it. If someone other than the creator deletes the workbook, they won’t see it in their “removed” tab. Additionally, if the creator has left the tenant, they won’t see the deleted workbook, but if they return to the tenant before it’s hard deleted, they will still be able to view it.
-
When restoring a workbook, previous embedded links will need to be recreated
-
If the semantic layer is removed, recovery of the workbook will not be possible.
-
If a report was scheduled on a workbook that has later been removed, it will fail
-
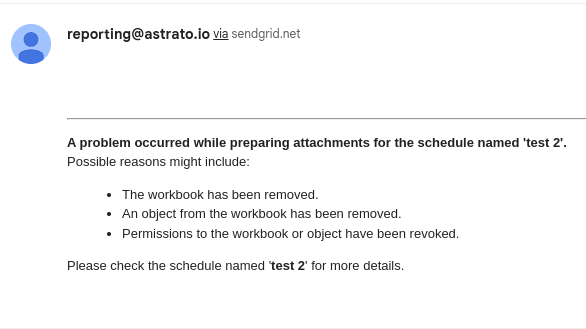
2.62.7 - 05 February 2024
Section titled “2.62.7 - 05 February 2024”Workbook Editor: Reference lines variable input
Section titled “Workbook Editor: Reference lines variable input”Variables can now be used to drive reference lines.
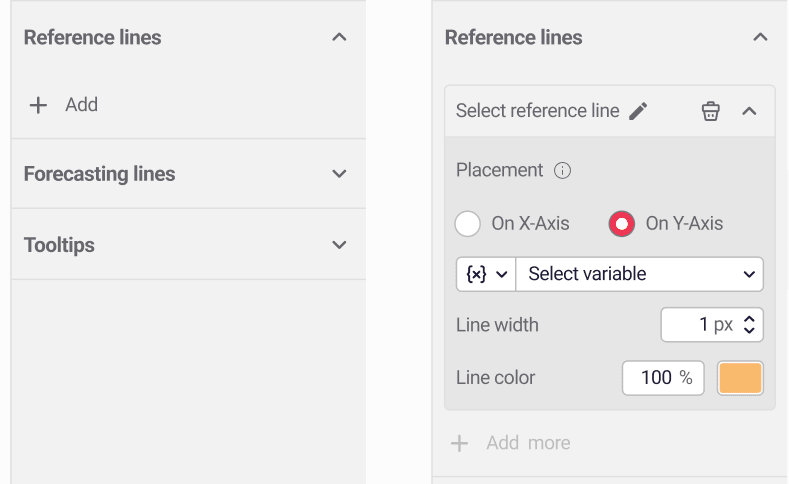
💡 Use case: Data-driven reference lines
Variables in Astrato are extremely powerful, even more so when combined with actions and visualizations, enabling new ways of dynamic data storytelling. In under 60 seconds, see how we use variables as part of our own Astrato workbooks.
2.60 - 25 January 2024
Section titled “2.60 - 25 January 2024”Workbook Editor: Object/Layer naming
Section titled “Workbook Editor: Object/Layer naming”We have improved the workbook editor experience by making object management and identification easier. This will make identifying objects for use in Actions and Astrato AI Insights, and more, as we continue to grow the capabilities in the product.
-
New Naming System: Objects will have unique default names (e.g., “Filter1,” “Filter2”).
-
Distinct Naming Rule: Objects can be renamed to the same name, however these will be made unique, by the system adding a unique number at the end.
-
Copying Objects: Duplicated objects will receive additional numbers at the end to make the name
-
You will notice: Automatic update to all object names for seamless transition - nothing for you to do.
Embedded Analytics: Embed Expiration and Description
Section titled “Embedded Analytics: Embed Expiration and Description”Embeds are now even easier to manage, with expiry enabled and a description to describe each use case.
2.54 - 18 December 2023
Section titled “2.54 - 18 December 2023”New Data Selection Panel - Semantic View
Section titled “New Data Selection Panel - Semantic View”-
The new select panel works 50% faster than the previous one.
-
Select tables quicker.
-
Support any number of schemas and tables.
Bug Fixes
Section titled “Bug Fixes”-
Table Limit: setting a table limit in the properties panel is now reflected in the table.
(This setting is only recommended to be used when using a straight table)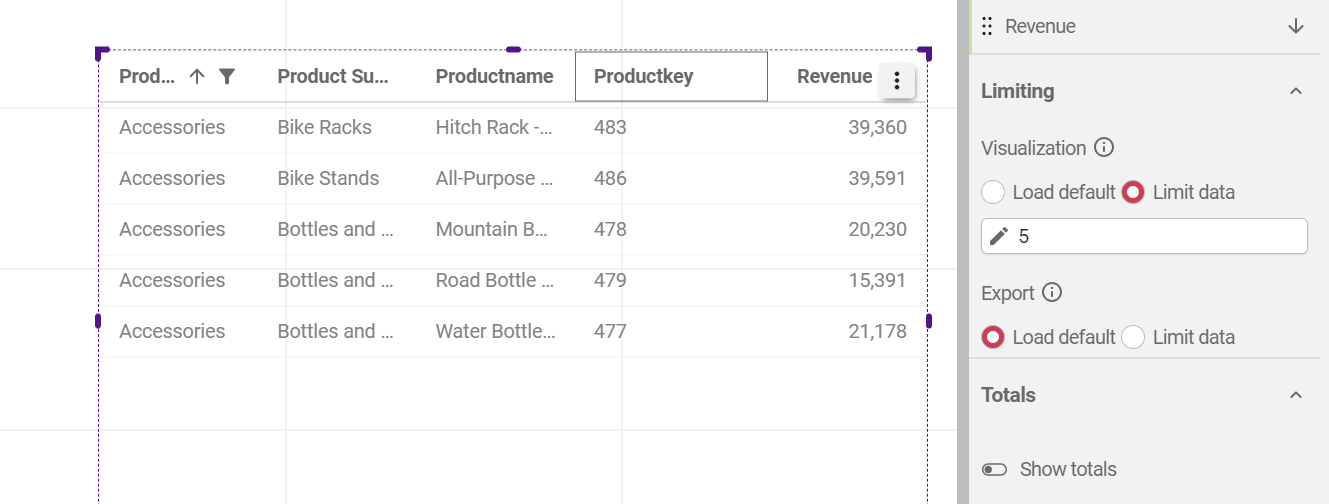
-
Global filters support in combination with “Full Outer Join”:
Global filters are now applied to visualizations that have the show all from a dimension activated.
2.53 - 15 December 2023
Section titled “2.53 - 15 December 2023”Actions: Fetch Dimension
Section titled “Actions: Fetch Dimension”Fetch dimension, reads in values from a given dimension, to help you make truly data-driven, guided analytics dashboard and data apps.
This action block loops through a given field, and filters on each value, to generate a report.
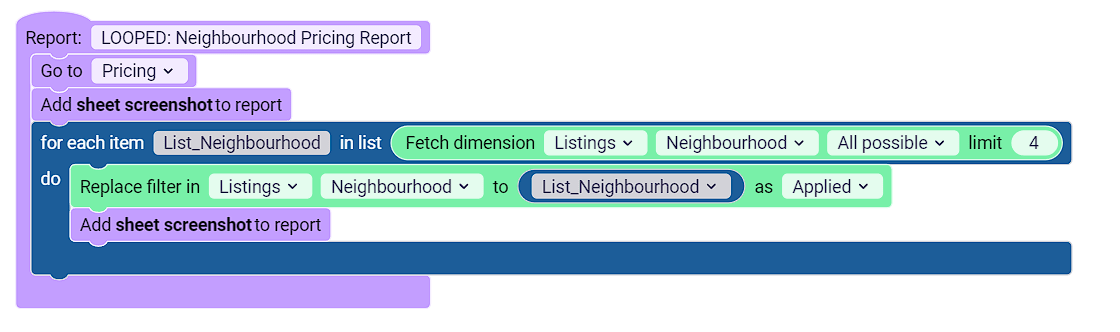
Scheduled reporting
Section titled “Scheduled reporting”Scheduled dashboard reporting isn’t just a relic of the past; it’s the espresso shot in your data-driven morning. Imagine you’re running a 24/7 operation. Real-time dashboards are great, but what you need is a snapshot at specific intervals to see trends, anomalies, or even the calm before the storm.
-
Generate reports in Astrato, on-demand
-
Schedule emailed PDF reports for on-the-go analytics
2.52 - 11 December 2023
Section titled “2.52 - 11 December 2023”Measure Axis Brushing and Filtering
Section titled “Measure Axis Brushing and Filtering”-
Filter your data by defining a range on the measuring axis and answering business questions like focusing on customers with less than three orders.
-
Supported only on Bar Chart, Combo Chart, and Line Chart.
Change the data-view for a workbook
Section titled “Change the data-view for a workbook”-
Changing the data-view for a workbook to move from different environments, for example, from Development to Production.
-
Get the summary of the difference between the source and target data-views, including measures, dimensions, fields, and tables.
Bug Fixes
Section titled “Bug Fixes”-
Duplicating a published workbook resulted in errors in visualizations.
-
Show the impact of global filtering in a chart when the ignore global filtering is disabled.
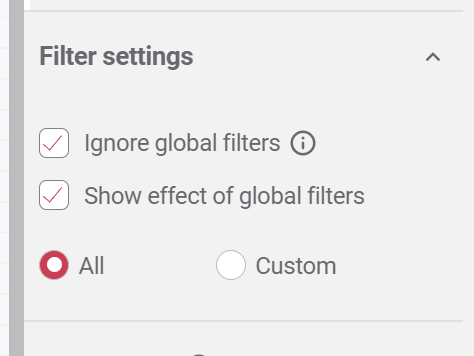
2.51 - 05 December 2023
Section titled “2.51 - 05 December 2023”Change the data connection for a data-view
Section titled “Change the data connection for a data-view”-
Changing the data connection for a data-view to move from different environments, for example, from Development to Production.
-
Get a different summary if there are missing fields in the Target environment.
Bug Fixes
Section titled “Bug Fixes”-
Weekday in dynamic range filters.
-
Deletion of a media gallery object doesn’t sync with reference objects.
2.49 - 21 November 2023
Section titled “2.49 - 21 November 2023”Workbook Objects: Pivot Table - Improved row expand, reordering
Section titled “Workbook Objects: Pivot Table - Improved row expand, reordering”-
Dragging and reordering: Reordering dimensions apply for both Pivot and expandable table, using the chips in the table
-
Expand and collapse: now improved for pivot and expandable table
-
Auto column width: Cells in the pivot fit to screen as best as possible. Scrolling is used where necessary, depending on the min width set.
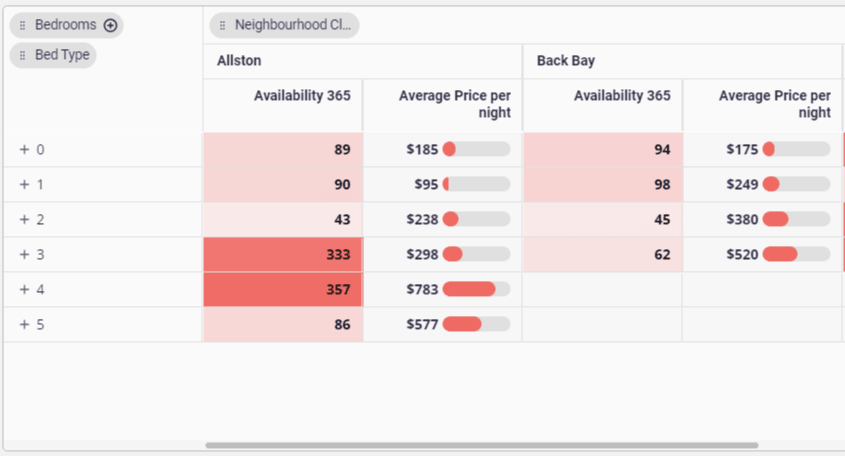
Workbook Objects: Custom report - data sets
Section titled “Workbook Objects: Custom report - data sets”One custom report, for many use cases. Data sets introduce the option of having different sets of dimensions, measures and filters, all available in a single custom report object!
Additional information:
-
Defer layout settings have been moved to the data sets, instead of the previous global setting.
-
Other properties have changed placement, and we added the ability to change the Font and font style.
-
Dimensions and measures can be used in different data sets.
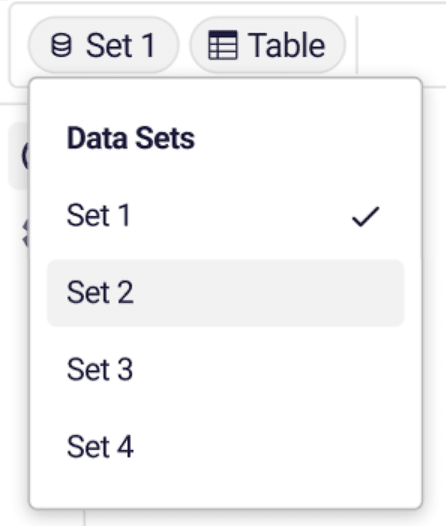
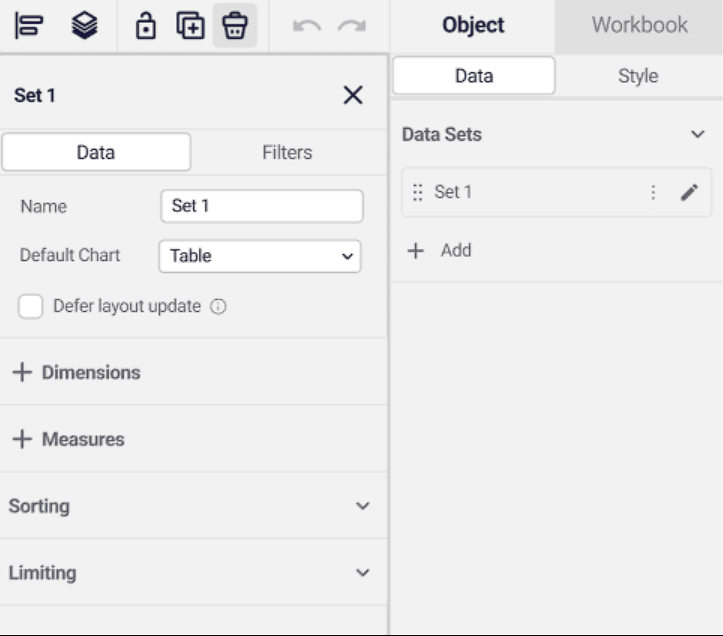
AI Insights: Analyze whole dashboard
Section titled “AI Insights: Analyze whole dashboard”A whole dashboard can be easily analyzed using Insights Describe. This can also be added to the sheet using the Insights Describe object.
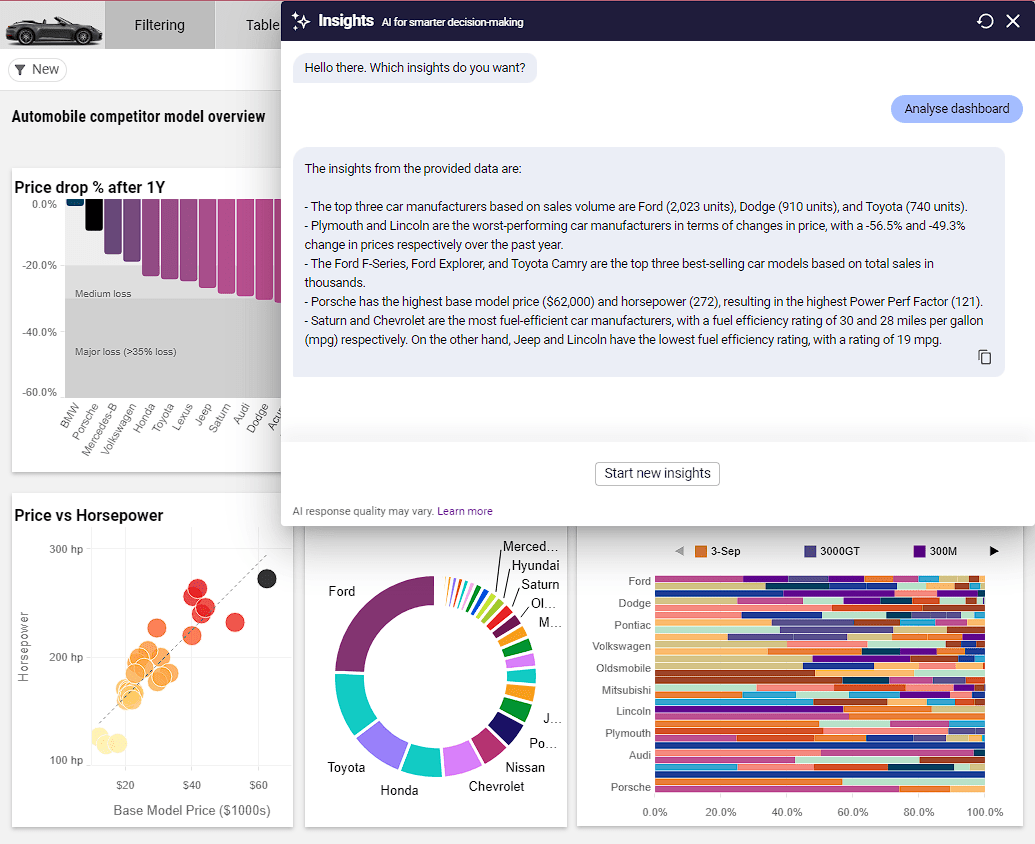
Workbook: AI Title Generation
Section titled “Workbook: AI Title Generation”Simplify charting with effortless titles! We generate titles, subtitles, and footers for your charts based on the SQL query used in the visualization. Save time for analysis and deep work. Update, store, or disable titles as needed.
User management: Groups
Section titled “User management: Groups”Groups can be used for managing access to:
-
Data Connections
-
Workbook Collections
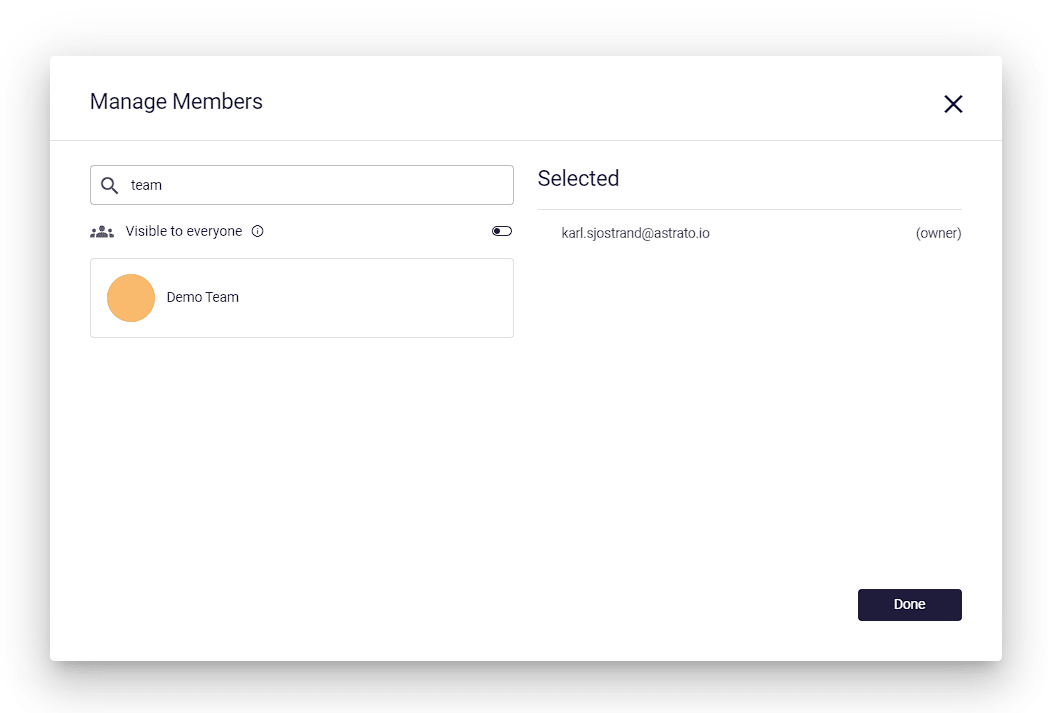
Enterprise Authentication: Azure SCIM
Section titled “Enterprise Authentication: Azure SCIM”You can now integrate Azure for SSO and SCIM provisioning, manage users and groups, and configure enterprise applications. True enterprise user provisioning for Astrato.
Learn more in Enabling SCIM (Active Directory) for Astrato
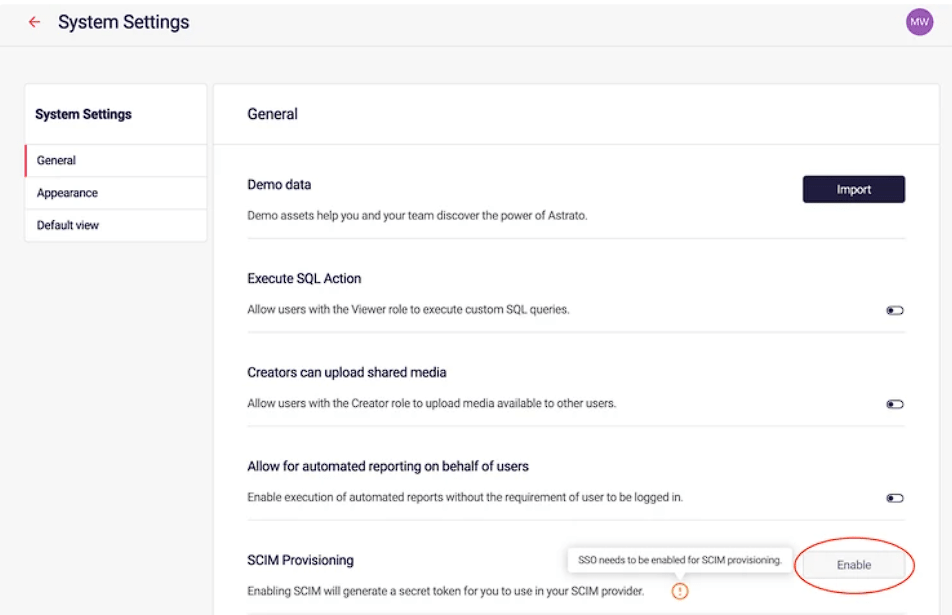
Semantic Layer: Semantic layer Static Filters
Section titled “Semantic Layer: Semantic layer Static Filters”Set a Static filter on the source tables in your semantic view. Focus users on the relevant part of the your source data without the need to create a view. Limit the dataset size by applying filter on larger volume tables.
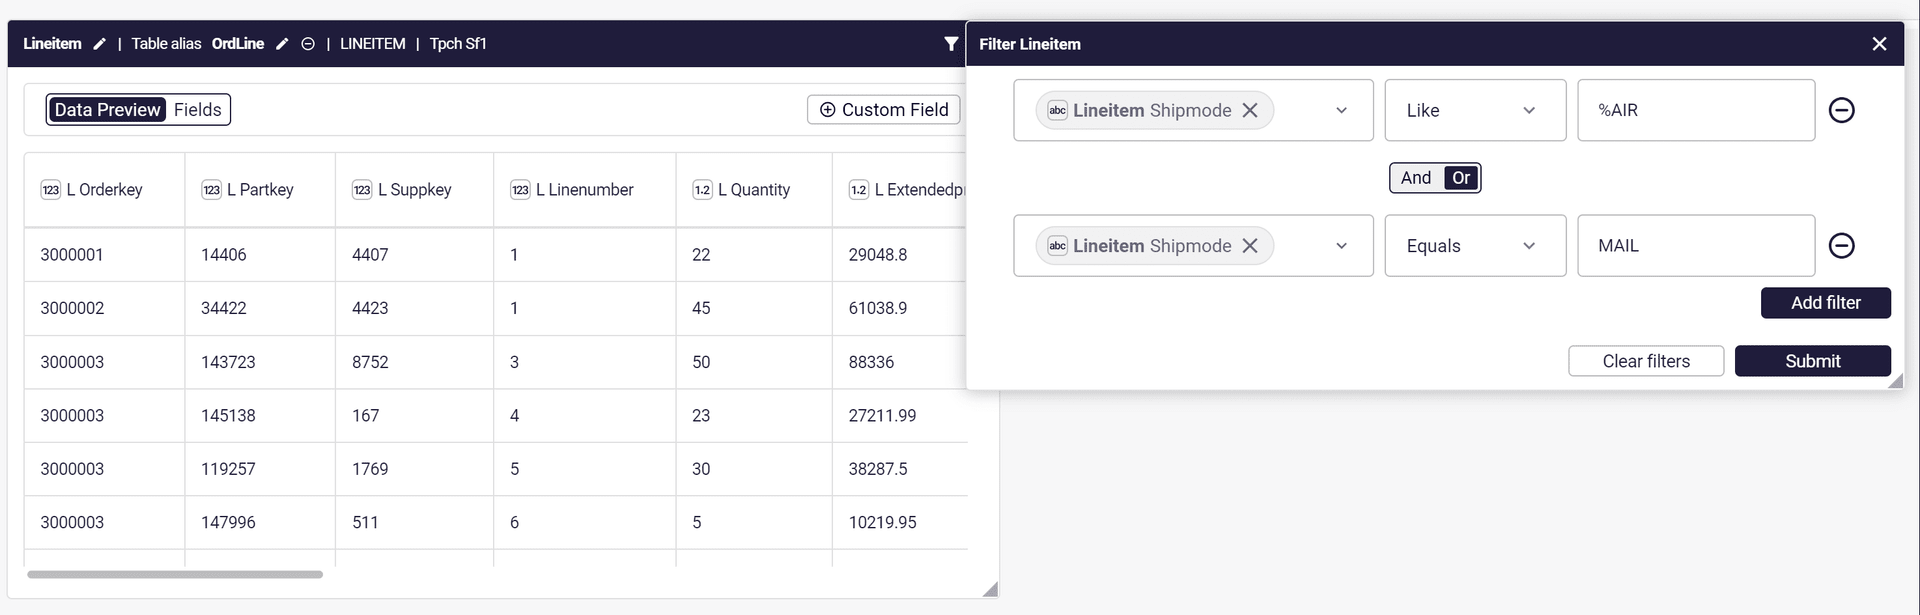
Semantic Layer: Field Comparison Filter
Section titled “Semantic Layer: Field Comparison Filter”Compare field values directly within measures. Ideal for identifying underperforming products or service level discrepancies.
Answer a broader range of data questions such as:
-
Show sales only when sale price is lower than list price - to identify lagging products.
-
Show orders only is delivered date is earlier or equal promised date - find service level
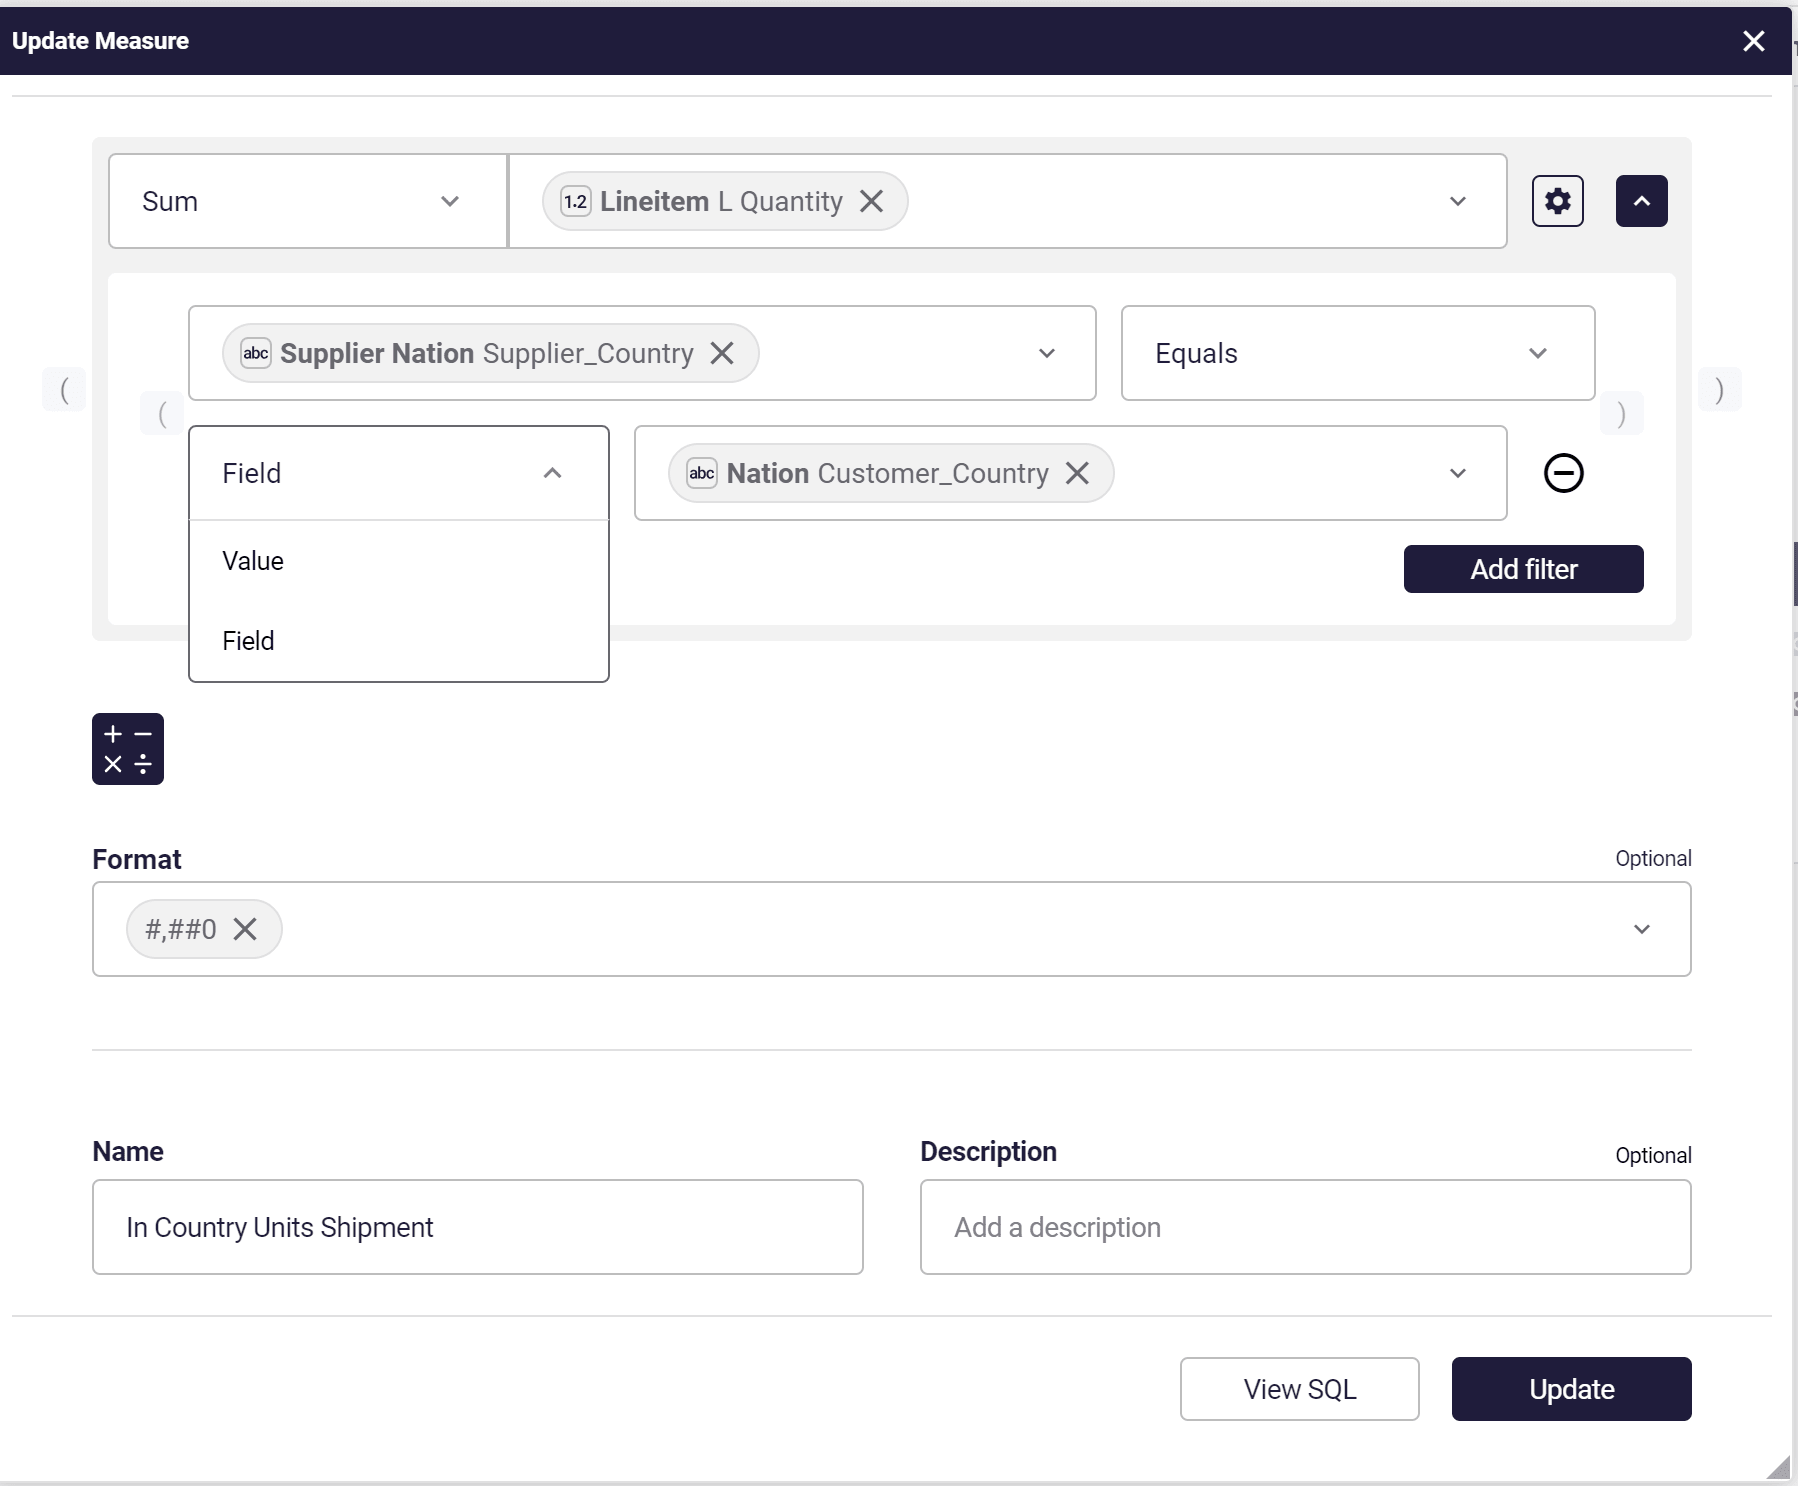
Actions: Lists & loops
Section titled “Actions: Lists & loops”Actions can now be repeated to iterate through lists, opening up many more use cases and reducing the number of repeated action blocks.
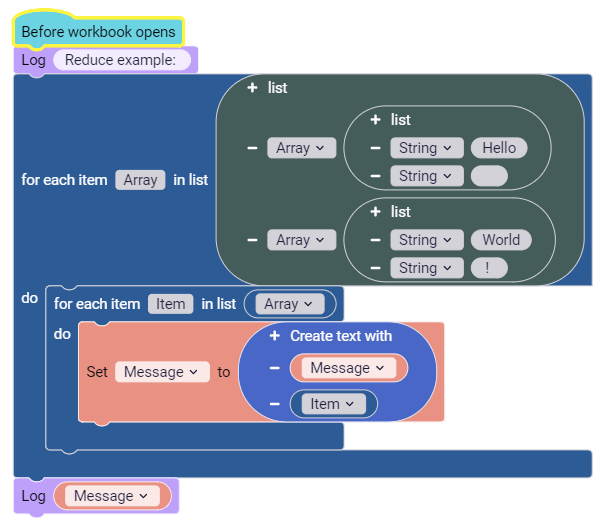
2.48.6 - 07 November 2023
Section titled “2.48.6 - 07 November 2023”Actions: Get/Set [Category] - Set object properties
Section titled “Actions: Get/Set [Category] - Set object properties”In our Get [Category] block we have added the ability to change object properties including:
-
titles (title, subtitle, footer)
-
position
-
margin
-
padding
-
border (type, width)
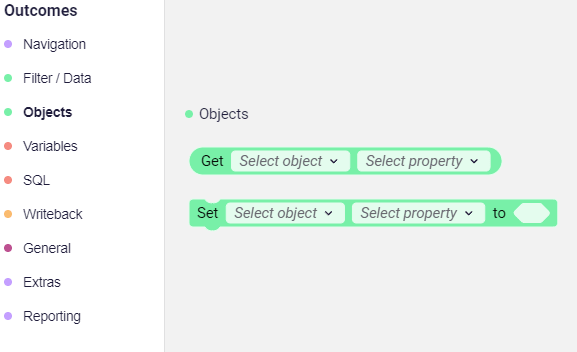
Export/Printing: Performance improvement
Section titled “Export/Printing: Performance improvement”🚀 Printed exports are now produced faster, across all file types (image and PDF).
Viz-1.16 - 24 October 2023
Section titled “Viz-1.16 - 24 October 2023”Workbook: Slider control
Section titled “Workbook: Slider control”Welcoming a new control object - the slider makes it easier than ever for you to drive interactions as an end user/viewer.
A slider can be used to update parameters that are using in custom SQL code, used in ML models, or even as part of writeback.
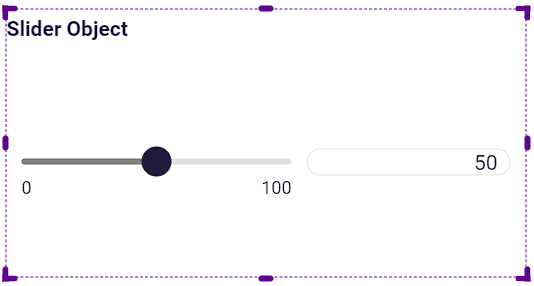
Workbook: Pivot Tables expansion
Section titled “Workbook: Pivot Tables expansion”Pivot tables can now stay fully expanded - keeping all of your data in view, all the time.
Workbook: Pivot Tables column sizing
Section titled “Workbook: Pivot Tables column sizing”You can now change the width of the very first column by dragging the header divider as you can with other columns. We have also added property to set the min-width of the first column.
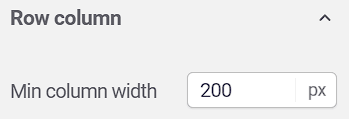
Workbook: Data objects export limit
Section titled “Workbook: Data objects export limit”We’ve added a new limiting property to the properties panel of data objects. You can now specify a row limit for the visualization as well as the data export.
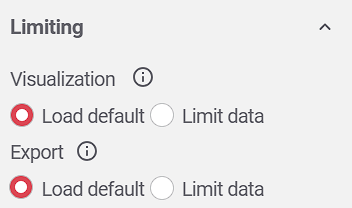
Workbook: Tooltips for Table/Pivot/Expandable Tables
Section titled “Workbook: Tooltips for Table/Pivot/Expandable Tables”Now, when users hover over a truncated value in any table, a tooltip will appear displaying the complete value.
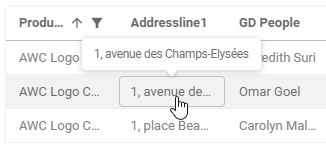
2.46 - 05 October 2023
Section titled “2.46 - 05 October 2023”Workbook: Performance boost - published workbooks 🚀
Section titled “Workbook: Performance boost - published workbooks 🚀”When publishing a workbook, we have made it even leaner by loading only the resources your browser needs - super efficient.
Complex workbooks load considerably faster, with up to 4x faster load times observed on multi-sheet workbooks.
Workbook: Introducing Design-first approach, with manual data
Section titled “Workbook: Introducing Design-first approach, with manual data”A first in BI! Users can build and design dashboards before connecting data, by by adding manual mockup data sets that create a specific desired visualization that more closely represents your use case.
-
🎨 DESIGN FIRST | Prototype dashboards before connecting live data. Agile, over waterfall dashboard development.
-
👨🍳 BLEND DATA | Blend live data from the cloud, with data from static sources
-
📚 DATA STORIES | Effortless storytelling with infographics
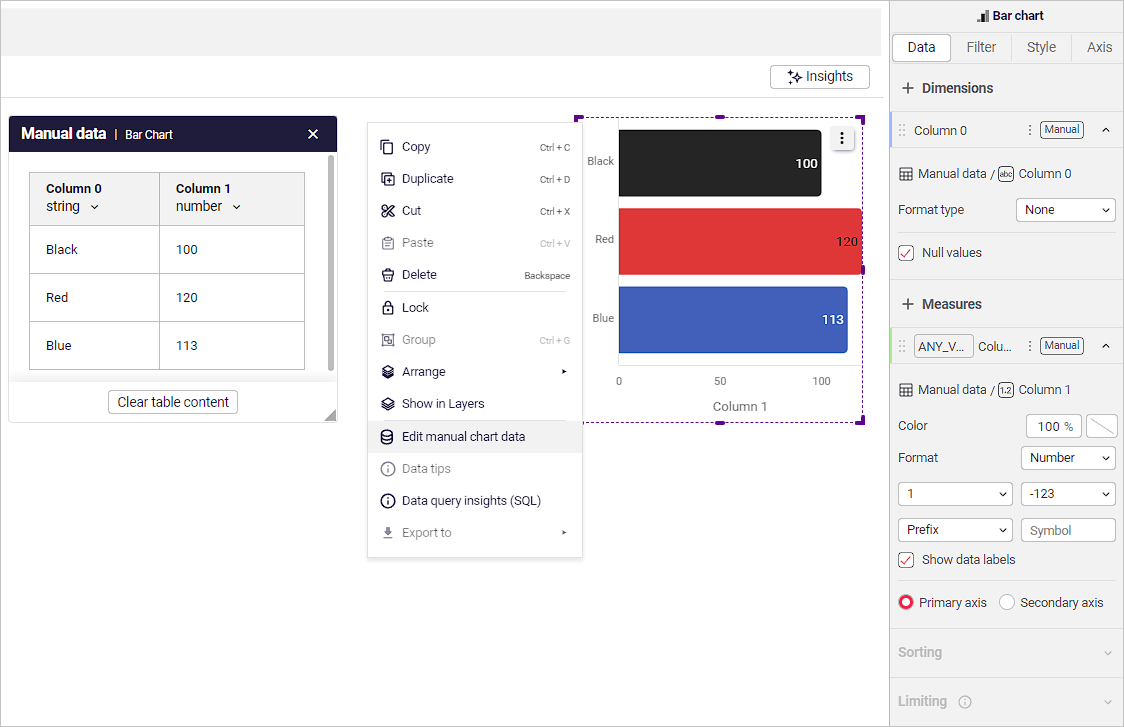
Viz-1.151 - 22 September 2023
Section titled “Viz-1.151 - 22 September 2023”Workbook: Introducing Astrato Insights
Section titled “Workbook: Introducing Astrato Insights”Insights democratizes analytical understanding, catering to all users, whether they’re builders or analytics consumers. From interpreting charts and tables to elucidating industry-specific metrics, Insights saves you hours of research while instantaneously making sense of any data.
Generative AI is supporting Astrato in transforming the landscape of analytics, enabling anyone to harness the power of data.
ℹ Insights can be enabled/disabled by your Astrato admin in system settings. Learn more here.
Viz-1.15 - 15 September 2023
Section titled “Viz-1.15 - 15 September 2023”Workbook: Filtering enhancements
Section titled “Workbook: Filtering enhancements”Keep showing the context in your visualizations, by toggling “show effect of global filters” on in the filter section (ensure “ignore global filters” is enabled first as shown below).
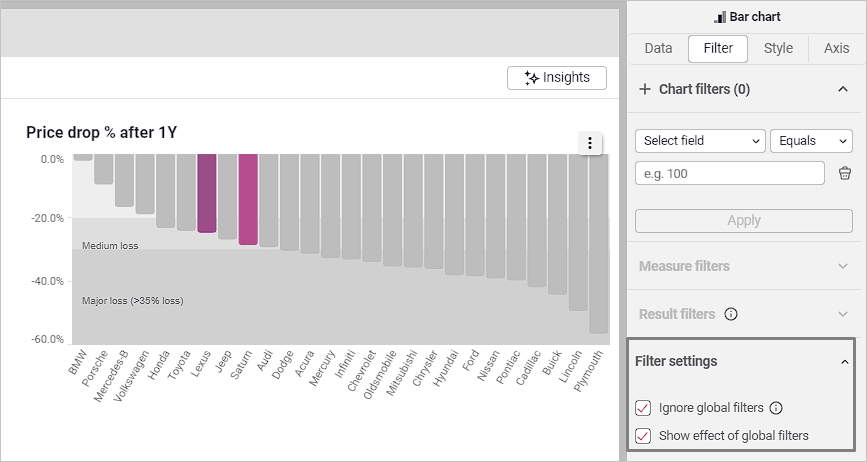
2.44 - 29 August 2023
Section titled “2.44 - 29 August 2023”Semantic Layer & Workbook: Drill-Through Dimension
Section titled “Semantic Layer & Workbook: Drill-Through Dimension”A new type of dimension is built from a list of fields from various tables.
The new dimension can be used in all visualization, allowing users to change the display of multiple charts in one click, making Astrato workbooks even more interactive.
Semantic Layer: Filter in Row-level measures
Section titled “Semantic Layer: Filter in Row-level measures”Row-level measures now support filters, extending the range of measures created in Astrato no code measures dialogue.
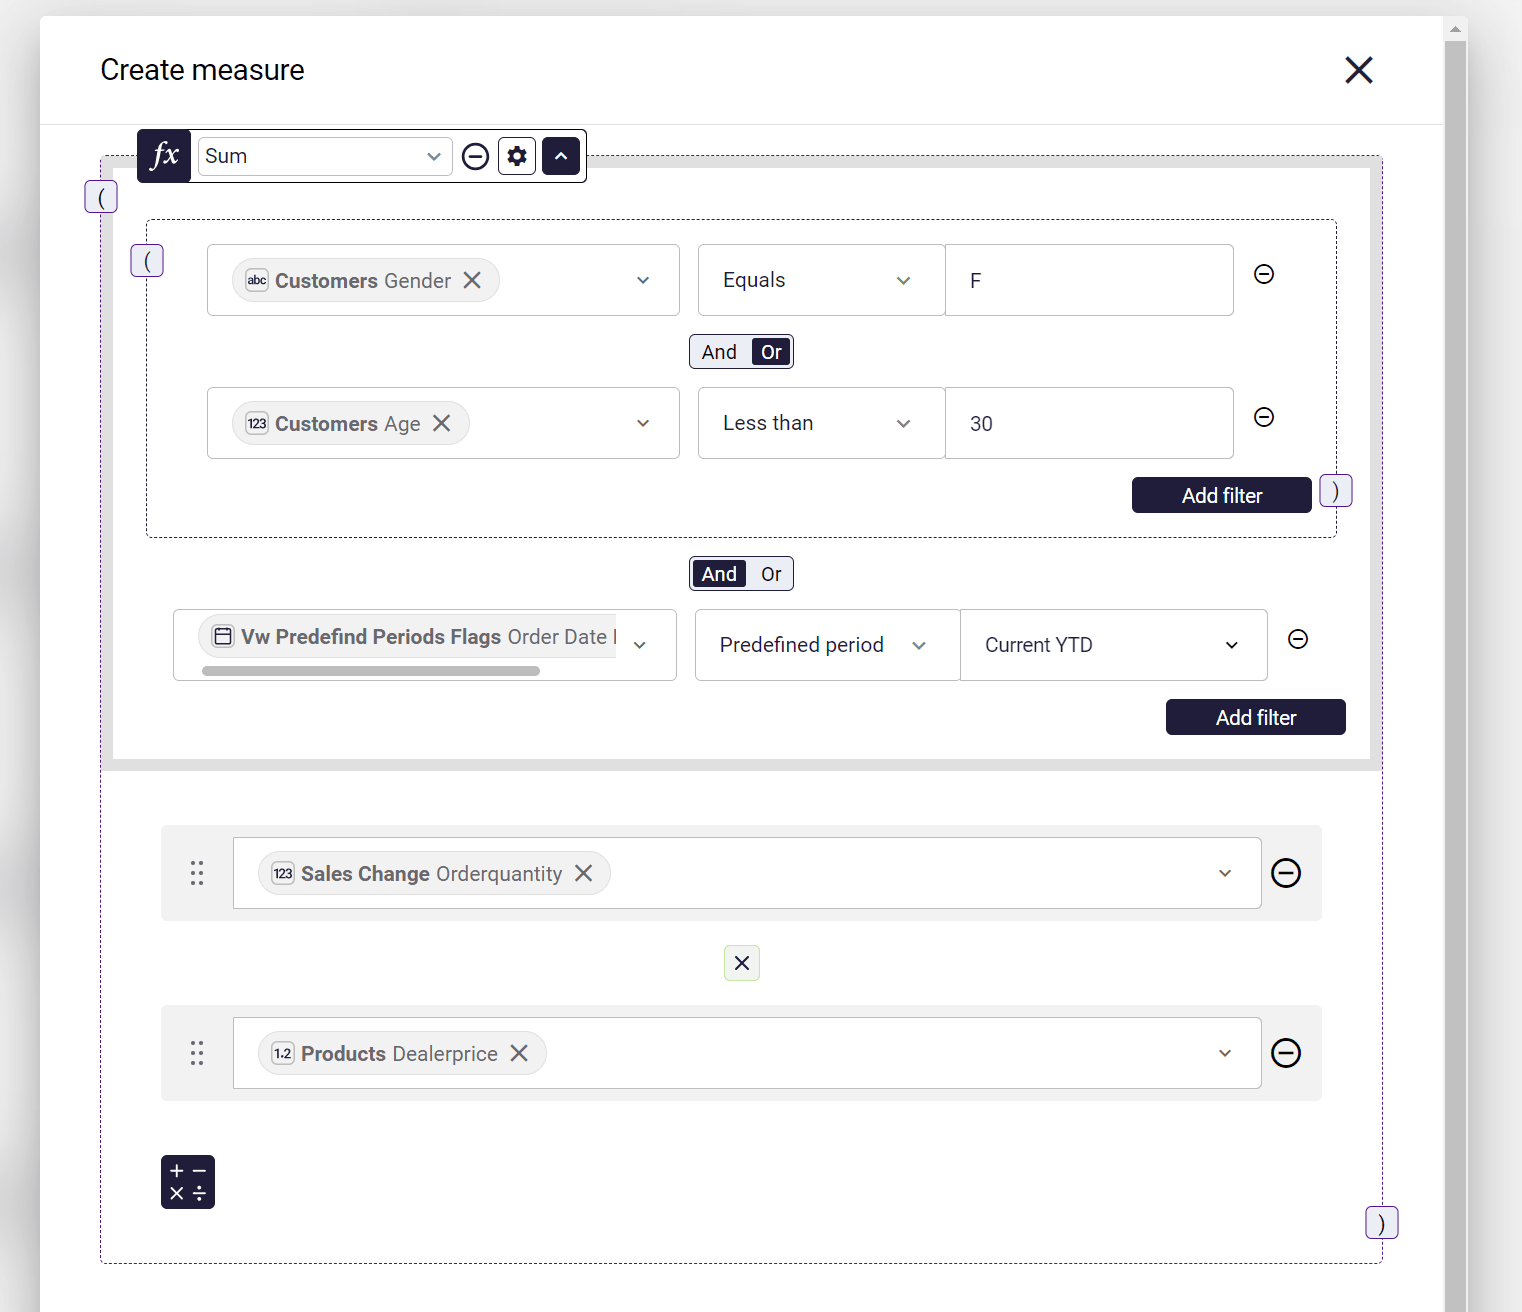
Workbook: Change Semantic Layer
Section titled “Workbook: Change Semantic Layer”Workbook’s source semantic layer can be changed to another semantic layer.
This feature enables moving workbooks between environments and data sources.
When changing the semantic layer, a list will appear if there are some missing items.
Viz-1.14 - 29 August 2023
Section titled “Viz-1.14 - 29 August 2023”Workbook: Line chart conditional coloring
Section titled “Workbook: Line chart conditional coloring”Conditional coloring is now available on the line chart, when a second dimension is in use on the line chart.
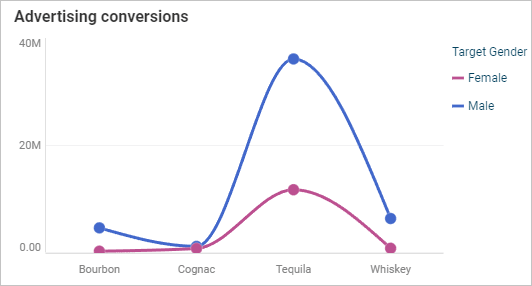
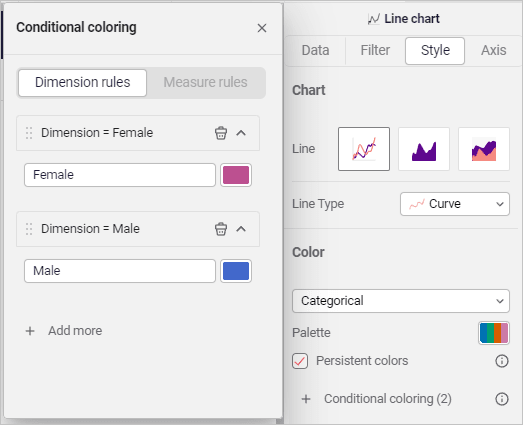
Workbook: Number object titles
Section titled “Workbook: Number object titles”Titles are now available on the number object. ℹ Make sure the object is appropriately size to display a menu
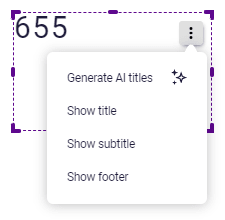
Viz-1.13 - 21 August 2023
Section titled “Viz-1.13 - 21 August 2023”Workbook: New format and settings for table progress bars
Section titled “Workbook: New format and settings for table progress bars”Table progress bars (available on straight table and expandable table) can now be further customized by changing position as well as using a dynamic scale, which uses the largest value to determine the top end of the scale.
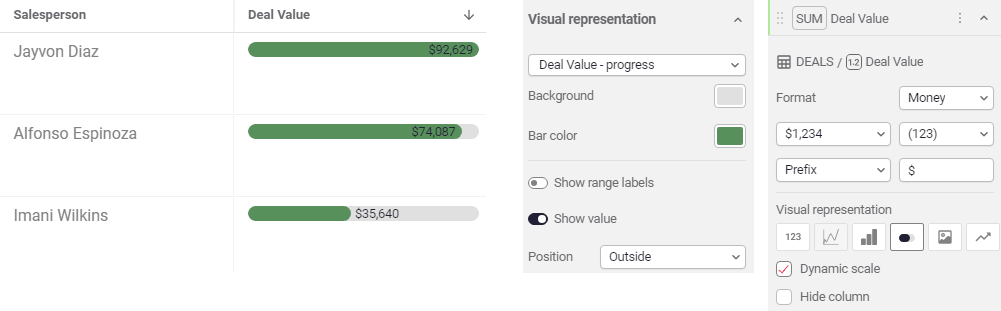
Workbook: Filter bar - limit fields available to filter on
Section titled “Workbook: Filter bar - limit fields available to filter on”When limiting filters, you can use all defined dimensions from the semantic layer, or select fields manually. This will limit the field offered in the filter bar, to ensure a more guided end user experience.
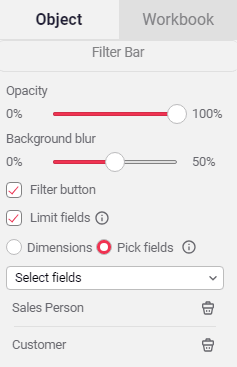
2.43 - 16 August 2023
Section titled “2.43 - 16 August 2023”Databricks: New data connection available
Section titled “Databricks: New data connection available”With this release we have added Databricks as a new connection option. This expands and complements the existing data source connections with a new option for users.
Semantic Layer: Width buckets
Section titled “Semantic Layer: Width buckets”New type of dimension, The new dimension allows user to create a calculated dimension that groups numeric values into equal range groups.
With this new type of dimensions, user will be able to easily see insights about distributions and identify the groups to focus on.
Administration: Table improvements
Section titled “Administration: Table improvements”Tables in the Administration are of Astrato now have the ability to be sorted, filtered, and change columns width to make them more readable, as part of the upgrade of this section
2.42 - 31 July 2023
Section titled “2.42 - 31 July 2023”Semantic Layer: Layout Improvements
Section titled “Semantic Layer: Layout Improvements”The button for Join suggestions is now more visible and easy to find, rather than being positioned in the top menu of the semantic layer
Workbooks and Collections: List View
Section titled “Workbooks and Collections: List View”You will now see that Workbooks and Collections can be viewed as lists rather than a grid, allowing more detailed information on the screen at once
2.41 - 01 August 2023
Section titled “2.41 - 01 August 2023”Workbook: Reduce initial load time (Performance boost)
Section titled “Workbook: Reduce initial load time (Performance boost)”🚀 We are excited to share that we have made significant performance improvements by streamlining the initial load time for workbooks. By (1) eliminating unnecessary components per object, (2) re-using loaded resources, and (3) reducing the number of requests, you can now enjoy a faster and smoother experience.
Workbook: Result filters
Section titled “Workbook: Result filters”After a result is calculated, the resultant values are then filtered. This is performed using ‘HAVING’ in SQL. ℹ Custom measures are not yet supported. You can now automatically filter results following a calculation, using result filters.
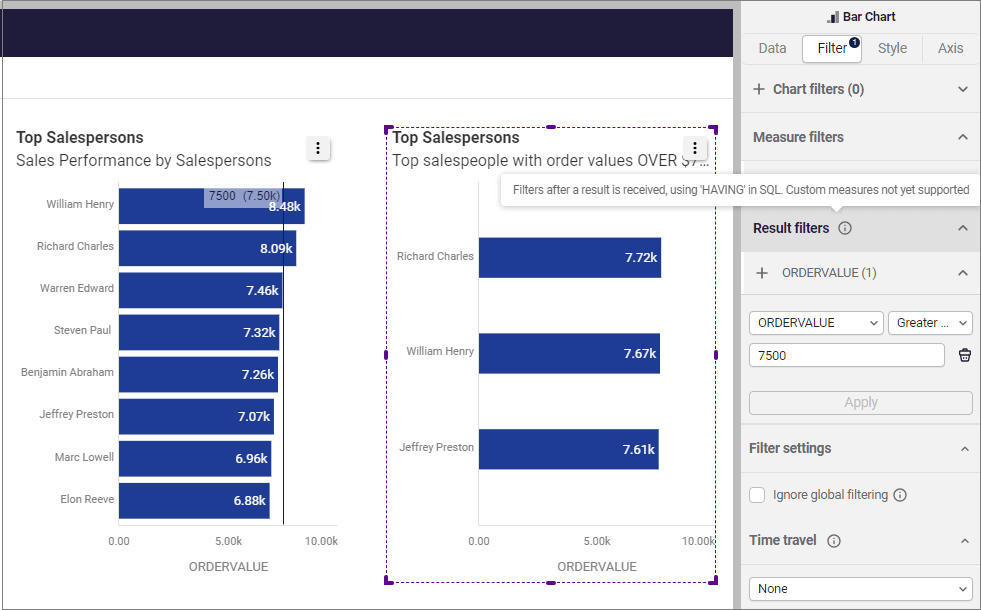
Workbook: Improvements to guidance on Group Property Panels
Section titled “Workbook: Improvements to guidance on Group Property Panels”When a User selects a Group, instead of a blank property panel you will now receive a message reminding them that Property Panels are only available for individual items
Semantic Layer: Filter bucketing dimension in the Data Explorer
Section titled “Semantic Layer: Filter bucketing dimension in the Data Explorer”With this update, users can now leverage bucketing dimensions to apply more precise filtering. Instead of relying solely on sliders, users can easily filter data by specific buckets, providing greater flexibility and control over data analysis.
Workbook - Export to PDF\Image includes theme settings
Section titled “Workbook - Export to PDF\Image includes theme settings”The export of a sheet or an object now respects all theme settings.
Authentication: Direct Login link for SSO
Section titled “Authentication: Direct Login link for SSO”To improve SSO set-up processes, it is now possible to view your direct SSO login link
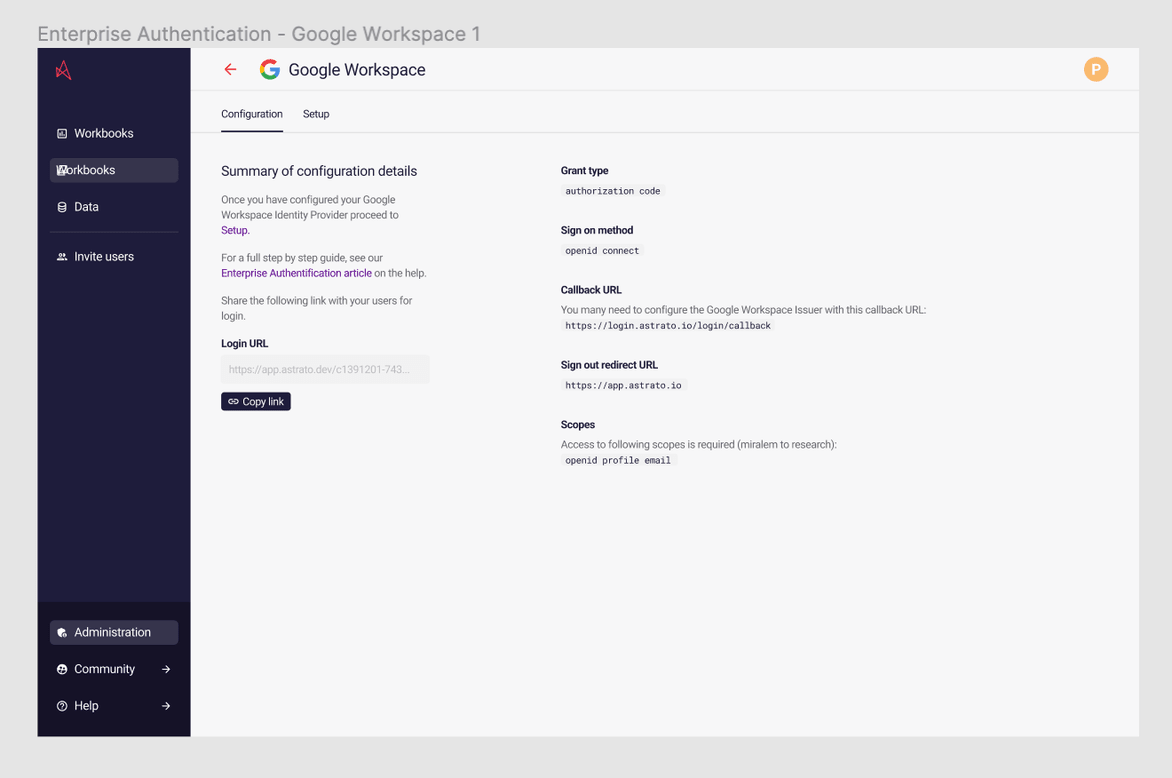
Viz-1.11 - 27 July 2023
Section titled “Viz-1.11 - 27 July 2023”Workbook: Date picker quick-select
Section titled “Workbook: Date picker quick-select”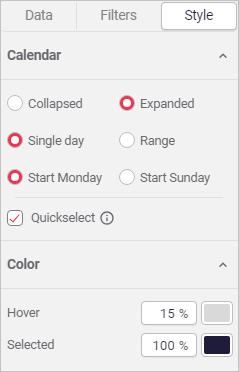
Workbook: Duplicating measures
Section titled “Workbook: Duplicating measures”Measures can now be easily duplicated and modified, further enabling more complex analysis, having identical measures and applying different filters to each of the measures. In the example below, we demonstrate Porsche’s average horsepower vs the average of all cars in our records. This is also represented in the SQL query.
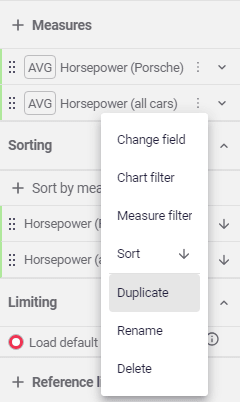
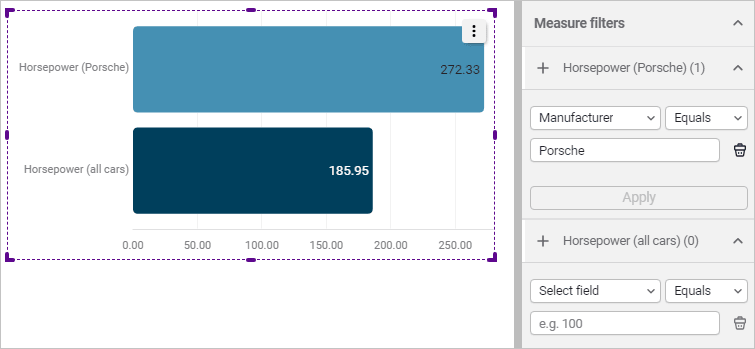
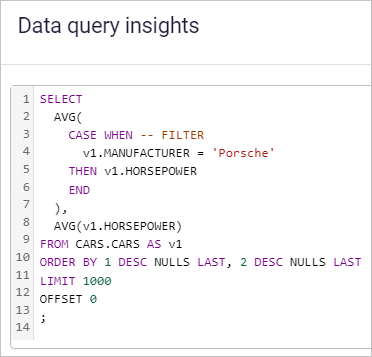
Workbook: Pivot horizontal paging
Section titled “Workbook: Pivot horizontal paging”Better performance, only loading data needed for display on screen.
Workbook: Hide Table header row
Section titled “Workbook: Hide Table header row”The table header (row) can easily be hidden using the new toggle section, located in the style tab at the bottom of the header section.
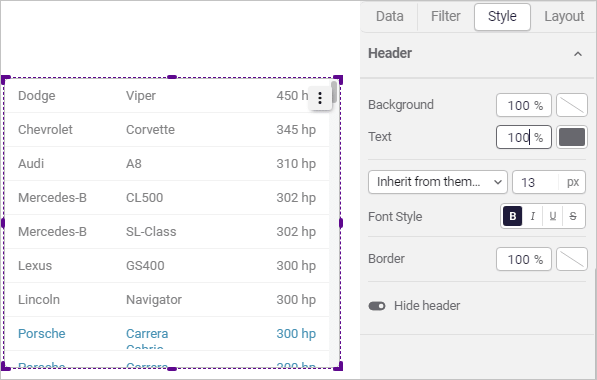
Workbook: Table fixed row height option
Section titled “Workbook: Table fixed row height option”The table now includes an option to set a fixed row height, which can be set to a pixel row height of your choosing. When this option is disabled, the default/automatic row height is chosen.
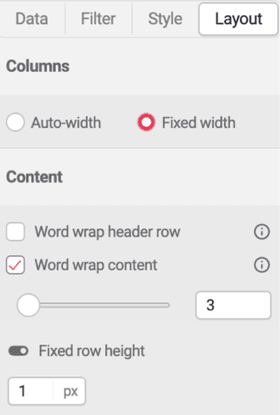
Workbook: Pivot/Expandable Tables - update subtotal font format to bold
Section titled “Workbook: Pivot/Expandable Tables - update subtotal font format to bold”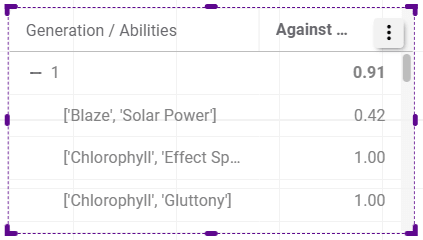
2.41 - 19 July 2023
Section titled “2.41 - 19 July 2023”Semantic Layer: Support for “OR” in measures filters
Section titled “Semantic Layer: Support for “OR” in measures filters”New option in measures filters to select the operator between any two filters,
And adding brackets in the filter blocks to define the right combination of filters.
This new option allows the measure to answer broader business questions.
All in an easy-to-use no-code experience.
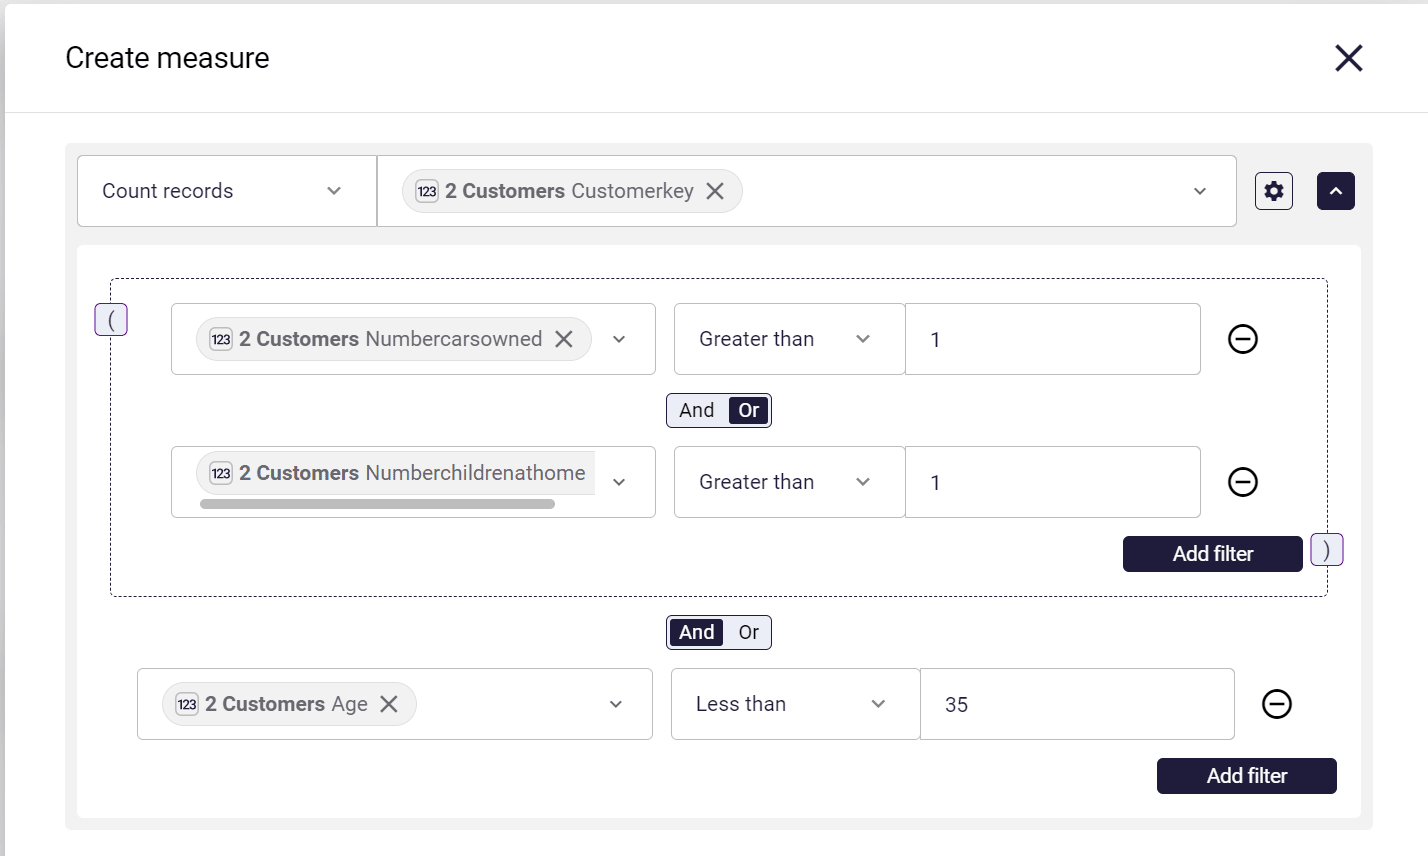
Semantic Layer: New Style Sidebar in The Semantic Layer
Section titled “Semantic Layer: New Style Sidebar in The Semantic Layer”The new sidebar of the Data screen provides users access from the left panel to all the items they’ve created.
This new sidebar allows users to create and edit any item while keeping the content of the data layer always visible.
The new sidebar will improve the ease and efficiency of building the Data Layer
2.40 - 05 July 2023
Section titled “2.40 - 05 July 2023”Semantic Layer: Control when to view join suggestions
Section titled “Semantic Layer: Control when to view join suggestions”The Astrato Data Engine can create join suggestions if your data enters the Define stage without any joins. Click the View Join Suggestion button on the toolbar to allow the Astrato Data Engine to generate the list of join suggestions.
From the list displayed, you can apply all joins suggestions or review them one at a time. The Joins suggestion button is always visible, so you can run the request at any time.
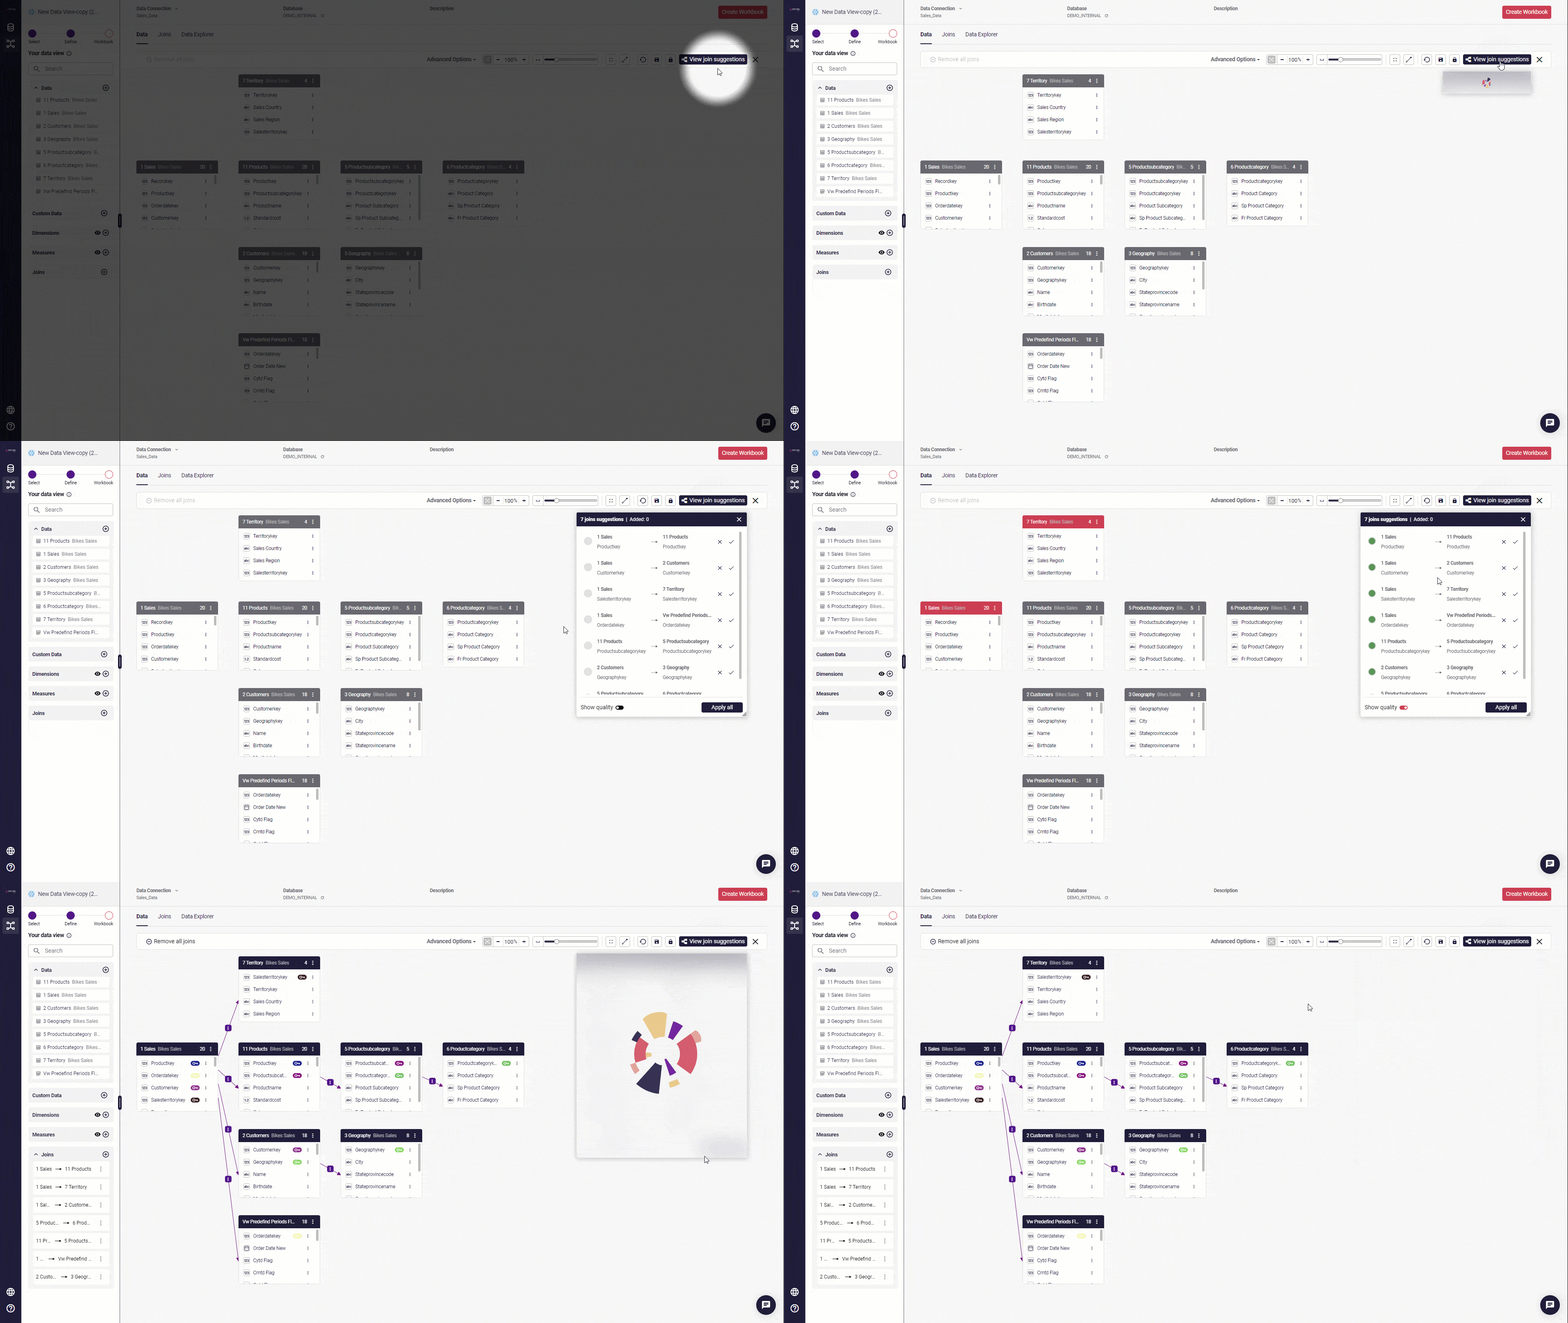
Please note: if the database is extensive or the semantic layer has a lot of tables, requesting joins suggestions can take time.
Lobby: View your Workbooks as a list or as tiles
Section titled “Lobby: View your Workbooks as a list or as tiles”Workbooks are, by default, shown as tiles with an image, but they can be viewed as a list. Click on the icons beside the Search Workbooks field to move between your workbook’s tiled or list views.
Click on the column headings to sort the list by: Data Connection type, Workbook name, Description, Date created, Last opened, or Type.
Viz-1.10 - 22 June 2023
Section titled “Viz-1.10 - 22 June 2023”Workbook Editor: Graphics - Variable support for text and images
Section titled “Workbook Editor: Graphics - Variable support for text and images”In the toolbar’s Graphics section, you can use the text object to enter static text or select a string from your list of Variables to the field in the properties panel.
Images can be updated using base64 and image URLs.
Using a Variable allows you to update the content in multiple sheets in your workbook with a single change. If you use an Action block to update your variable, you’ll never need to type in static text again.
💡 This enabled dynamic guided analytics workflows and Data Apps use cases, re-use the same object, allow text & images to change whilst navigating your data.
Workbook Editor: Controls - Text Area element for line breaks and long-form text in Variables
Section titled “Workbook Editor: Controls - Text Area element for line breaks and long-form text in Variables”Use our new Text area control with any long-form text content, and add comments, context, and procedural steps you’ve created as string Variables.
As with all our text options, you can enter plain text or a SQL query if desired. And you can combine the Text area element with Actions to create interactive dashboards and data apps.
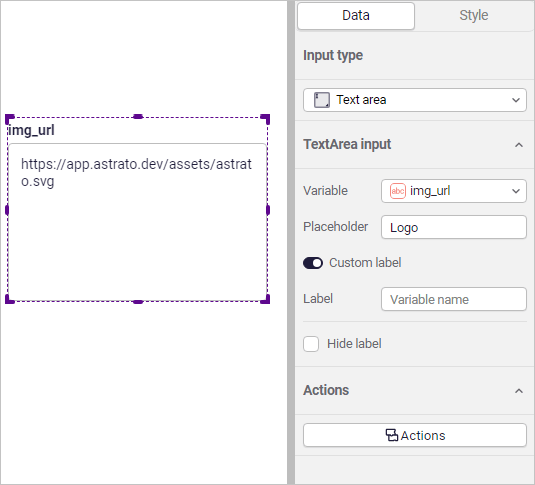
Workbook Editor: Controls - Toggle and Checkbox elements for Boolean variables
Section titled “Workbook Editor: Controls - Toggle and Checkbox elements for Boolean variables”Use toggle (show/hide or enable/disable) and checkbox elements to add interactivity to your dashboards or as part of an input form in a data app. Style format choices include outlined and filled, so they’re not just a great feature; they help make your dashboards and data apps look good too.
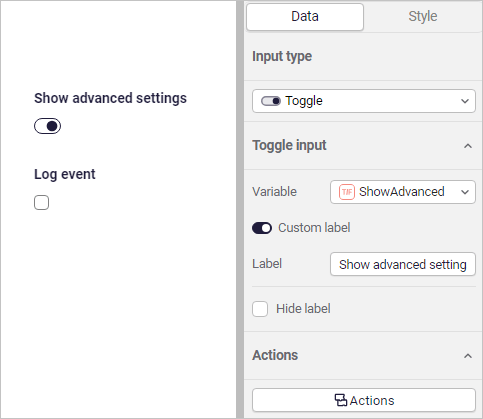
Workbook Editor: Theme support & updated object default styles
Section titled “Workbook Editor: Theme support & updated object default styles”Visualizations now support theming, including categorical color palettes, font and axis styling.
The default styles for the charts have been updated. When placing new objects on the canvas, the style has been updated to improve visual appeal.
💡 Use themes to synchronise your brand styles across multiple workbooks. Design once and repeat.
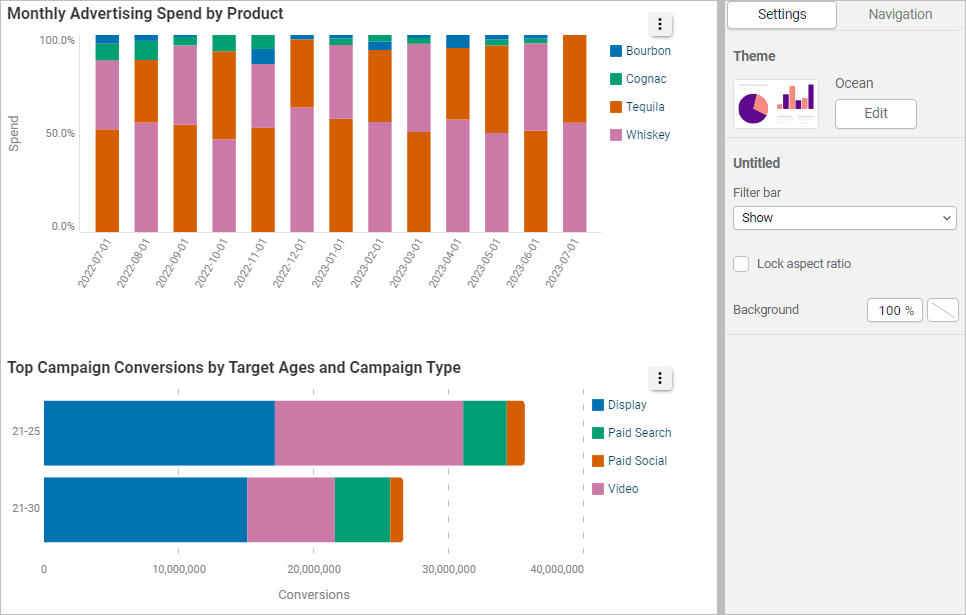
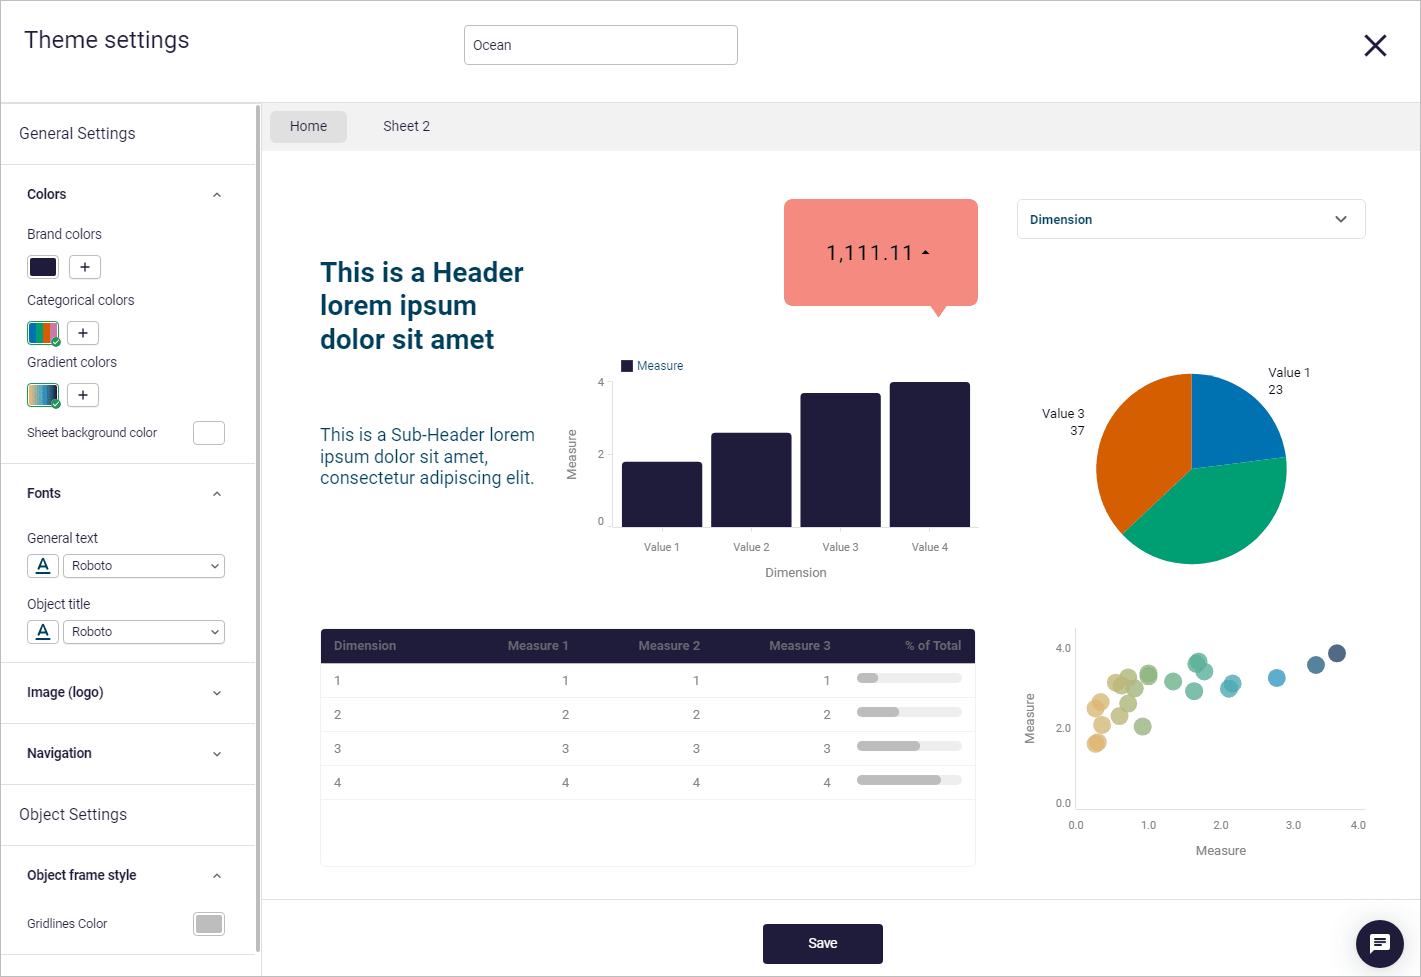
Workbook Editor: Date picker expanded mode
Section titled “Workbook Editor: Date picker expanded mode”The date picker can now be fully expanded, for instant access to selecting data and simply visualisation of dates that are present in your data.
2.39 - 22 June 2023
Section titled “2.39 - 22 June 2023”Visuals: show data tips when a chart measure or dimensions displays an unexpected null result.
Section titled “Visuals: show data tips when a chart measure or dimensions displays an unexpected null result.”Combining filters and measures as part of data analysis can occasionally result in unexpected null results. Astrato’s data tip displays a high-level description of why the query resulted in the issue. Click on the data tip to view suggested resolutions.
Please note: This feature applies to joined tables with arrows in the same direction.
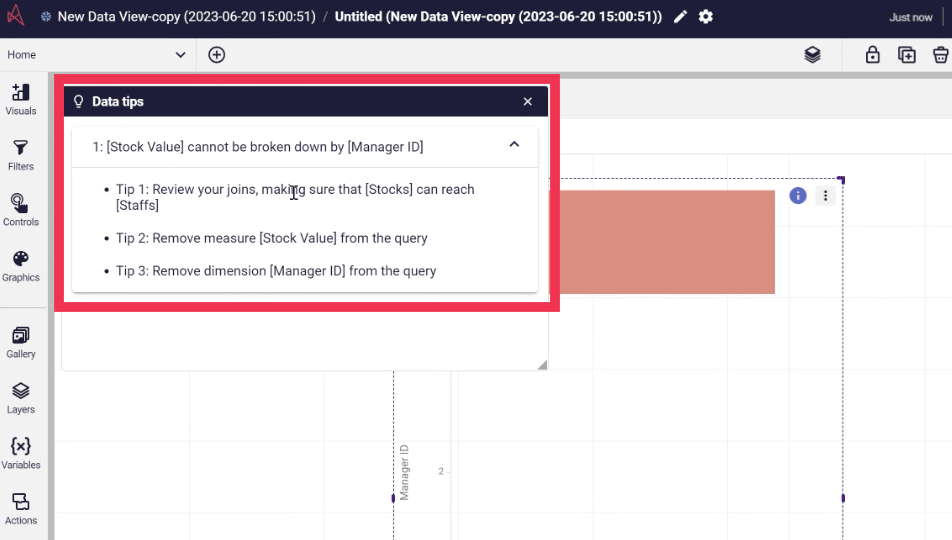
Administration: Updating Demo data to view the new Astrato Tutorial workbook
Section titled “Administration: Updating Demo data to view the new Astrato Tutorial workbook”A new addition to the Demo Workbooks is the option to view an Astrato Tutorial built as an Astrato workbook.
Please ask your Administrator to update the Demo data to add this new walkthrough to get started with Astrato.
Data: Updating time-limited PATs quickly for Dremio data connections
Section titled “Data: Updating time-limited PATs quickly for Dremio data connections”You can now update your existing Dremio connection rather than deleting and adding new connections to your data source. Time-limited PATs for Dremio can be updated without breaking existing data connections.
Viz-1.9 - 02 June 2023
Section titled “Viz-1.9 - 02 June 2023”Workbook Editor: Table - slide the toggle to show totals of all measures in your table
Section titled “Workbook Editor: Table - slide the toggle to show totals of all measures in your table”Scroll down to view the Totals section and slide the toggle to the right to show the totals.
A new row displays above the data provides the totals of all the measures in your table.
Workbook Editor: Visuals - Create Custom Measures from the workbook
Section titled “Workbook Editor: Visuals - Create Custom Measures from the workbook”Previously, you could only create Custom Measures within the semantic layer; you can now create them within your workbook.
Click on Visuals, click Data, click Measures, and click the button Create measure.
2.38 - 02 June 2023
Section titled “2.38 - 02 June 2023”Data Connection: Amazon RedShift
Section titled “Data Connection: Amazon RedShift”In addition to Snowflake, PostgreSQL, and Dremio, you can create data connections to Amazon Redshift.
Semantic Layer: Manage dimensions and measures directly in the data selection pane.
Section titled “Semantic Layer: Manage dimensions and measures directly in the data selection pane.”You can now view your Dimensions and Measures directly from the data selection pane in the semantic layer. Click on the eye icon beside the list of your Dimensions or Measures to view the details. From the list that displays, click the box to select the fields to edit.
Actions: Replace filters
Section titled “Actions: Replace filters”With the Apply filters block, you could always add filters to a field - however, there may be a use case where you want to toggle or clear filters for a specific field using actions.
With this release, the Replace filters block allows you to replace existing filters within a field with a new set of filters.

Actions: Export Objects and Sheets
Section titled “Actions: Export Objects and Sheets”You can print objects, groups, or sheets directly from within an Action flow. Pair with hidden sheets to design print-optimized sheets that can be printed with the click of a button on the visible worksheet.
Actions: Clear Filters in Dimensions/Fields
Section titled “Actions: Clear Filters in Dimensions/Fields”This action block allows you to clear filters within a dimension or field. It’s useful when you want to reset a specific field and not the entire filtering state.
Viz-1.8 - 22 May 2023
Section titled “Viz-1.8 - 22 May 2023”Visuals: Enable continuous axis for date/number dimension type
Section titled “Visuals: Enable continuous axis for date/number dimension type”A continuous axis is now available for numerical fields (integers, decimals) in addition to dates.
Select your graph on the Data tab of the Properties panel; in the Dimensions section, click the box beside Enable continuous axis.
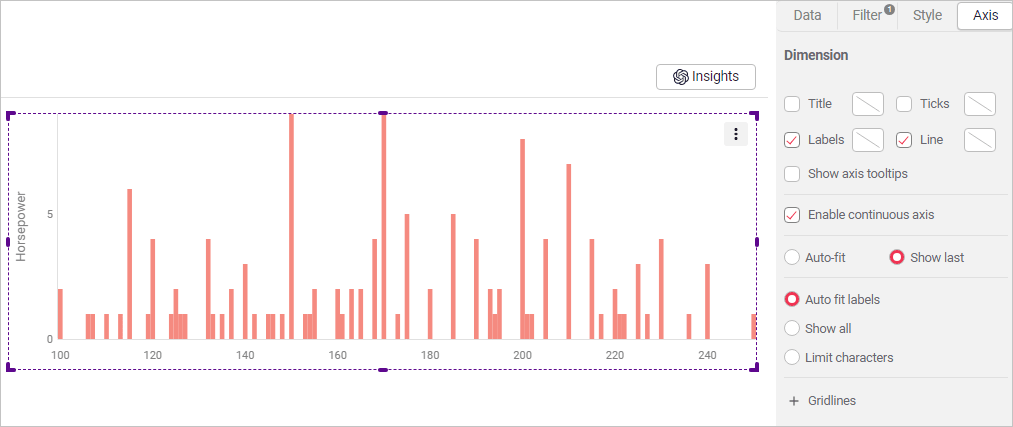
Filter bar: Introduce date picker
Section titled “Filter bar: Introduce date picker”Also added to the Filter bar, the date picker is now the default option for filtering date fields in Astrato. It can be added to a sheet as an object, found in the filter section.
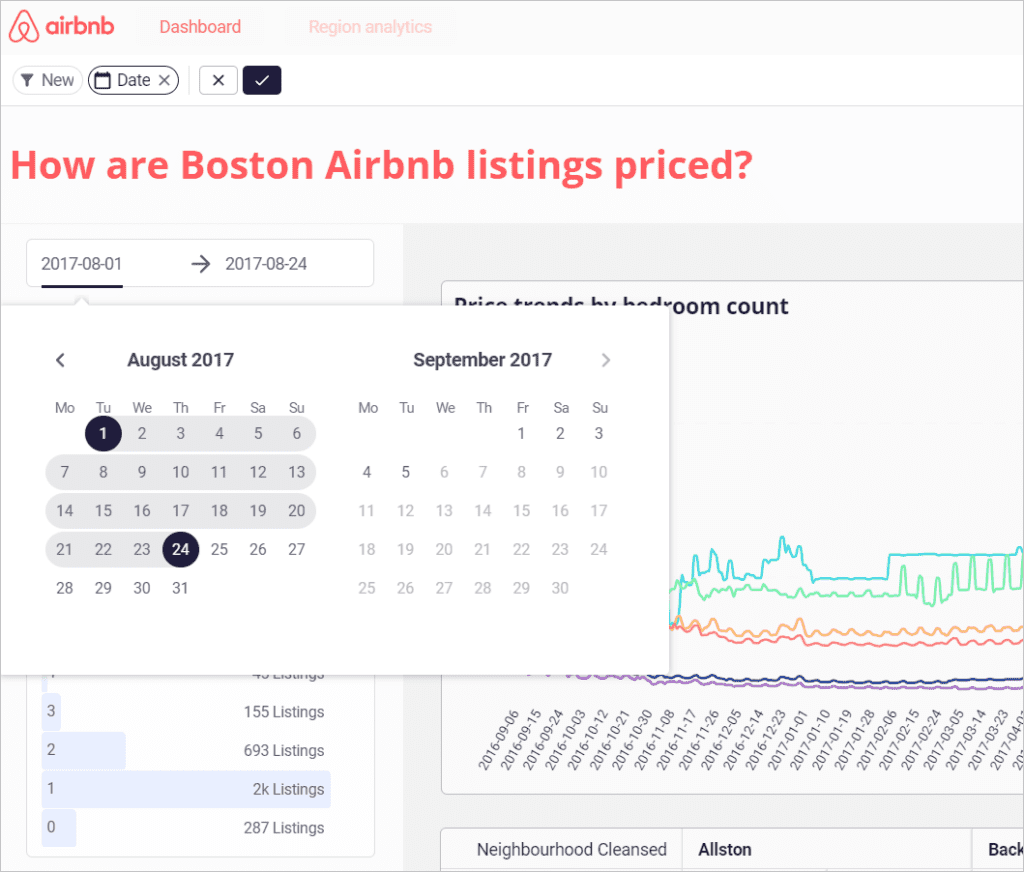
2.37 - 22 May 2023
Section titled “2.37 - 22 May 2023”Actions: Split Text
Section titled “Actions: Split Text”The Split text blocks allow you to further manipulate text to be used as inputs into other blocks or as part of control statements. Examples of where the Split Text block is useful include: picking out a year from a date field or the domain name from an email address.
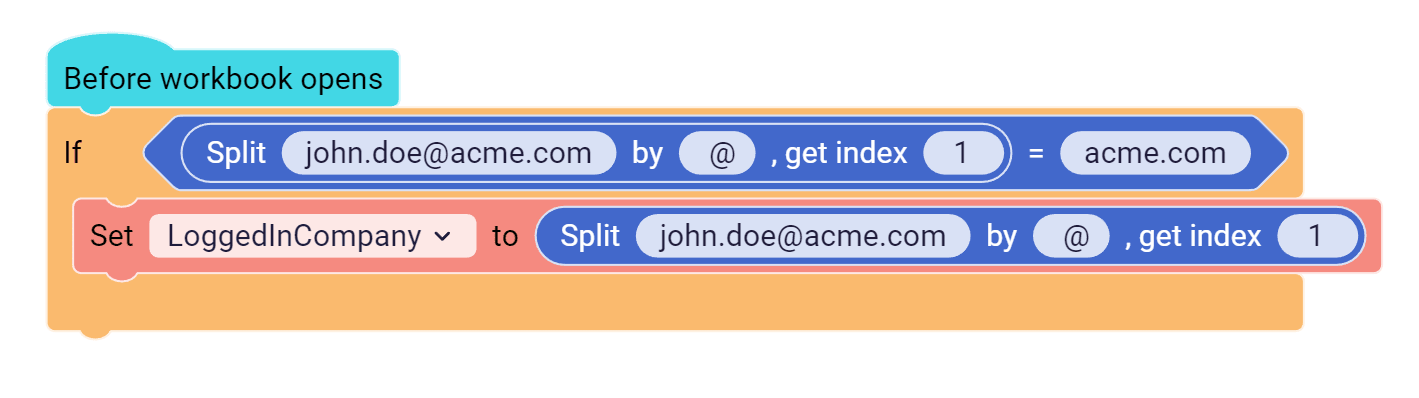
Semantic Layer: Measure with row-level calculation
Section titled “Semantic Layer: Measure with row-level calculation”A user should be able to create measures that combine aggregation and row-level calculation. For example, Sum (Sales/exchange rate), and use fields from different tables.
Semantic Layer: Create an Inline table and paste data
Section titled “Semantic Layer: Create an Inline table and paste data”In the data explorer, you can create an inline table and paste in data to easily create mapping and reference tables.
Please note: the number of cells is limited to 100 cells (that is, 1x100, 2x50, or 10x10).
Admin: Manage a hybrid model of license seats and consumption-based
Section titled “Admin: Manage a hybrid model of license seats and consumption-based”From the License & Usage section in Administration, you can now manage a hybrid model of license seats and consumption-based for your users.
Admin: Access Control for improved governance by member
Section titled “Admin: Access Control for improved governance by member”We’ve added code-based entry management to role types. With Astrato, we take the first security layer from the data source, and now you can add a second layer to manage more granular levels of controlling access.
When you add a new data connection, you can add Members from your users’ list into a secure second layer, narrowing the semantic layers that each user is presented. That is, the list of semantic layers for each user is filtered in alignment with the improved governance.
Workbook Editor: Click on Logo to update
Section titled “Workbook Editor: Click on Logo to update”By default, a space displays in the Navigation bar for you to add a logo. Click on it to open the Media Gallery and upload an image.
Viz-1.7 - 09 May 2023
Section titled “Viz-1.7 - 09 May 2023”Workbook Editor: Control - Text Input
Section titled “Workbook Editor: Control - Text Input”As part of updating the Input control options, we’re adding individual (atomic) control inputs to select from. The first to be released is the updated Text Input form.
You can manipulate string variable values used with the Actions Writeback block and create interactive dashboard actions.
2.36 - 09 May 2023
Section titled “2.36 - 09 May 2023”Semantic Layer: Add custom formatting for the outputs of your custom measures
Section titled “Semantic Layer: Add custom formatting for the outputs of your custom measures”Add custom formatting for the outputs of your custom measures. Create your custom format with comma separators, decimal places, etc., in the most useful format for your team.
When you create a measure, click the Custom format button at the end of the list of format options. Enter your custom format in the field, and click Apply to save it or Cancel to enter a different format.
Admin: Set a Default view for each user role
Section titled “Admin: Set a Default view for each user role”An Administrator can select the area of Astrato that displays after login by user role type.
An example of the use would be to have all Viewers open at the view of the list of Workbooks or Collections.
Admin: General settings - Allow Creators to upload shared media
Section titled “Admin: General settings - Allow Creators to upload shared media”Administrators can allow users with the Creator role to upload media available to other users.
The option is available in the Administration section, under System Settings, General. Slide the toggle to the right to enable the option to allow Creators to upload shared media.
Actions: General - Get [Category]
Section titled “Actions: General - Get [Category]”We’ve added a Get [Category] block with the new General section. This action block gets the current context values, including:
-
Current user’s [email, name, or profile image URL].
-
Date and time - based on ISO8601 [Today’s date, Today’s Date and Time].
-
Workbook data source [Workbook ID, Name, Data source type].
-
Active sheet name [Sheet ID or Name].
You could add the block in an IF statement to check if the active sheet is [Name], then perform an action.

Actions: Right-click to Add a comment
Section titled “Actions: Right-click to Add a comment”Right-click on the Actions canvas, and select the option to Add Comment. Add a comment as a title or label for groups of Action flows, or a comment to describe your action flows.
The other options with the Right-click menu are: Undo, Redo, Clean up Blocks, and Delete [all] Blocks.
Viz-1.6 - 24 April 2023
Section titled “Viz-1.6 - 24 April 2023”Control: Button has Quick Styles
Section titled “Control: Button has Quick Styles”Use Quick styles for buttons; select from six template styles with font and color options.
To view the complete list of style options, scroll down the properties panel to view the options under the Default, Hover and Click sections in the properties panel.
2.35 - 24 April 2023
Section titled “2.35 - 24 April 2023”Semantic Layer: Join quality checks on user-selected pairs
Section titled “Semantic Layer: Join quality checks on user-selected pairs”Astrato’s data engine displays Joins suggestions based on checks for content pairs. If tables have been added, or table names and contents haven’t been named as well as they should, our Join quality checks now provides more detailed feedback on pairs you’ve selected to use as joins.
Drag one table on top of the other to initiate the detailed search. We search all the fields to offer you joins suggestions. The checks provide feedback with amber or green circles beside the potential joins. You can then choose the suggestion that best matches your needs.
Please note: this feature doesn’t cover situations where you want to use multiple fields to connect tables.
Actions: Wait block
Section titled “Actions: Wait block”With the new Wait block, you can pause action execution for a set number of seconds.
This can be useful if you are waiting for your database to perform an operation based on, for example, an Execute SQL block before you can proceed with your action flow.
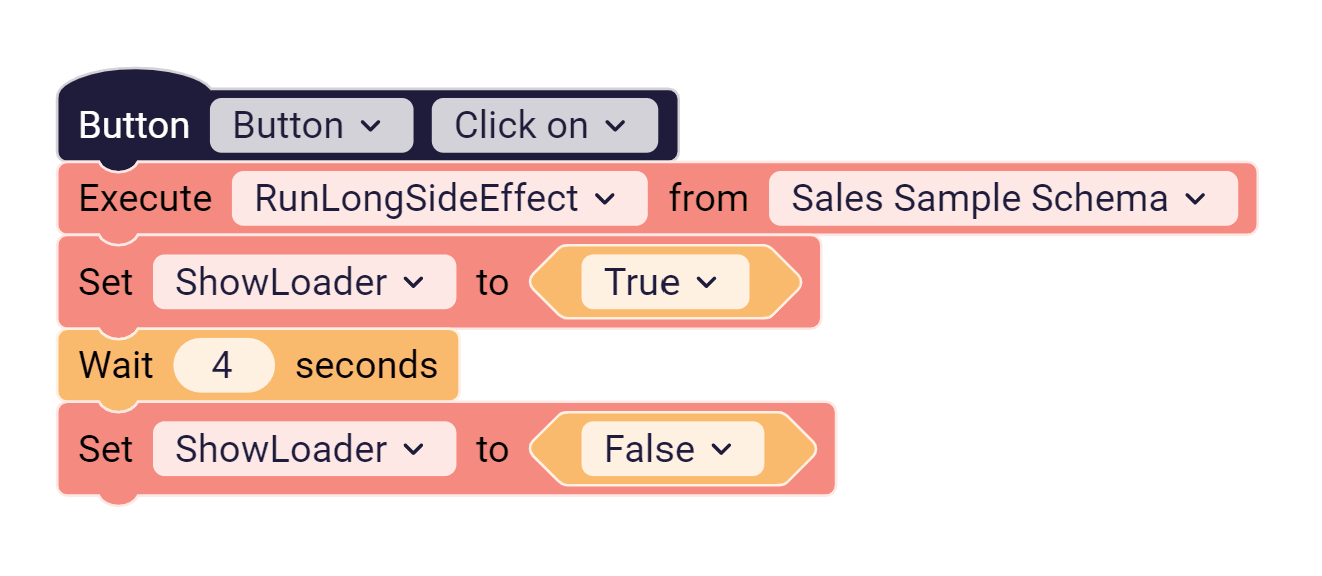
Action: Using a string variable in the Filter outcome
Section titled “Action: Using a string variable in the Filter outcome”Use the existing Apply Filter block to enter any type of string variable that outputs a dynamically filtered outcome.
Viz-1.5 - 11 April 2023
Section titled “Viz-1.5 - 11 April 2023”Properties panel: Filter bar - Add option to hide the “new filter” button
Section titled “Properties panel: Filter bar - Add option to hide the “new filter” button”The option to show or hide a filter bar per sheet is a new option added to the filter options on the Properties Panel. As it applies per sheet, you can show or hide the Filter bar when you want to.
Click on the Filter bar to display its properties, and add a checkmark to show the Filter bar on that sheet.
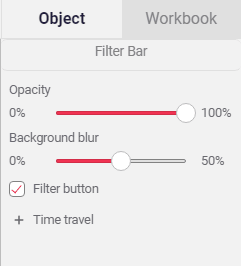
2.34 - 11 April 2023
Section titled “2.34 - 11 April 2023”Semantic Layer: Duplicate tables from the table context menu
Section titled “Semantic Layer: Duplicate tables from the table context menu”Duplicate tables to avoid a many-to-one issue for a single table. This helps when you need to duplicate a generic dimension table (e.g., date (order date, ship date), country (customer, employee, product shipped from).
Click the context menu (three vertical dots on the table header) to view the Duplicate table option.
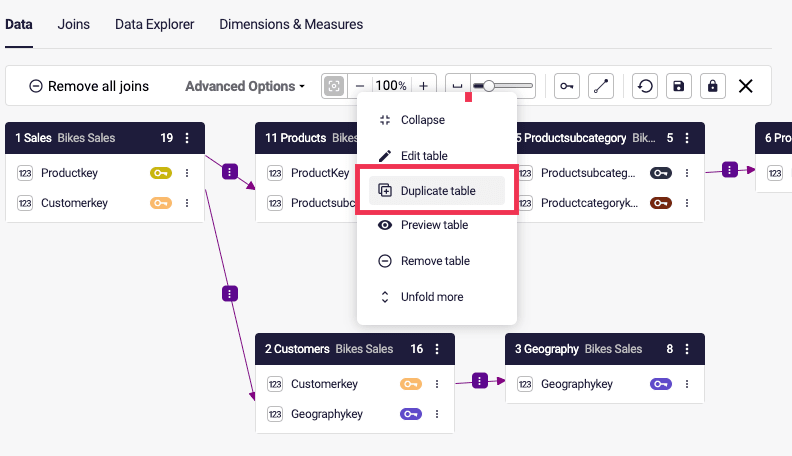
Data Explorer: View the SQL expression when you create a measure
Section titled “Data Explorer: View the SQL expression when you create a measure”When creating a custom measure, click the View SQL button to view the SQL expression. We’ve also added a horizontal line as a separator between the fields of each table so it’s easier to see which table a field belongs to.
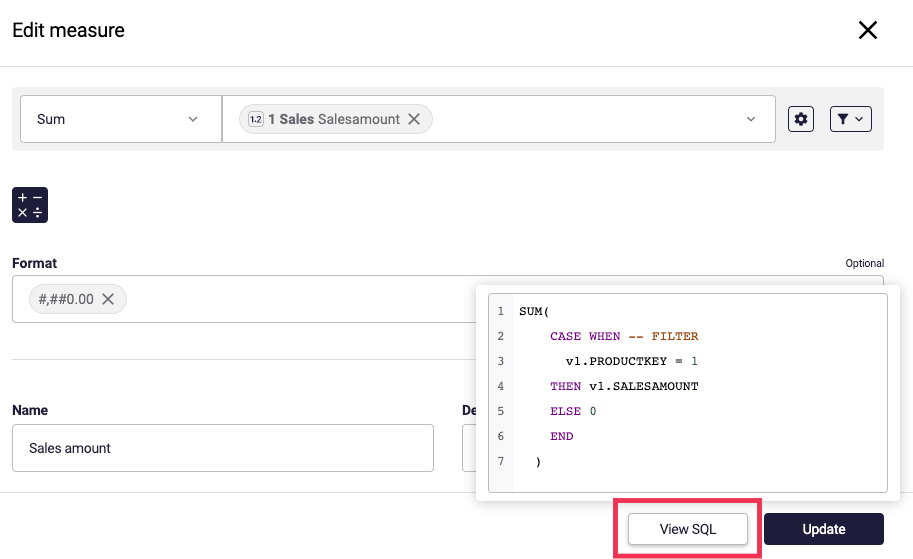
Semantic Layer: Calculator added to add numeric values without adding a field or aggregation
Section titled “Semantic Layer: Calculator added to add numeric values without adding a field or aggregation”You can now create a measure using only numerical values, as a calculator has been added to the semantic layer. There’s no need to add a field/aggregation; simply add the numeric values to create the measure directly.
Semantic Layer: Manage your data in the table without leaving the Semantic Layer
Section titled “Semantic Layer: Manage your data in the table without leaving the Semantic Layer”Manage your data in the table without leaving the semantic layer using the preview of the table. You can edit field names and add custom fields without switching to a different tab.
Actions: Variables - use Ternary operators for inline statements
Section titled “Actions: Variables - use Ternary operators for inline statements”Use the new Ternary block to have inline conditional statements for your inputs without duplicating them using IF and IF/ELSE statements.
Before:
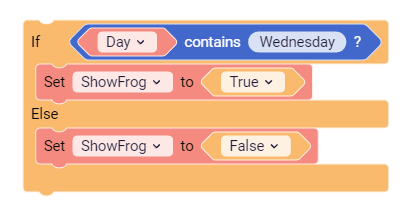
Now:

Viz-1.4 - 04 April 2023
Section titled “Viz-1.4 - 04 April 2023”Visuals: Bar Charts - Histogram visual added
Section titled “Visuals: Bar Charts - Histogram visual added”Histogram visualizations provide a clearer understanding of numerical data that are part of a continuous distribution (e.g. age groups, hours in a day); helping you identify important insights that may be hidden within a single category.
Use histograms of individual categories to compare with a bar chart of the data as a whole, to improve your understanding of your data.
You’ll find all chart objects in the Visuals area of the toolbar. The Histogram chart is in the Bar chart section.
We’re constantly working to improve our data objects and visuals to help you identify key trends and patterns in your data; please join us in our Astrato community to learn more.
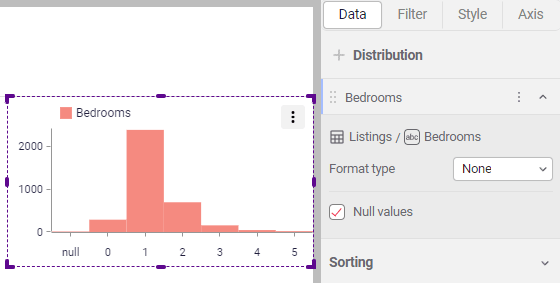
Data Engine: Query Profile Insights
Section titled “Data Engine: Query Profile Insights”To help users increase query efficiency, Snowflake recently introduced a new table function, GET_QUERY_OPERATOR_STATS, which returns statistics about individual operators within a query.
Our data Query Profile Insights feature provides these insights with no coding required. Simply right-click on a chart, and scroll down to Data Query insights to view the results of checks for these common query inefficiencies: Cartesian, Union, Memory, or Pruning.
Workbook Editor: The last tab used in the properties panel stays open
Section titled “Workbook Editor: The last tab used in the properties panel stays open”Although the Data tab in the properties panel remains the default when a new object is created, when you switch to a different object, the last tab on the properties panel you were working with now remains visible (where possible).
This should help when using the Style tab and applying changes across your charts. Now the tab you used last remains open, even when you select a different object.
Image Object: Media gallery & styles
Section titled “Image Object: Media gallery & styles”The image object now supports adding images from the Gallery. You can adjust image display properties including: opacity, saturation, blur, and shadow.
Visuals: Added Pie/Donut chart borders
Section titled “Visuals: Added Pie/Donut chart borders”Border colors can now be added to pie charts. Style tip: setting the border to white, and adjusting the width creates a virtual gap between segments in pie and donut charts to highlight segments in your chart.
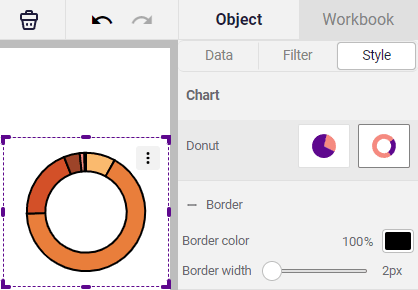
2.33 - 27 March 2023
Section titled “2.33 - 27 March 2023”Workbook Editor: Gallery for image upload and reuse
Section titled “Workbook Editor: Gallery for image upload and reuse”The Gallery is a new section on the toolbar for you to upload media for use in your Workbook. The image file types allowed are JPEG, JPG and PNG. The file size maximum is 9 Mb.
-
Upload the image by browsing your file folders or drag and drop the file.
-
The image preview displays; type the file name.
-
To keep your files organized, add a new folder, or save it to a folder you already have.
-
Click Add to Media Gallery to upload the image.
Workbook Editor: Graphics - Image options include ‘Add from Gallery’
Section titled “Workbook Editor: Graphics - Image options include ‘Add from Gallery’”From the Graphics section of the toolbar, select Image. From the frame, click Add from the Gallery. The Style tab opens with the Image and Adjust sections. Use the Image options to select the:
-
Image source from the Gallery or a URL
-
Media window to change the image in the frame.
-
Adjust the image size in the frame to: fill, resize to fit, or cover (the image expands to fill the frame).
Use the Adjust options to add a shadow or the sliders to change the Opacity, Saturation, or Blur.
Administration: Media area to manage images across workbooks and your tenant
Section titled “Administration: Media area to manage images across workbooks and your tenant”Administrator and Owner roles can view all images added to workbooks in an Astrato tenant. Also, all images uploaded directly to the Media section (e.g., company brand icons) are available as shared images from within the Gallery of all workbooks in the tenant.
All media asset management permissions (view, create, edit, and delete) can be performed from this area.
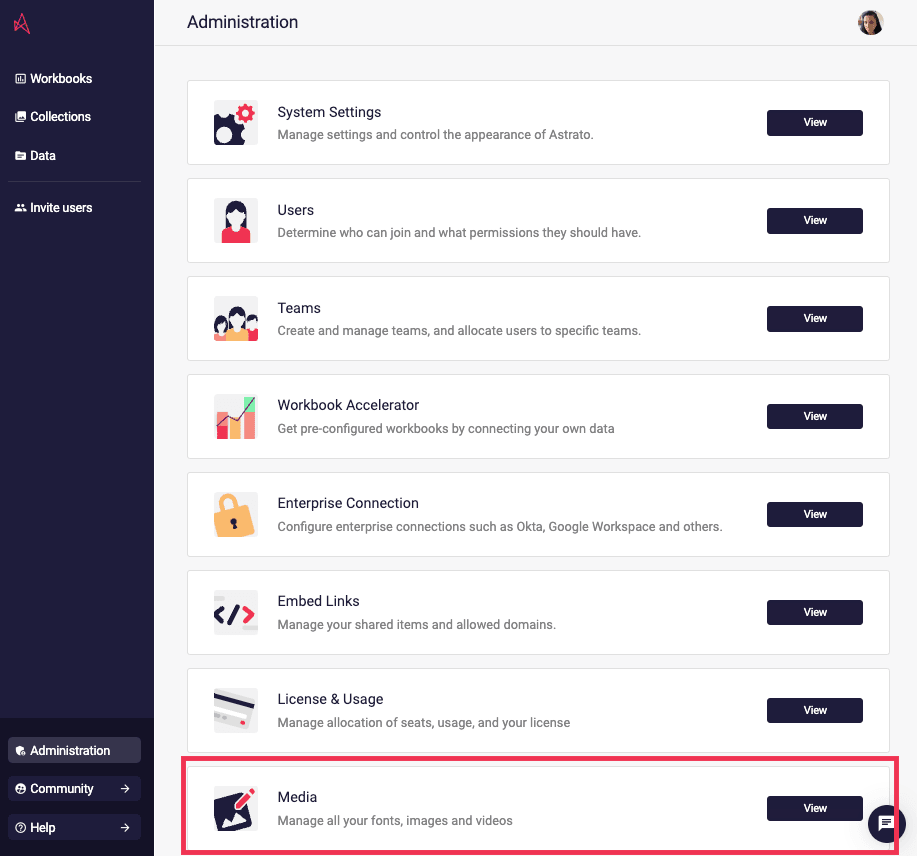
Astrato: Section name visible as the browser tab name
Section titled “Astrato: Section name visible as the browser tab name”When using Astrato, the section name is visible on the browser tab, so even if you have many browser tabs open, you know which browser tab or window is the one you want.
Actions: Logic/Conditions - Writeback block
Section titled “Actions: Logic/Conditions - Writeback block”Create action flows that write back values to your database. With the new Writeback block, select any table defined within your workbook’s semantic layer, and add the columns and values you would like to write to the database. You can add a Button click to trigger the action.
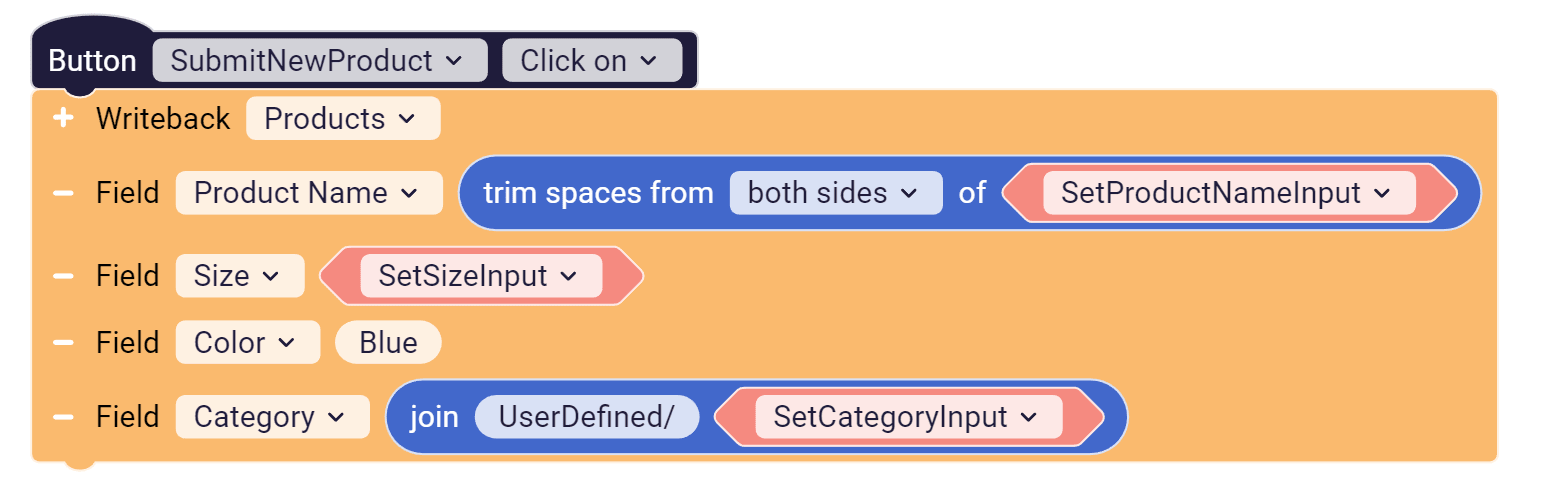
Actions: Logical - And / Or
Section titled “Actions: Logical - And / Or”Using the Logical And / Or action block lets you perform logical operations as part of a conditional.
Use the flexibility of “and” and “or” operators to create custom automated workflows with complex conditions for your Actions.
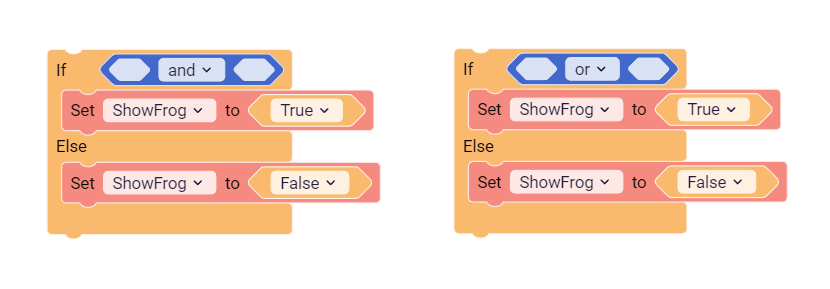
Semantic Layer: Source table name displays with the field name
Section titled “Semantic Layer: Source table name displays with the field name”When you create a copy of a table and change its name, we now display the name of the source table. This is visible in the Preview table header, the Edit table screen, and when you hover over a table header in the table schema or over a table name in a selected period.
Semantic Layer: Two clicks to duplicate custom measures
From the list of your custom Measures in the semantic layer, click on the context menu (three dots), and click Duplicate.
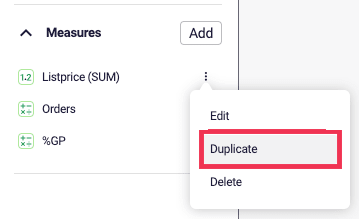
Adjust the measure as required - for example, its filters, predefined dates, and operators; and save it with a new name and description for use across the workbook.
Semantic Layer: Filters - Option of ‘In list’ as a filter added
Section titled “Semantic Layer: Filters - Option of ‘In list’ as a filter added”You can now apply a filter for an item that is either IN or NOT from a list.
Layers: improvements to layout and search
Section titled “Layers: improvements to layout and search”The Layers menu has been updated to improve the clarity of icons and spacing of items displayed. You can also click on the square to dock or allow the menu to hover (1) and move around as needed.
Click the magnifying glass at the top to Search through the list of items, or click All items to sort the list (2).
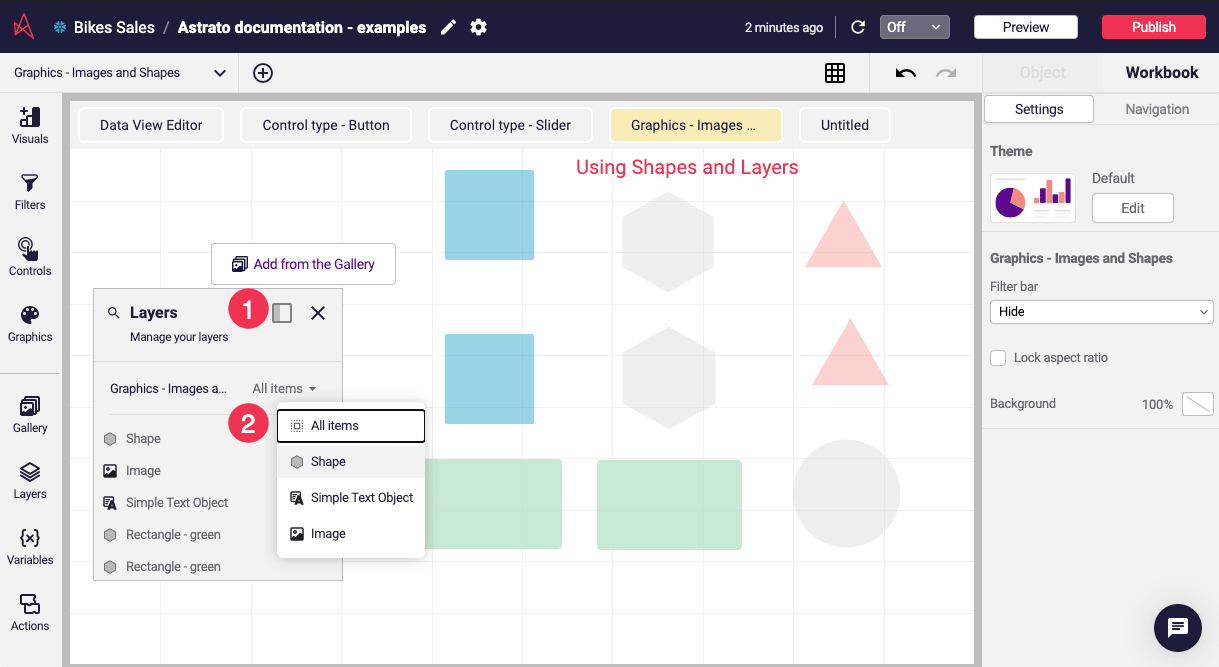
Workbook Editor: design uplift of right-click menu
Section titled “Workbook Editor: design uplift of right-click menu”Improved spacing, re-order of options, and new iconography have been added to the design of the right-click object context menus (cut, copy, paste, export, etc.).
Depending on the object, you have the option to: copy, duplicate, cut, paste, delete, lock group, arrange, show in layers, view the Data query insights, and export to CSV or XLSX.
Viz-1.3 - 14 March 2023
Section titled “Viz-1.3 - 14 March 2023”Filters: Slider object to select ranges
Section titled “Filters: Slider object to select ranges”We’re excited to announce the release of our new range Slider object to filter values in your dashboard. Easily drag the slider’s handles to select a range of values for a numeric or date field and instantly see the corresponding data filtered in your dashboard. In SQL, we select BeETWEEN.
Add the slider by navigating to the Filters section and clicking or dragging the Slider object icon onto the sheet.
Some key features of the range slider object include:
-
Customizable range and step size: You can adjust the minimum and maximum values of the slider to suit your data and adjust the step size for finer or coarser control.
-
Distribution bars: The slider can help display frequency like a histogram (as well as other measures) to show the volume of data available before making a selection, to reduce queries to the connected data source.
-
Smooth animation and responsiveness: The slider smoothly animates to reflect your input, and the dashboard instantly updates as you adjust the range.
-
Multiple sliders for complex filtering: You can add multiple range sliders to your dashboard to filter data based on multiple criteria simultaneously.
The filter bar now includes the slider by default when numerical or date fields are added.
Control: Button - new style and icon options
Section titled “Control: Button - new style and icon options”At Astrato, we build for our customers; in this release, we’ve added three feature requests from our Community page to improve the styling possibilities of the Button control.
Some key features of the new styling settings include:
-
Icon: The button can display an icon on the left of the button label. Enable the icon and choose from a wide variety of icons. The icon color is configurable for both the default and hover states.
-
Default style: Enable and configure a drop shadow for the button’s default state. When enabled, it’s possible to configure the color, the offset, and the blur of the drop shadow.
-
Hover style: We have enabled settings to configure the look of the button when the mouse cursor hovers over the button. Settings include text color, background color, icon color, border, and drop shadow.
-
Click animation color: Configure the color of the click animation to fit with your brand colors.
Combo chart - data labels for bars
Section titled “Combo chart - data labels for bars”Data labels on Bar charts are now available for our Combo chart too.
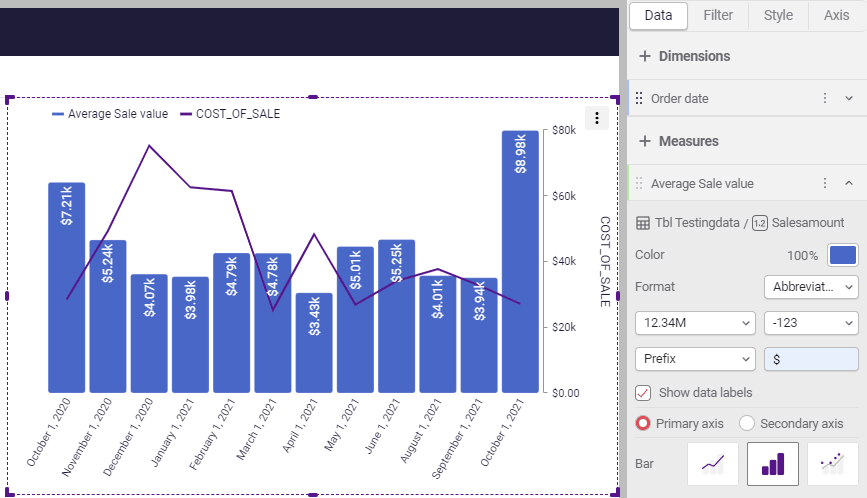
2.32 - 13 March 2023
Section titled “2.32 - 13 March 2023”Semantic Layer: Interaction improvements
Section titled “Semantic Layer: Interaction improvements”Continuing our efforts to improve the ease of interacting with your data in the semantic layer, we’ve added the following:
- Fewer steps for navigation - There’s no need to click the Data Explorer tab, as you can now click the option to Edit table added to the context menu (above Preview table).
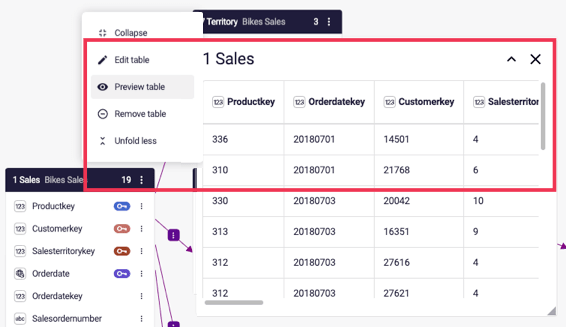
-
Tooltips on the semantic layer action bar - hover over the icon to view a tooltip briefly describing its function.
-
Descriptive error and warning messages - include error text if a combination of filters returns no records, and a warning displays to confirm you want to Remove all joins.
-
Animation on the blank canvas shows the steps to add custom columns, dimensions and measures in the semantic layer.
Actions: Operator - INVERT - Boolean
Section titled “Actions: Operator - INVERT - Boolean”Use the INVERT action block to invert a boolean value. This allows you to have tidier show/hide action flows, as you don’t need to create a complex IF statement to control the visibility of objects to check whether a variable is true or not; now, you can easily toggle the visibility of an object.
This becomes very powerful when combined with the new object action blocks GET and SET.
Before:
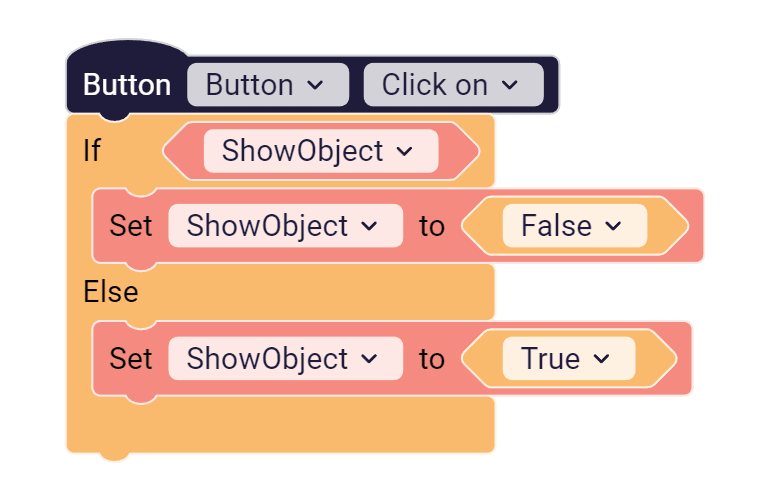
Now:

Actions: GET and SET Object Properties
Section titled “Actions: GET and SET Object Properties”GET and SET the properties of an object’s visibility using this new action block.
Previously the visibility of objects was controlled by assigning them to a boolean variable. Now you can control both the boolean value and the visibility of an object directly from an action (as in the example above).
2.31 - 27 February 2023
Section titled “2.31 - 27 February 2023”Workbook Editor: Toolbar and panel redesign
Section titled “Workbook Editor: Toolbar and panel redesign”We’ve redesigned the Astrato toolbar and its panel as part of customer feedback.
There’s a Search field at the top when the panel expands so that you can search directly. We’ve split them into two broad categories - design, and advanced tools for analysis and interaction.
Design
-
Visuals - Icons are monochrome, so the details are easier to see and improve the differentiation of the list of data objects.
-
Filters - Dynamic filters.
-
Controls - Button, Input form.
-
Graphics - Text, Shapes, Image (URL).
Advanced tools for analysis and interaction
-
Layers - adding and managing layers of objects.
-
Variables - creating number, string, or Boolean variables.
-
Actions - create advanced actions using our no-code blocks.
Added new Graphics article
Section titled “Added new Graphics article”As part of redesigning the toolbar, we’ve added the article Using Graphics in the Workbook Editor with instructions on style, formatting, and layout for text boxes, shapes, and images.
Workbook Editor: Navigation style updates
Section titled “Workbook Editor: Navigation style updates”We’ve removed the extra color band at the top of the workbook, so it looks less busy, and you have a bigger canvas to design your dashboards.
Data: Semantic Layer layout and joins redesign
Section titled “Data: Semantic Layer layout and joins redesign”Our data engine now delivers the schema view in a clean tree structure. Tables with joins are arranged at the top. All other tables are arranged in a grid sorted by the time they were added to the semantic layer. Tables without joins also have a lighter color to differentiate them further.
When a user applies the ‘suggested joins,’ we apply the best layout for your tables in the semantic layer.
If you prefer to arrange your tables differently (for example, in a star with the main table in the middle), Astrato can save your arrangement.
Please note: If you remove or add tables, we can’t load your saved schema; the default schema will display.
Semantic Layer: filtering dimensions and measures in the Data Explorer
Section titled “Semantic Layer: filtering dimensions and measures in the Data Explorer”In the data explorer, you can now filter by the values of the measures.
Clicking the filter icon at the top of the column automatically displays the range for that column. Select the values manually or use the slider to filter the data in the column.
Lobby: My drafts as default
Section titled “Lobby: My drafts as default”When you have a draft workbook, the My drafts tab becomes the default tab in the Astrato lobby to access your content faster.
Actions: Full-Screen view editor and improved navigation
Section titled “Actions: Full-Screen view editor and improved navigation”You now have a nearly infinite workspace provided to build your actions. The action bar also has new options including:
-
Scaling options
-
Zoom in/out
-
Mouse scroll
-
Option to ‘Fit to screen’ that scales and adjusts the zoom automatically so you can see where everything is on your canvas.
Viz-1.2 - 27 February 2023
Section titled “Viz-1.2 - 27 February 2023”Properties panel: Search field added above list of date ranges
Section titled “Properties panel: Search field added above list of date ranges”For dates and strings filters, a new combobox (Search and a list of values) has been added.
On the Object styling options, click the Filter tab, and click Chart to add a filter. You can use the Search field to find the value in the column, or select from the:
-
Pre-defined “calculated dates” by clicking Date Range at the top of the list presented (e.g. Last 30 days, Previous year, Yesterday).
-
List of boolean options (e.g. equals, greater than, is null/empty).
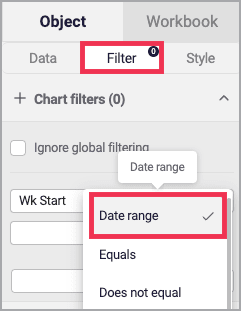
Properties panel: Added chart filter count on the Filter tab
Section titled “Properties panel: Added chart filter count on the Filter tab”When you add a chart, filter a badge displays on the tab with a count number. If there are more than nine filters added, it shows 9+.
Properties panel: Radius icon refined
Section titled “Properties panel: Radius icon refined”We’ve refined the icon to clarify what part of the object is affected by changing the number in the field. You can adjust the radius of the border/corner between 0-100.
This border option can be applied to the text, button, and filter objects. Use the following paths from the toolbar options:
-
Text object: Graphics > Text box > Layout > + Border
-
Button: Controls > Button > Style > Border
-
Filter: Filter > Style > Object > Border
Viz-1.1 - 15 February 2023
Section titled “Viz-1.1 - 15 February 2023”Workbook Editor: Include table and original field names
Section titled “Workbook Editor: Include table and original field names”On the Data tab, we’ve added context to display the original table and field name in both the Measures and Dimensions sections.
This information provides context when working with data across multiple tables to avoid the correct field name being added from the wrong table.
Workbook Editor: Cell selection in a table
Section titled “Workbook Editor: Cell selection in a table”You can now select a cell in a table instead of the whole row.
A click in the cell selects it, highlighting other linked visualizations. This works in both directions, so you can more quickly and accurately select individual cells within a row.
2.30 - 13 February 2023
Section titled “2.30 - 13 February 2023”Data: Connect to Google BigQuery with JWT
Section titled “Data: Connect to Google BigQuery with JWT”We’ve added authentication support for non-Google account-linked usernames and passwords. Key benefits:
-
Non-domain users can view data that are unique to them (for example, for OEM use)
-
Using a service account to manage public-facing dashboards is possible.
Actions: Execute SQL
Section titled “Actions: Execute SQL”Use the SQL blocks to create string variables that bring back a value or trigger further downstream processes.
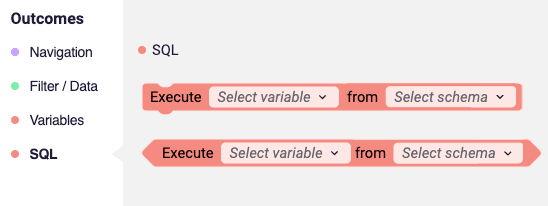
Semantic Layer: Export to CSV
Section titled “Semantic Layer: Export to CSV”When using the Data Explorer functions in the semantic layer, you can now export files to CSV in addition to XLSX format for download. This provides users with more flexibility to view data in multiple editors.
Semantic Layer: View Query Insight in the Data Explorer
Section titled “Semantic Layer: View Query Insight in the Data Explorer”When using the semantic layer’s Data Explorer functions, click the View Query Insights button to view the SQL query details displayed with markup.
Semantic Layer: Drag and drop to change column positions
Section titled “Semantic Layer: Drag and drop to change column positions”When using the Data Explorer functions in the semantic layer, you can rearrange the order of your columns to make viewing the data you’re interested in easier.
Simply click on the column header you want to move and drag and drop the column to its new position.
Viz-1.0 - 03 February 2023
Section titled “Viz-1.0 - 03 February 2023”Selecting sequences
Section titled “Selecting sequences”Users can select across a sequential (numerical or time-based) axis to find more information. This feature applies to Bar, Line, and Combo charts.
All values on the dimension axis within the sequence are selected. This is enabled in Preview mode and on published workbooks.
Scatter charts brushing and point selection
Section titled “Scatter charts brushing and point selection”Scatter charts have a new brushing method; draw a ‘lasso’ (circle) around data points to select them, or draw a line across the points you wish to select.
Property Panel: Filter styles on objects and progress bar added
Section titled “Property Panel: Filter styles on objects and progress bar added”Our update to Filter styles allows you to apply the same formatting styles (font type, size, and background color) to all instances of the object within your workbook (or worksheet/s).
Consistent styles help create a more cohesive and visually appealing presentation of your data app. It also makes it easier to identify and distinguish different Filter objects within your workbooks quickly.
It’s also useful if you’ve used a dark background on your dashboard. It’s part of our commitment to helping you make beautiful dashboards.
Table Conditional Coloring
Section titled “Table Conditional Coloring”Highlight specific cells or rows based on values present in the data. Table conditional coloring makes it easier to quickly identify your data’s trends, patterns, and outliers. This can be particularly useful when working with large datasets or making sense of complex data relationships.
-
Highlight cells or rows that fall above or below certain thresholds (e.g., budget limits, performance benchmarks).
-
Color-code cells based on categories or groups (e.g., different product lines, regions).
-
Apply different colors to cells or rows based on the magnitude of their values (e.g., red for low values, and green for high values).
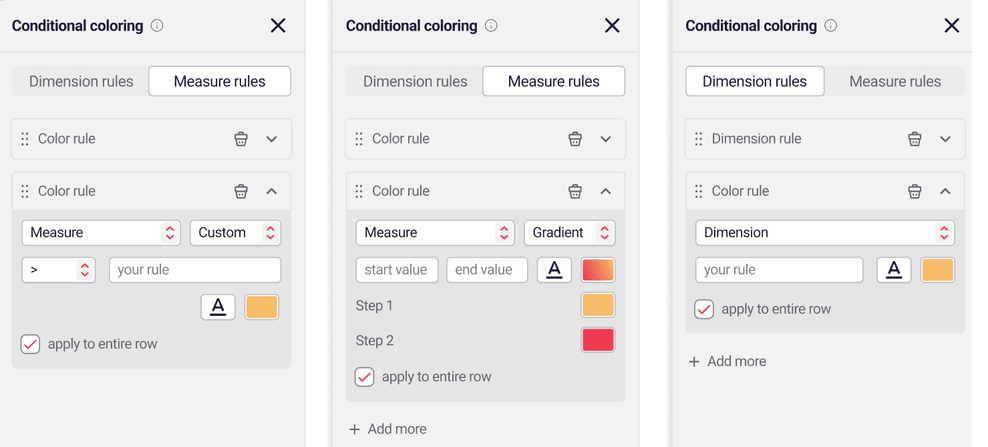
Workbook Editor: Table minimum column width
Section titled “Workbook Editor: Table minimum column width”When you select your table object, the layout option for columns includes options for Auto-width or Fixed width and a new input box to specify the minimum width. You can change the minimum width in auto mode; the default is 70 pixels.
We’ve also enabled horizontal scrolling, so there’s no need to set very narrow columns in your table.
Predefined periods renamed to Date Range
Section titled “Predefined periods renamed to Date Range”In the property panel, Data tab, we’ve renamed predefined periods to “date range” and moved it to the top of the list of operators and Boolean expressions.
2.29 - 30 January 2023
Section titled “2.29 - 30 January 2023”Actions: String (Text) Operators
Section titled “Actions: String (Text) Operators”We’ve added text operators to our list of no-code Actions options. Simply drag and drop the text blocks to build your dynamic Actions.
Block functions include:
-
replacing or joining string values
-
manage text formatting
-
keyword highlighting
Workbook Editor: Sheet layout template for Custom Report
Section titled “Workbook Editor: Sheet layout template for Custom Report”New template option for Custom Report (self-service) in the Sheet layout options makes it quick and easy to start building your custom report.
2.28 - 17 January 2023
Section titled “2.28 - 17 January 2023”Workbook Editor: Custom Report
Section titled “Workbook Editor: Custom Report”Astrato’s Custom Report allows your users to explore live data with confidence. This can reduce ad-hoc requests to BI and data teams and streamline report building by exploring your data warehouse directly.
It’s easy to set up; add the Custom Report object on a new worksheet and allow your users to select from the predefined dimensions and measures in your workbook.
Administration: Update Embed links content with sorting and filtering
Section titled “Administration: Update Embed links content with sorting and filtering”You can sort and search for embedded links as a Lobby visitor in the Embed section.
Actions: Math Operators
Section titled “Actions: Math Operators”We’ve added math operators to our list of no-code Actions options. Simply drag and drop the math blocks you need and type in your variables.
We support large numbers and Snowflake number formats.
Actions: OnFilterInField Event
Section titled “Actions: OnFilterInField Event”The event triggers when a Filter has been applied or is pending in a field.
2.27 - 17 January 2023
Section titled “2.27 - 17 January 2023”Workbook Editor: Copy and Paste objects between workbooks
Section titled “Workbook Editor: Copy and Paste objects between workbooks”Selecting objects is easier, and copying and pasting are possible between workbooks.
The object retains its connection to the semantic layer, and before it’s pasted into the new workbook, we check whether the data connection is the same.
If it’s not the same, we paste the object in a preview state without the dimensions and measures from the original workbook. The rest of the object’s properties are included with the copy.
Actions: OnAny Filter Event
Section titled “Actions: OnAny Filter Event”Trigger actions when a Filter is either pending or applied.
2.26 - 19 December 2022
Section titled “2.26 - 19 December 2022”Semantic Layer: Date filter options - predefined periods
Section titled “Semantic Layer: Date filter options - predefined periods”We’ve listed on a page the predefined periods to filter data for past and current dates. The same options are used across our Custom Measures filters, the workbook with measures, and the chart filters in the property panel.
Property panel: Data field selection improvements
Section titled “Property panel: Data field selection improvements”The new design in the property panel includes icons for each data type and collapsible menus for each table section.
Administration: Snowflake Consumption app installation
Section titled “Administration: Snowflake Consumption app installation”Administrators can add the Snowflake consumption app to their organization’s list of workbooks.
The app displays the Snowflake consumption linked to the defined Snowflake data connection when you set up the app.
Please note - All users given access to a workbook must have permission to view the data; the error message “Your data query is invalid” displays on the workbook.
2.25 - 12 December 2022
Section titled “2.25 - 12 December 2022”Semantic Layer: Time filter for Custom Measures
Section titled “Semantic Layer: Time filter for Custom Measures”When creating a custom measure, you can now select from predefined time ranges (e.g., YTD, Last 7 days, Previous month) when using Date as a measure. We’ve organized the list of time ranges by those generally used more often.
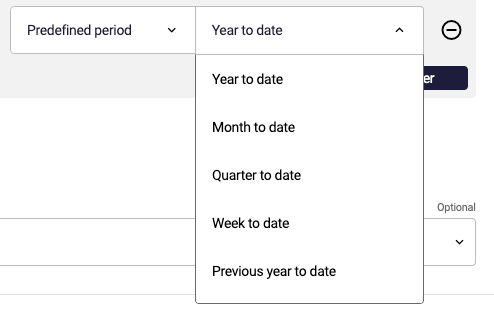
Semantic Layer: Astrato’s Data Engine - joins
Section titled “Semantic Layer: Astrato’s Data Engine - joins”We’ve added information about Astrato’s Data Engine and how it helps to avoid common BI mistakes like Fan Traps. The article also details the key features of join quality that can improve your BI outcomes.
Property panel: Font options added to objects
Section titled “Property panel: Font options added to objects”When editing a table, text object, number object, or filter, you can apply a font style directly from the property panel. The list of fonts available in Astrato includes web-safe fonts and some Google fonts.
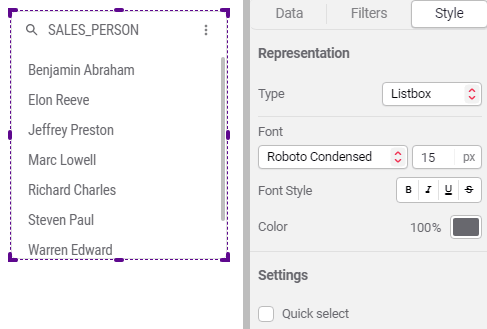
Workbook Editor: Object selection and placement made easier
Section titled “Workbook Editor: Object selection and placement made easier”When editing your workbook, it’s now easier to rotate, select and move objects in groups.
We’ve also improved the helper grid settings to include options to ‘snap’ objects to the grid, in addition to the helpful layout guides that show alignment and add padding (white space) between your objects.
Administration: Consumption Licensing - view usage as credits or minutes
Section titled “Administration: Consumption Licensing - view usage as credits or minutes”Astrato Enterprise users can view their license consumption by minutes in addition to credit blocks.
Data Connections: Dremio Cloud
Section titled “Data Connections: Dremio Cloud”Astrato supports data connections to Dremio Cloud.
2.24 - 23 November 2022
Section titled “2.24 - 23 November 2022”Actions: New Event: Before the workbook opens
Section titled “Actions: New Event: Before the workbook opens”We’ve added a new Action trigger event- ‘Before workbook opens’. You can use this new trigger to apply a Navigation action, for example, to select a specific sheet within your workbook to display first.
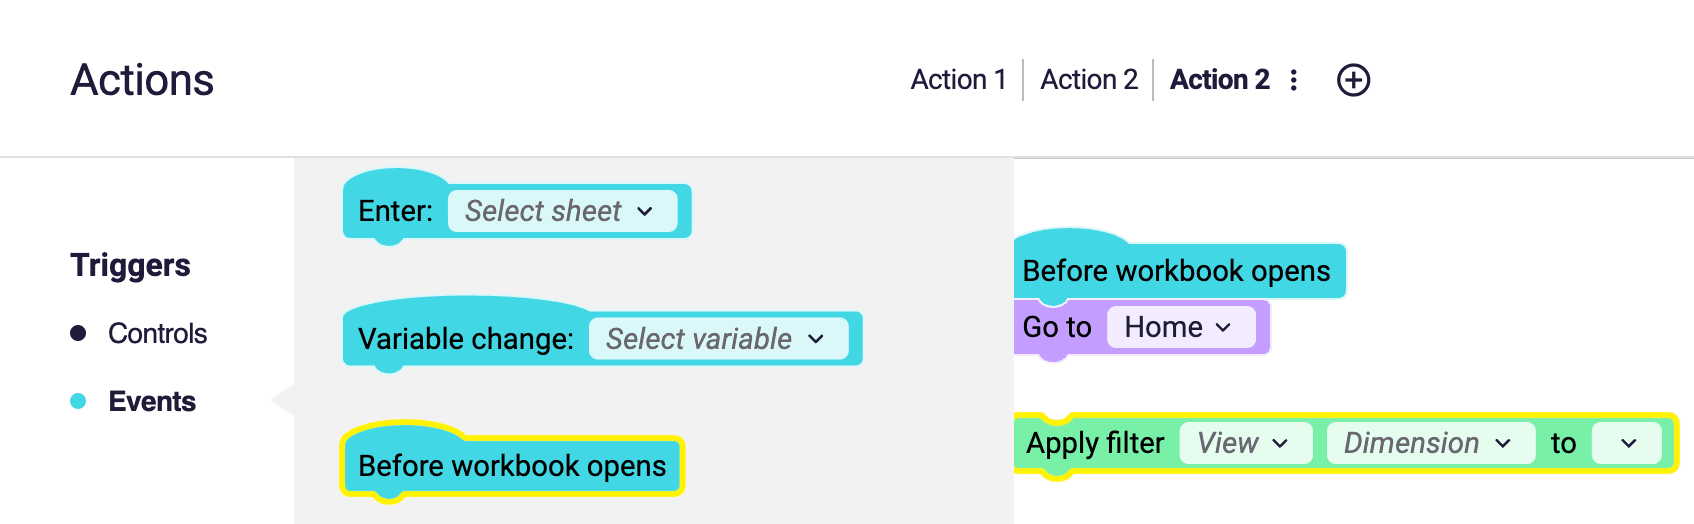
Charts: New Table Mini charts in the Visual representation options
Section titled “Charts: New Table Mini charts in the Visual representation options”From the Data tab, in the property panel under Columns, use the Visual representation slider to add mini charts sparklines, and bars on each table row, for a given measure. Gain extra insight without needing any more than a table.
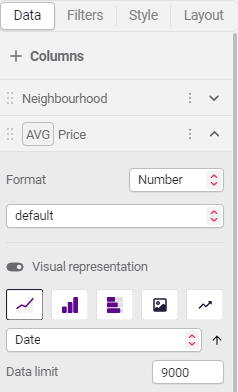
When mini charts are added, the Style tab displays the formatting options, where you can apply styles to each of your mini charts.
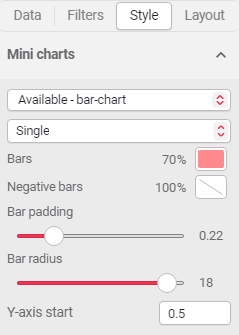
If several charts are added to the table (from various measure columns) we display these options in the dropdown for the user to select.
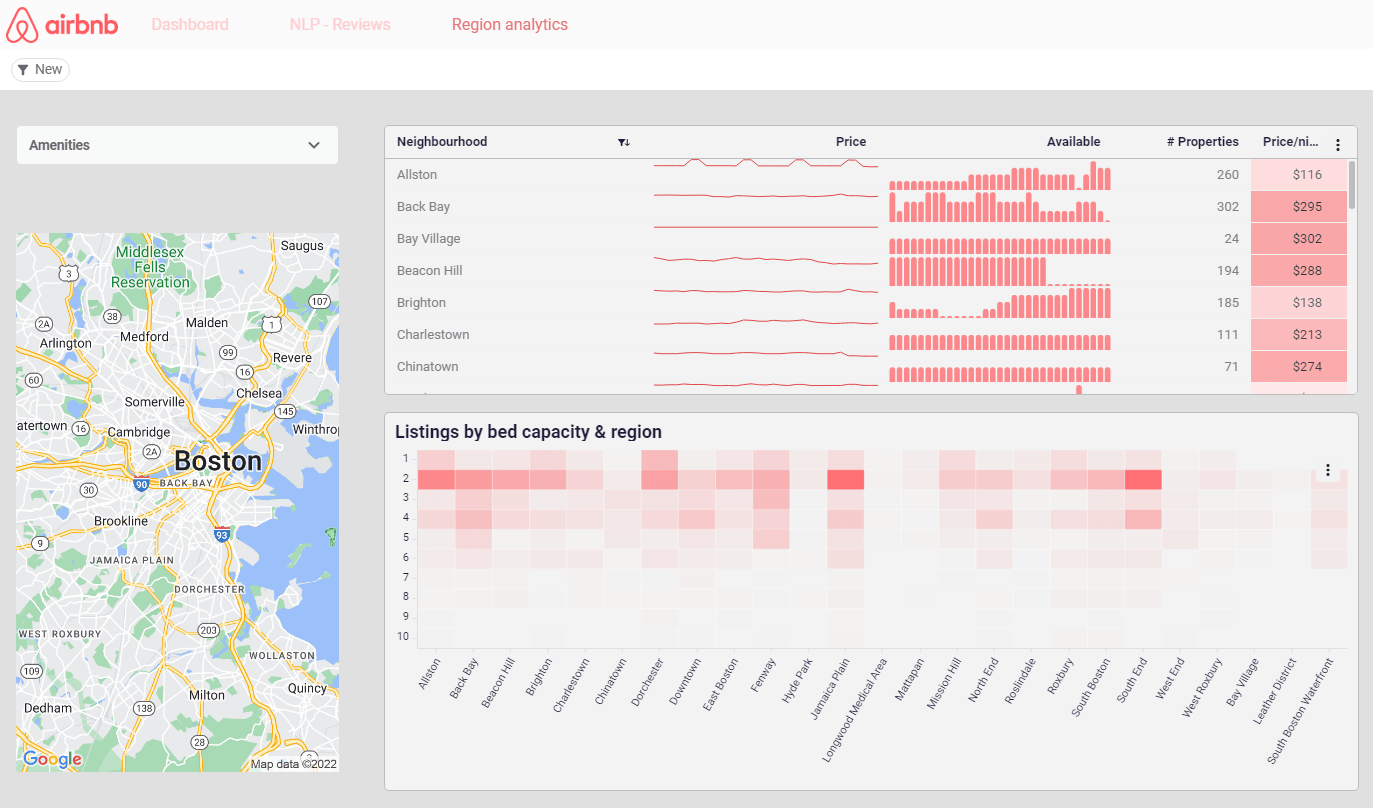
Administration: Search the list of users by name or email
Section titled “Administration: Search the list of users by name or email”In the Administration section, click Users to view the complete list of users. Type a user’s name or email in the Search field to find them quickly.
Charts: Data Object - Date ‘Group as’ options
Section titled “Charts: Data Object - Date ‘Group as’ options”When selecting a Date as a Dimension, you can use either the Default format or select Grouped as.
Selecting ‘Grouped as’ allows you to select from options such as ‘Month Year’ and select the format you prefer. A Custom format option is also available.
Tick the Null values box to view dates that are missing.
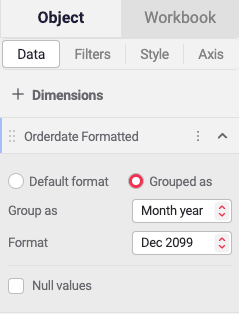
Adminstration: Embed - detailed sorting and searching
Section titled “Adminstration: Embed - detailed sorting and searching”From the Admin options, if you use Embeds, and have permission to view them, there are detailed sorting and searching options to help you manage your Embedded links.
The options are: Created by, Date, Name, Permission type, Requirements, Sort, Specific user, Type (Object, group, sheet), Workbook name, and Workbook used.
2.23 - 07 November 2022
Section titled “2.23 - 07 November 2022”Licensing and Usage
Section titled “Licensing and Usage”License and Usage is the new section for Enterprise-level customers to organize their users and assign them to teams, with each team assigned the most appropriate licensing model.
Consumption-based licensing usage is measured using credits that are monitored per user and by a team.
The Administration area allows Owners and Administrators to change the license type, create teams, and view and allocate the credits to a user or a team.
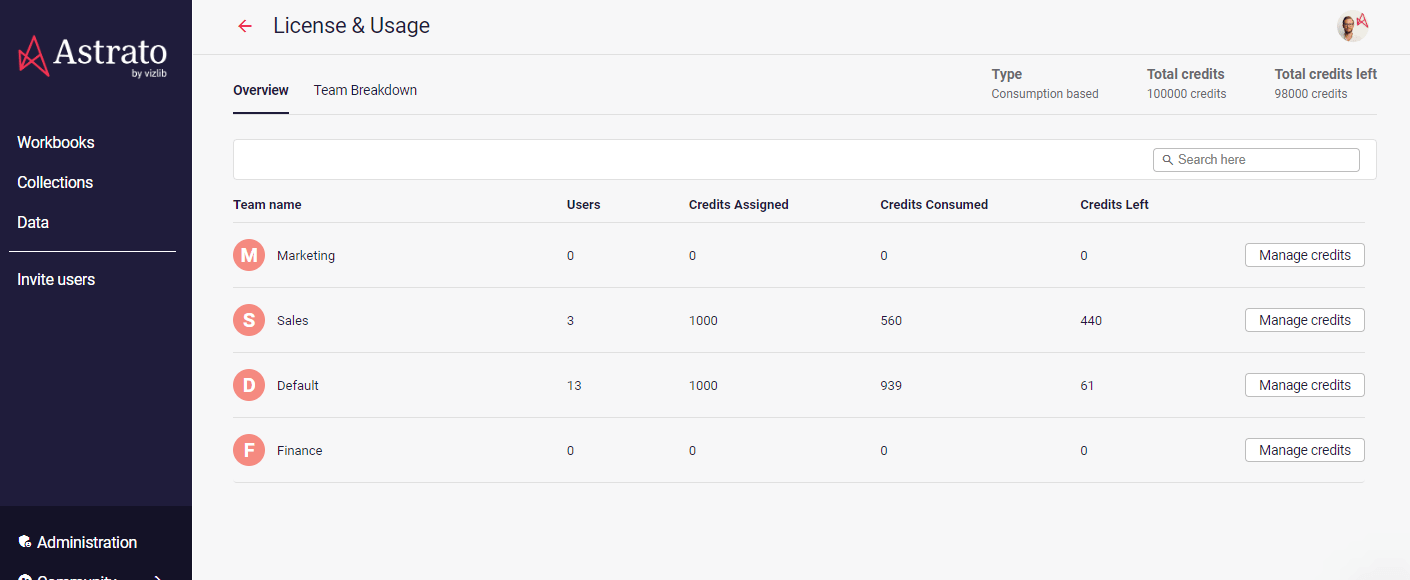
Explore the new License & Usage page here (requires Admin access).
Administration: Managing Users and Teams
Section titled “Administration: Managing Users and Teams”The options for managing Users and Teams are visible in the Administration area of Astrato.
There’s no need to import users into Astrato. From the sidebar, click Invite Users to add Users or Teams. When users accept their invitation and log in to Astrato, their account status changes from Pending to Active.
Please note: the User section and the list of users are visible to all user roles; however, the Teams option and the bulk of Administration functions are not.
Data: Data Source - more details visible
Section titled “Data: Data Source - more details visible”More details about each data source are displayed when viewing your data sources. This includes:
-
Data Source Name,
-
Database Name,
-
Creator,
-
# of semantic layers connected to the Data Source,
-
Last Modified Date.
Click here to explore your data source
Back to Top
2.22 - 26 October 2022
Section titled “2.22 - 26 October 2022”Update data limits in charts
Section titled “Update data limits in charts”Charts can display more data points. There’s no change to the Table, as it just adds more pages. Data point limits for the following charts are now:
-
Line - 3,000
-
Filter - 30,000
-
Bar - 1,000
-
Heatmap - 2,000
-
Scatter - 15,000
-
Gauge / Pie chart - 100
Custom sorting
Section titled “Custom sorting”Sort by measures or dimensions without needing to add them to the visualization. More analytical power, without the extra code.
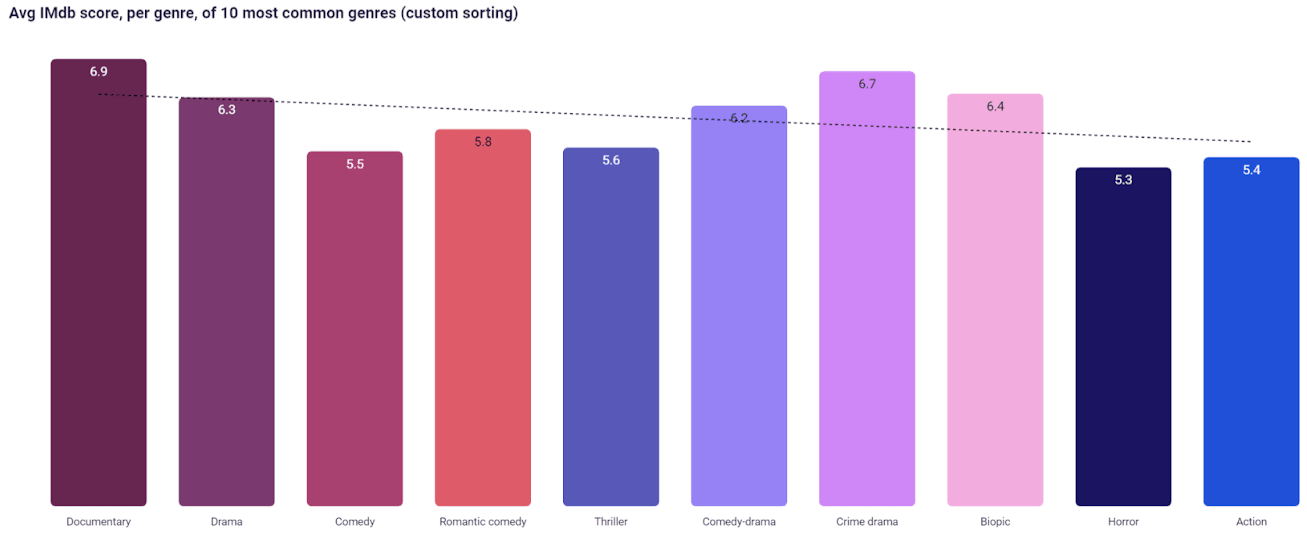
Filter bar update - add new filters
Section titled “Filter bar update - add new filters”Any filter can be added to the workbook using the add New filter button located in the filter bar. No need to clutter workbooks with dropdowns and filter boxes, explore and add easily.
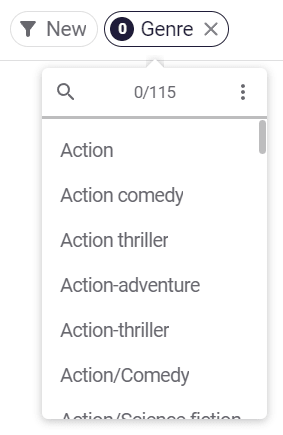
Option to ‘ignore global filters’
Section titled “Option to ‘ignore global filters’”We now have options in data objects to ignore the global filter state - a great way to do a comparative analysis between overall data vs a filtered dataset.
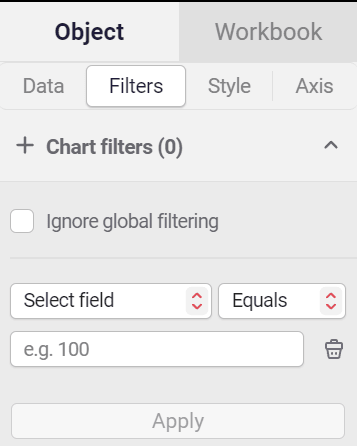
2.21 - 07 October 2022
Section titled “2.21 - 07 October 2022”Actions - no coding drag and drop
Section titled “Actions - no coding drag and drop”Use the Actions feature to add interactions and logic functions to your workbook - all without writing any code.
Simply drag and drop the actions you want to perform visual changes to your data, or add interactive actions that modify the worksheet or navigation.
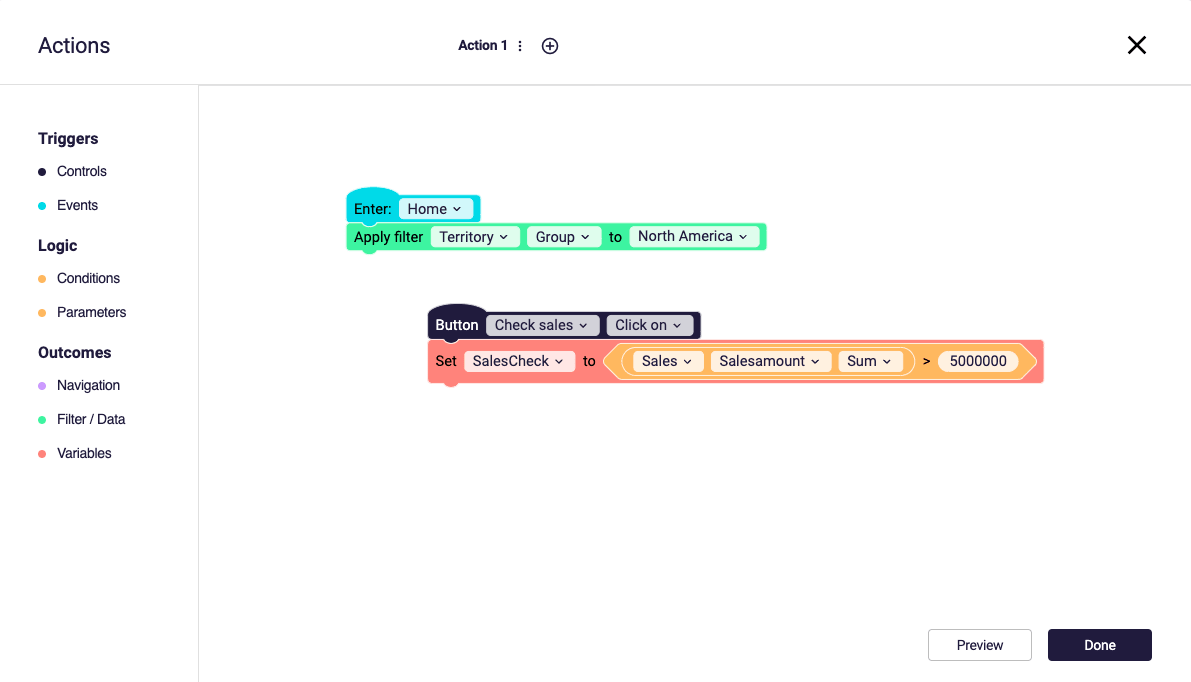
Export as - CSV, XLSX, PDF, or PNG to print
Section titled “Export as - CSV, XLSX, PDF, or PNG to print”Use the ‘Export as’ or the ‘Object > Copy to clipboard’ to create output that you can print from Astrato.
Legends showing up even on small charts
Section titled “Legends showing up even on small charts”Legends always show on charts even if you make them very small.
Color changes
Section titled “Color changes”-
Brushing and Selection - Visually link charts to their table data using color. Apply unique color to a dimension to show relationships across data objects.
-
Color opacity - New easy-access opacity setting for color swatches. The opacity percentage is shown in the properties panel. An example is to use this feature to adjust the color on a scatter chart, visualizing the density of the points on a scatter chart.
2.20 - 26 September 2022
Section titled “2.20 - 26 September 2022”Google BigQuery - data source
Section titled “Google BigQuery - data source”In addition to Snowflake, and PostgreSQL Astrato supports Google BigQuery data connections.
Data Explorer
Section titled “Data Explorer”Using the Data Explorer, quickly look at the data to confirm the quality and completeness of the dataset before you start building your visualizations.
Custom Measures - aggregate expressions and more …
Section titled “Custom Measures - aggregate expressions and more …”Create the metrics that suit your business using orders of operation with multiple fields, aggregation, and filters- no coding required.
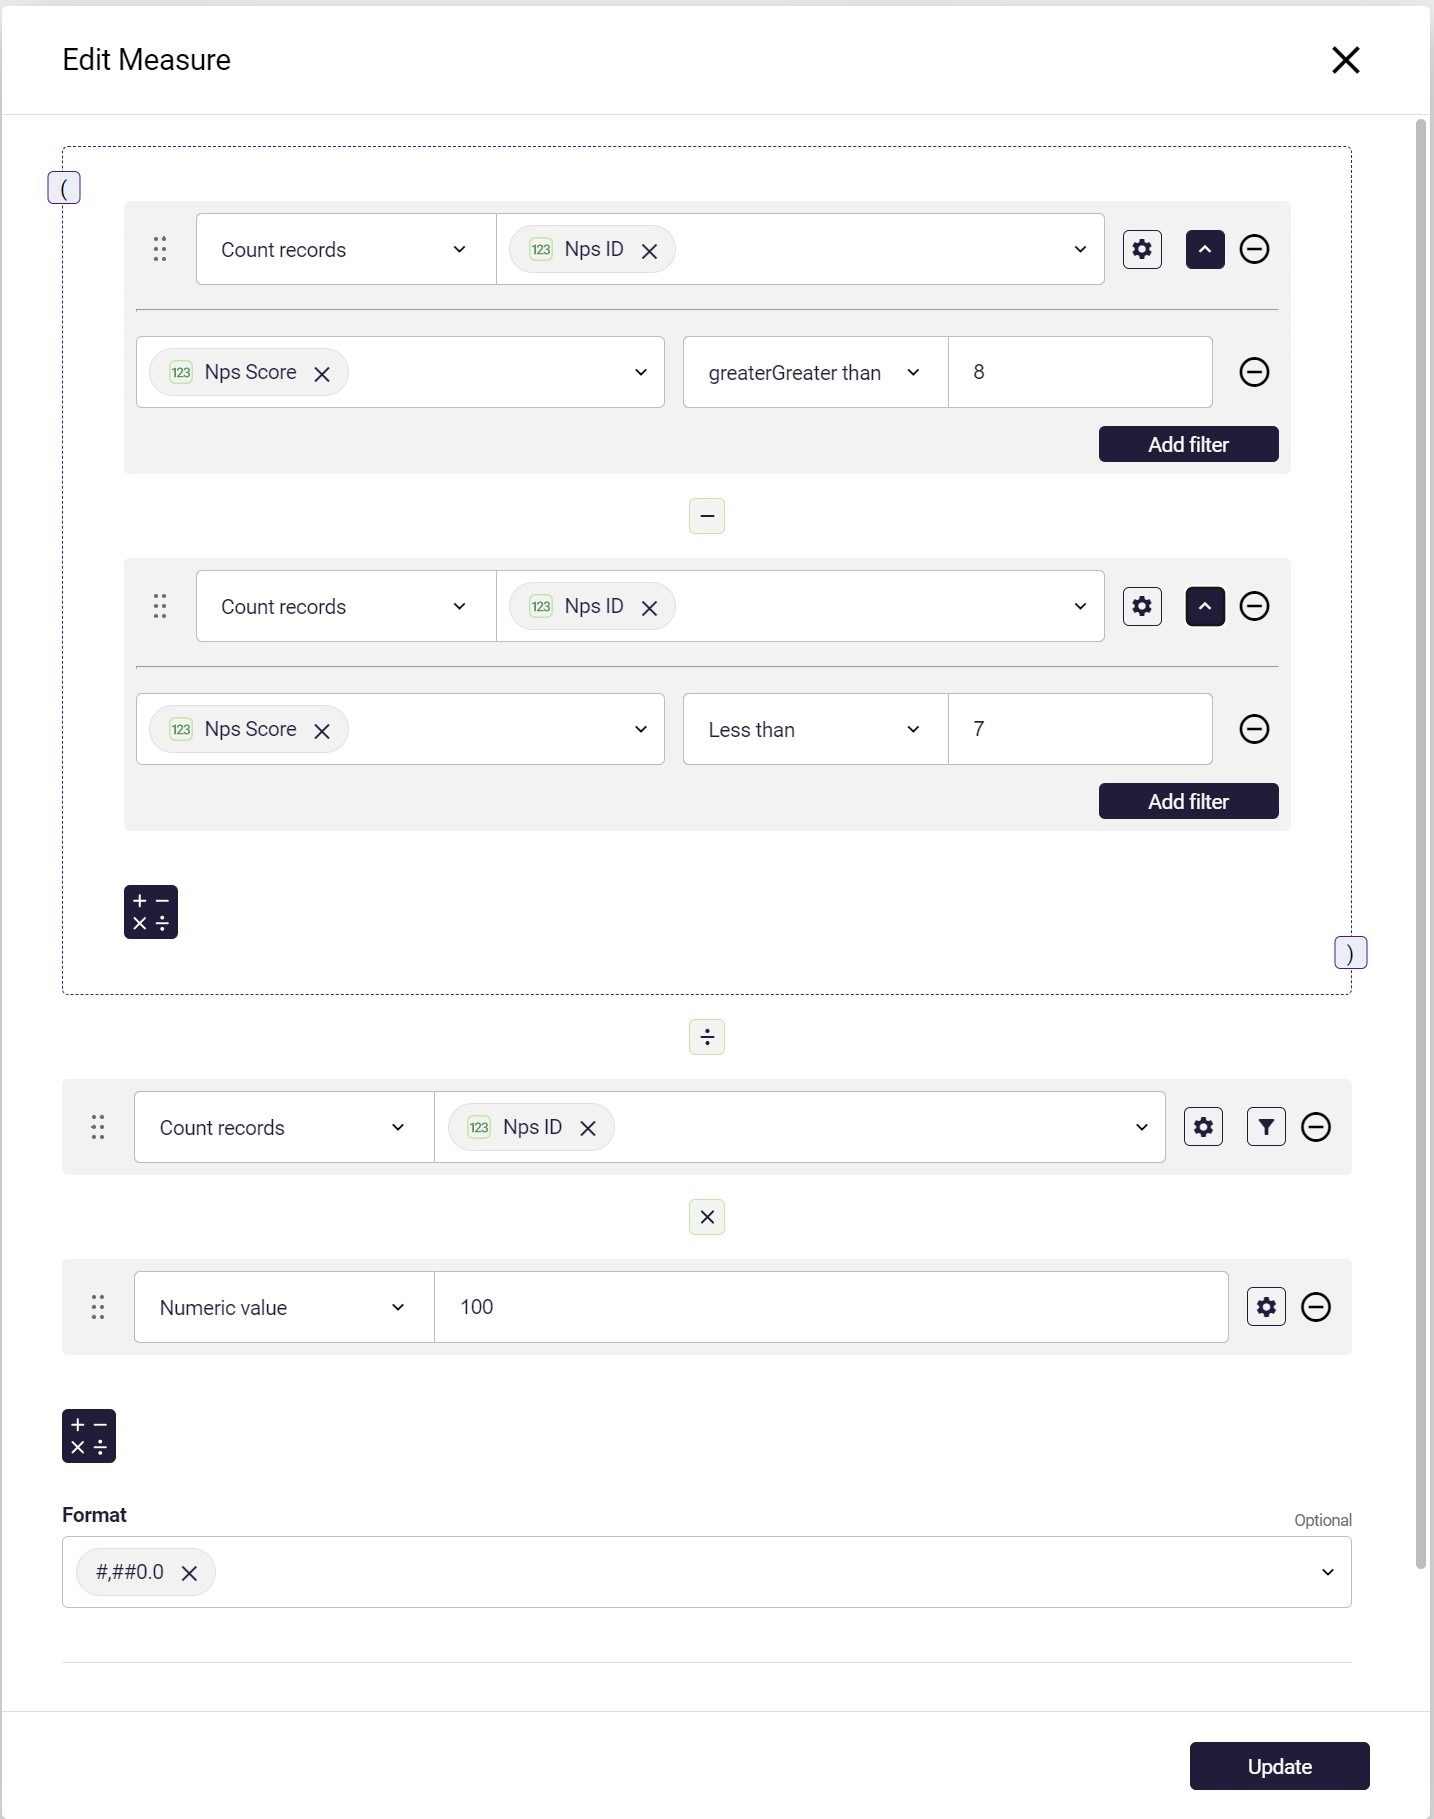
Custom fields
Section titled “Custom fields”Create new column measures using this feature to extend the tables in your data source with any ‘last-mile’ dashboard changes - all in a no-code UI.
Create new fields using text strings, with functions such as concatenate, replace and trim to tidy your data. There are also options for date and calculation functions.
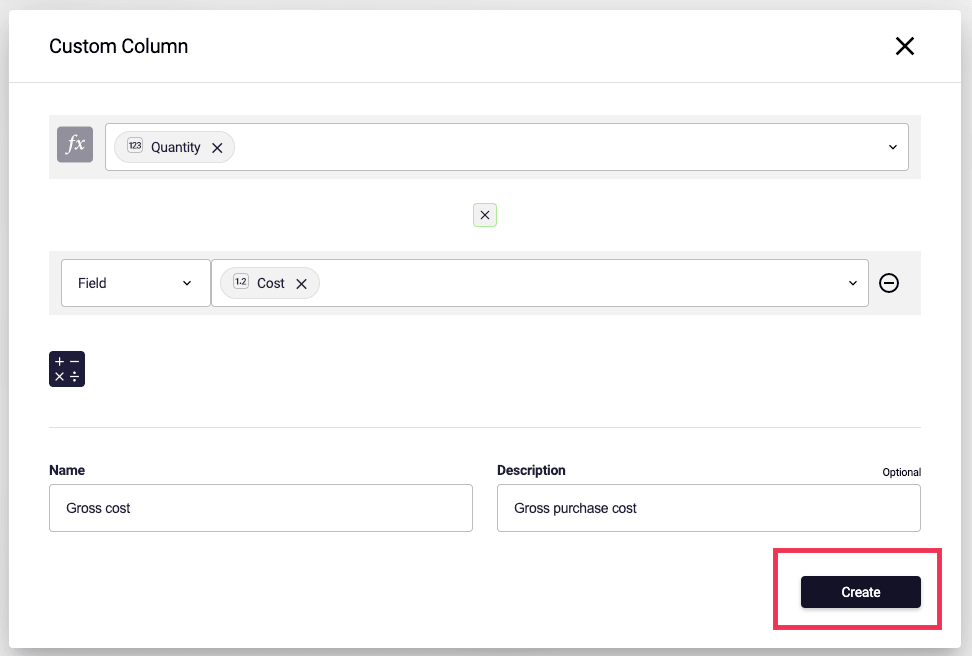
Value picker
Section titled “Value picker”Pick a value directly from the chart filters.
Date group or Timestamp
Section titled “Date group or Timestamp”Instantly create a chart (e.g. timestamp and value = month or hour, day of the week, etc.).
Axis bands on charts
Section titled “Axis bands on charts”Highlight the chart itself. Assign color bands and name them (e.g. benchmarks).
Font options
Section titled “Font options”-
Web-safe fonts - We now offer a choice of web-safe fonts.
-
Text shadow formatting - Improve the visibility of text on lighter backgrounds.
2.19 - 12 September 2022
Section titled “2.19 - 12 September 2022”Continuous Axis option to view gaps in temporal data points
Section titled “Continuous Axis option to view gaps in temporal data points”The new checkbox option for ‘Continuous Axis’ in the Properties Panel offers the option to view gaps in time between data points in your temporal data. Temporal data includes dates or time formats.
Heatmap - rectangle preset
Section titled “Heatmap - rectangle preset”In the toolbar, in the Data Objects section, a new rectangular version of the Heatmap is offered as a preset in addition to the circular preset.
2.18 - 30 August 2022
Section titled “2.18 - 30 August 2022”Enable highlight-brushing on a table (excludes pivot)
Section titled “Enable highlight-brushing on a table (excludes pivot)”Hovering or clicking on a value (in a table or filter) highlights the same value(s) on all the charts of your workbook.
Enable highlights on visualizations by hovering on a chart legend
Section titled “Enable highlights on visualizations by hovering on a chart legend”Hovering or clicking on a value in a chart with a categorical legend highlights the same value(s) on the other visualizations in your workbook.
2.17 - 17 August 2022
Section titled “2.17 - 17 August 2022”Date groups have more format options
Section titled “Date groups have more format options”There’s no need to use extra columns or calculations with the further enhancements in date groups. For example, a heatmap can be created simply using two fields, one date field and one measure.
Updates to your table with drop-down filters
Section titled “Updates to your table with drop-down filters”You can set filters in your table without adding other data objects to your workbook.
Within your table, click on a row, or use the filter dropdown to view and add or remove filter options from your table.
Progress bar style enhancements
Section titled “Progress bar style enhancements”Major style enhancements to the existing progress bar visualization.
These can be used with progress/gauge charts. Changes include adjusting the bar radius and padding.
2.16 - 01 August 2022
Section titled “2.16 - 01 August 2022”New rules define limits for aspect ratio when manually changed
Section titled “New rules define limits for aspect ratio when manually changed”Limit custom aspect ratio - new rules define limits for aspect ratio when manually changed so that:
-
the width will never be greater than 4 times as wide as the height, and the
-
height will never be greater than 4 times as high as the width.
Formatting improvements to tables, bar, and combo charts
Section titled “Formatting improvements to tables, bar, and combo charts”-
All table progress bars are aligned
-
Select rounded ends for the bar charts and with stacked bar charts
-
Add rounded borders and padding options to the combo chart
2.15 - 20 July 2022
Section titled “2.15 - 20 July 2022”Title Editing
Section titled “Title Editing”New Title options make it easier to add context to objects, with a new discrete menu for managing title content.
Scatter plot trend lines through points
Section titled “Scatter plot trend lines through points”Improvements to the scatter chart styles and the addition of a trend line through points on the scatter chart.
Direct data labels
Section titled “Direct data labels”For sparklines or charts where the axis is smaller, you can now show labels at the end of a line chart.
2.14 - 20 July 2022
Section titled “2.14 - 20 July 2022”Filter bar enhanced with editable fields to simplify and speed up analysis
Section titled “Filter bar enhanced with editable fields to simplify and speed up analysis”The filter bar visible at the top of the worksheet is now enhanced with editable fields to simplify and speed up data analysis for you and the teams you share your data with. The drop-down lists have a check mark beside the filters applied to the data object.
Select the filters you want, and a checkmark displays which filters are active on the data object.
Layers - choose between sheet layers and object layers
Section titled “Layers - choose between sheet layers and object layers”Workbook editor ‘Sheets’ are now named ‘Layers’. This change also improves the efficiency of selecting and managing your workbook sheet layers when clicking on ‘Layers’ immediately displays the object layers for the current sheet.
Date group presets
Section titled “Date group presets”New date selections offer date presets to simplify date selection for all objects. Presets include: presets quarter, day of the week, and certain holidays.
Pivot table - dimension limits to improve performance
Section titled “Pivot table - dimension limits to improve performance”To improve performance, there is now a limit of 7 dimensions in a pivot table with any combination of Row and Column headers.
Improved performance of data connections to Snowflake
Section titled “Improved performance of data connections to Snowflake”We’ve implemented a new approach when creating a new data connection to display a list of databases the user can access. Astrato now only performs the more extended check for writeback permissions only if the user selects to enable writeback on the data connection.
2.13 - 21 June 2022
Section titled “2.13 - 21 June 2022”Filters: easy to check the number of filters you’ve applied
Section titled “Filters: easy to check the number of filters you’ve applied”Beside each Measure Filter, a number displays beside the title to indicate the count of all the measures that have filters applied.
Bug fixes
Section titled “Bug fixes”We do our best to avoid them, but now and again, we have a few to squish …
2.12 - 07 June 2022
Section titled “2.12 - 07 June 2022”Astrato supports Snowflake integrations using Okta for role-level security
Section titled “Astrato supports Snowflake integrations using Okta for role-level security”Organizations using an Okta integration for Single Sign-On (SSO) with Snowflake can enable Enterprise Authentication within Astrato.
Admins don’t need to worry about creating service accounts or new accounts to build data connections to Snowflake.
The credentials are passed through authentication into Snowflake based on a role-level security setup. This means that users logged into the same Workbook see only the data appropriate for their role.
Custom color palette for charts helps you align with your brand, event, or theme
Section titled “Custom color palette for charts helps you align with your brand, event, or theme”Create a custom color palette to style and color your charts to align with your brand, event, or theme.
Type a comma-separated list of the HEX codes for a maximum of 13 colors, and simply drag and drop your list of colors into the custom palette. Use the form to add two extra numbers in your HEX code to affect the opacity of each color.
To reorder the color in your custom palette, click on the double row of dots on the left, to drag and drop the color to its new position.
Filters - tab added to the Object properties panel
Section titled “Filters - tab added to the Object properties panel”The object properties panel now has a Filter tab; this consolidates the options for Chart and Measures filters so that you can amend filters faster.
Measure Filter - selection improvements, use the (+) plus sign beside a filter object to add more measure filters
Section titled “Measure Filter - selection improvements, use the (+) plus sign beside a filter object to add more measure filters”Each Measure filter has a plus sign (+) beside it; click the + to add more filters to an object. Select the field, operator, and value. Once completed, click the Apply button to confirm. Repeat the process with additional measure filters.
Improved default styles to improve differentiation
Section titled “Improved default styles to improve differentiation”New and improved default styles make table content look better and easier to differentiate from the rest of the data by making:
-
Column headings are bold, and the font size is larger
-
New light gray divider below column headings
-
Column widths are evenly spaced, making better use of the white space so data is easier to read and use.
Pivot Table labels - show or hide
Section titled “Pivot Table labels - show or hide”Each measure in the properties panel can display or hide the measure label. If there is only one measure, the label is hidden by default. Read more about using Tables.
2.11 - 23 May 2022
Section titled “2.11 - 23 May 2022”Astrato Embeds: Filtering embedded source data
Section titled “Astrato Embeds: Filtering embedded source data”You can apply a filter (as a parameter) to the view of the source data on an embedded sheet, thereby restricting the scope of the visible data.
Use this feature to produce contextual embeds, this highlights the data that’s most relevant to where you’ve embedded the data. Read more about Astrato Embeds.
Enhanced style formatting for text objects
Section titled “Enhanced style formatting for text objects”You now have options to format the style of text objects with:
-
line and letter spacing
-
background formatting options - including images, background blur, and opacity
-
border options - color and radius
Dimensions: Group dates and timestamps
Section titled “Dimensions: Group dates and timestamps”In the Data tab, within the Dimension options, use the Group as an option, with a selected format to display a combination of dimensions (for example, select ‘Month Year’ with just one click).
Data Engine: Warning displays when a user creates a duplicate data connection
Section titled “Data Engine: Warning displays when a user creates a duplicate data connection”Supporting central management of your data by encouraging users to create ‘semantic layers’ instead of creating duplicate copies of source data - a warning displays when a user attempts to create a duplicate data connection if they use the same:
-
snowflake instance
-
database
-
credentials
The message offers the option to either ‘Create a semantic layer using the existing data connections’ or ’to add the new data source’.
Workbook Lobby: Improved search options
Section titled “Workbook Lobby: Improved search options”Within the lobby, users can now search for a specific :
-
workbook name,
-
filter by a data connection
-
sort their list of workbooks by: name, creation date, updated date, Last opened date
Workbook Demos and semantic layers: refresh to always have the most up-to-date versions
Section titled “Workbook Demos and semantic layers: refresh to always have the most up-to-date versions”Admins can now refresh the demo assets available to users, ensuring that users have the most up-to-date versions of workbooks or semantic layers.
Workbook Editor: More control of your Workbook Sheets
Section titled “Workbook Editor: More control of your Workbook Sheets”Now you can design your Workbooks with a:
-
specific sheet size to keep it consistent for all users
-
responsive sheet size for more flexibility, to adjust the worksheet size based on the screen size
-
Locked aspect at sheet level, not just at Workbook level.
2.10 - 10 May 2022
Section titled “2.10 - 10 May 2022”Trendline error message if there is a null or negative value in the data
Section titled “Trendline error message if there is a null or negative value in the data”A new warning message displays if a user attempts to create an exponential trendline if their data contains zero or negative values.
Using Line Charts for Linear or Exponential Forecasting
Features linked to using a Line Chart for linear or exponential forecasting include:
-
A vertical reference line displays to highlight where the forecast data starts
-
Each forecast has a label
-
It projects the linear or exponential trendline using defined reference/training data points
It also has the following constraints:
-
Forecasting is only possible on dates (includes years as an integer format)
-
A forecast must be linked to per measure. It is also possible to forecast on multi-line charts that are split by dimension, providing only one measure exists.
Please see the new page in our Data section to learn more: Advanced Analytics - Forecasting.
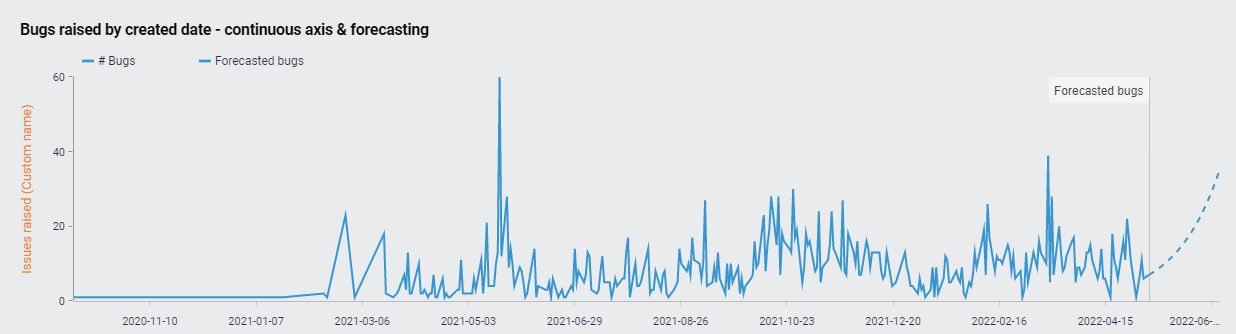
Pivot Table displays multiple data dimensions, with added visual style options
Section titled “Pivot Table displays multiple data dimensions, with added visual style options”Astrato’s new pivot table elevates our existing table features, with more grouped dimension values that aggregate across the top and the left-hand side.
The pivot table enables users to display a dimension across the top, to create a grid-like table visualization. You can now view cross-sections of data with first and second-layer data filters.
The example shows Column data linked to Area - with Neighbourhood as the first filter, with Availability and Price per night as the second layer. Row data includes both bedrooms and bed types.
In addition, visual styles and color to display conditional formatting let you tell more than one story - without any coding or change to source data. In the example below a progress bar (based on a fixed amount) makes comparing availability easier. And the color-linked conditional formatting highlights price ranges.
Read more about Tables.
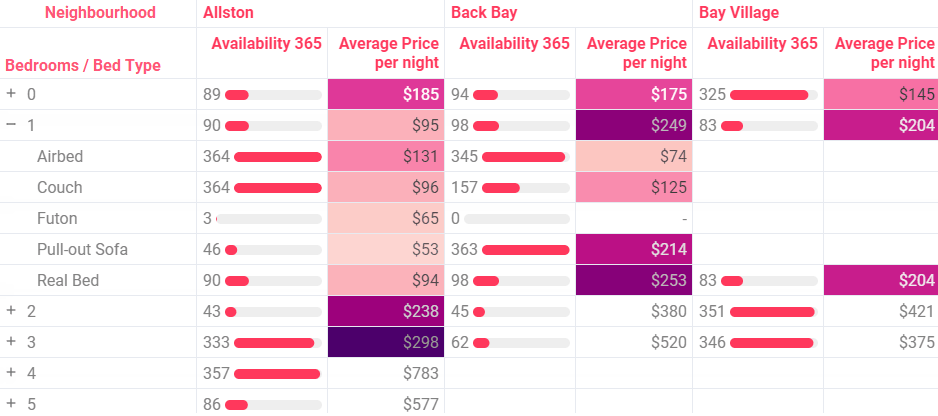
2.9.0 - 25 April 2022
Section titled “2.9.0 - 25 April 2022”Astrato Embeds - Creators can generate restricted links
Section titled “Astrato Embeds - Creators can generate restricted links”All Creators can generate Embed links within their data and share the link with other Astrato users in their company (that is, if they’re in the same domain).
This function for Creators does not need to be enabled by Astrato Administrators.
Display more data points on Line and Scatter charts
Section titled “Display more data points on Line and Scatter charts”Increased the number of data chart points displayed;
-
Line Charts 200 to 800 points
-
Scatter Chart 200 to 600 points
Users can select which data points are visible within the number displayed.
2.8.0 - 11 April 2022
Section titled “2.8.0 - 11 April 2022”Trend lines
Section titled “Trend lines”Enable a trend line on your bar, line, or scatter chart to indicate the general course or tendency of points based on your calculations.
-
Regression trend types include: linear, exponential, polynomial, logarithmic, power series, and moving averages.
-
Formatting style options include: color, line style, opacity, and thickness.
Data Filters with extra ‘filters’ built-in
Section titled “Data Filters with extra ‘filters’ built-in”Updates to the data filters include:
-
Predictive search options highlight the top-most value returned
-
Visualization using a bar graph indicates the prevalence of the data values being filtered
Unsupported Browsers - warning for users logging in
Section titled “Unsupported Browsers - warning for users logging in”A warning message displays for users logging in using an unsupported browser.
The list of supported browsers (Google Chrome (Desktop), Microsoft Edge (Desktop), Mozilla Firefox (Desktop)) is offered so all users understand our testing and support parameters.
2.7.0 - 30 March 2022
Section titled “2.7.0 - 30 March 2022”Using Snowflake’s Time Travel feature with Astrato
Section titled “Using Snowflake’s Time Travel feature with Astrato”Time Travel enables accessing historical data at any point within a defined period. Includes data that has been edited or deleted.
Astrato Community link added
Section titled “Astrato Community link added”The Astrato Galaxy (our Community of Astrato users) is now available as a quick link once you log in to Astrato.
Google signup consent
Section titled “Google signup consent”We’ve updated the login screens to remove the data consent request from Google.
Only Google account users must provide data consent when using Google Drive or Google Sheets as a data source from within the semantic layer.
Astrato Embeds *please see the update in Release 2.9
Section titled “Astrato Embeds *please see the update in Release 2.9”The Embed feature in Astrato (your Administrator must enable this feature to share Embedded links outside your company domain) lets you take content from a published workbook and embed it in other web-based material.
The content retains its interactivity and connection to the live source data meaning you have a single source of truth for your analytics wherever they’re used.
Share key live content from the business applications your team uses daily - CRM, HubSpot, Confluence, or publicly on your website or in a SaaS product.
2.6.0 - 19 March 2022
Section titled “2.6.0 - 19 March 2022”Smoother transitions as data changes
Section titled “Smoother transitions as data changes”Changes to animations and data points on all charts look smoother as data changes are made and refreshed.
Data: PostgreSQL connections as a data source
Section titled “Data: PostgreSQL connections as a data source”In addition to Snowflake and Google Sheets, Astrato now supports PostgreSQL data connections, which appear as an option in the semantic layer.
Toolbar: Filters easier to find
Section titled “Toolbar: Filters easier to find”To improve the visibility of the Filters feature, it’s now just below the data objects selection.
2.5.0 - 02 March 2022
Section titled “2.5.0 - 02 March 2022”Custom Data - add custom data in the semantic layer editor using an SQL query or CSV file upload.
Sheet Object Layers - options to manage data objects from the Sheets menu.
2.4.0 - 21 February 2021
Section titled “2.4.0 - 21 February 2021”Workbook Updates - updates in changes to the flow for creating and publishing a workbook (example for creating a workbook shown here).
2.3.0 - 04 February 2022
Section titled “2.3.0 - 04 February 2022”Create Dimensions and Measures directly from the table - Right-click on a field and add it as a dimension or measure.
Connected Workbooks - Select from the list of workbooks already connected to a semantic layer to open them from the semantic layer.
Snowflake Manual Configuration - Now you can choose a manual configuration option to connect a Snowflake instance.
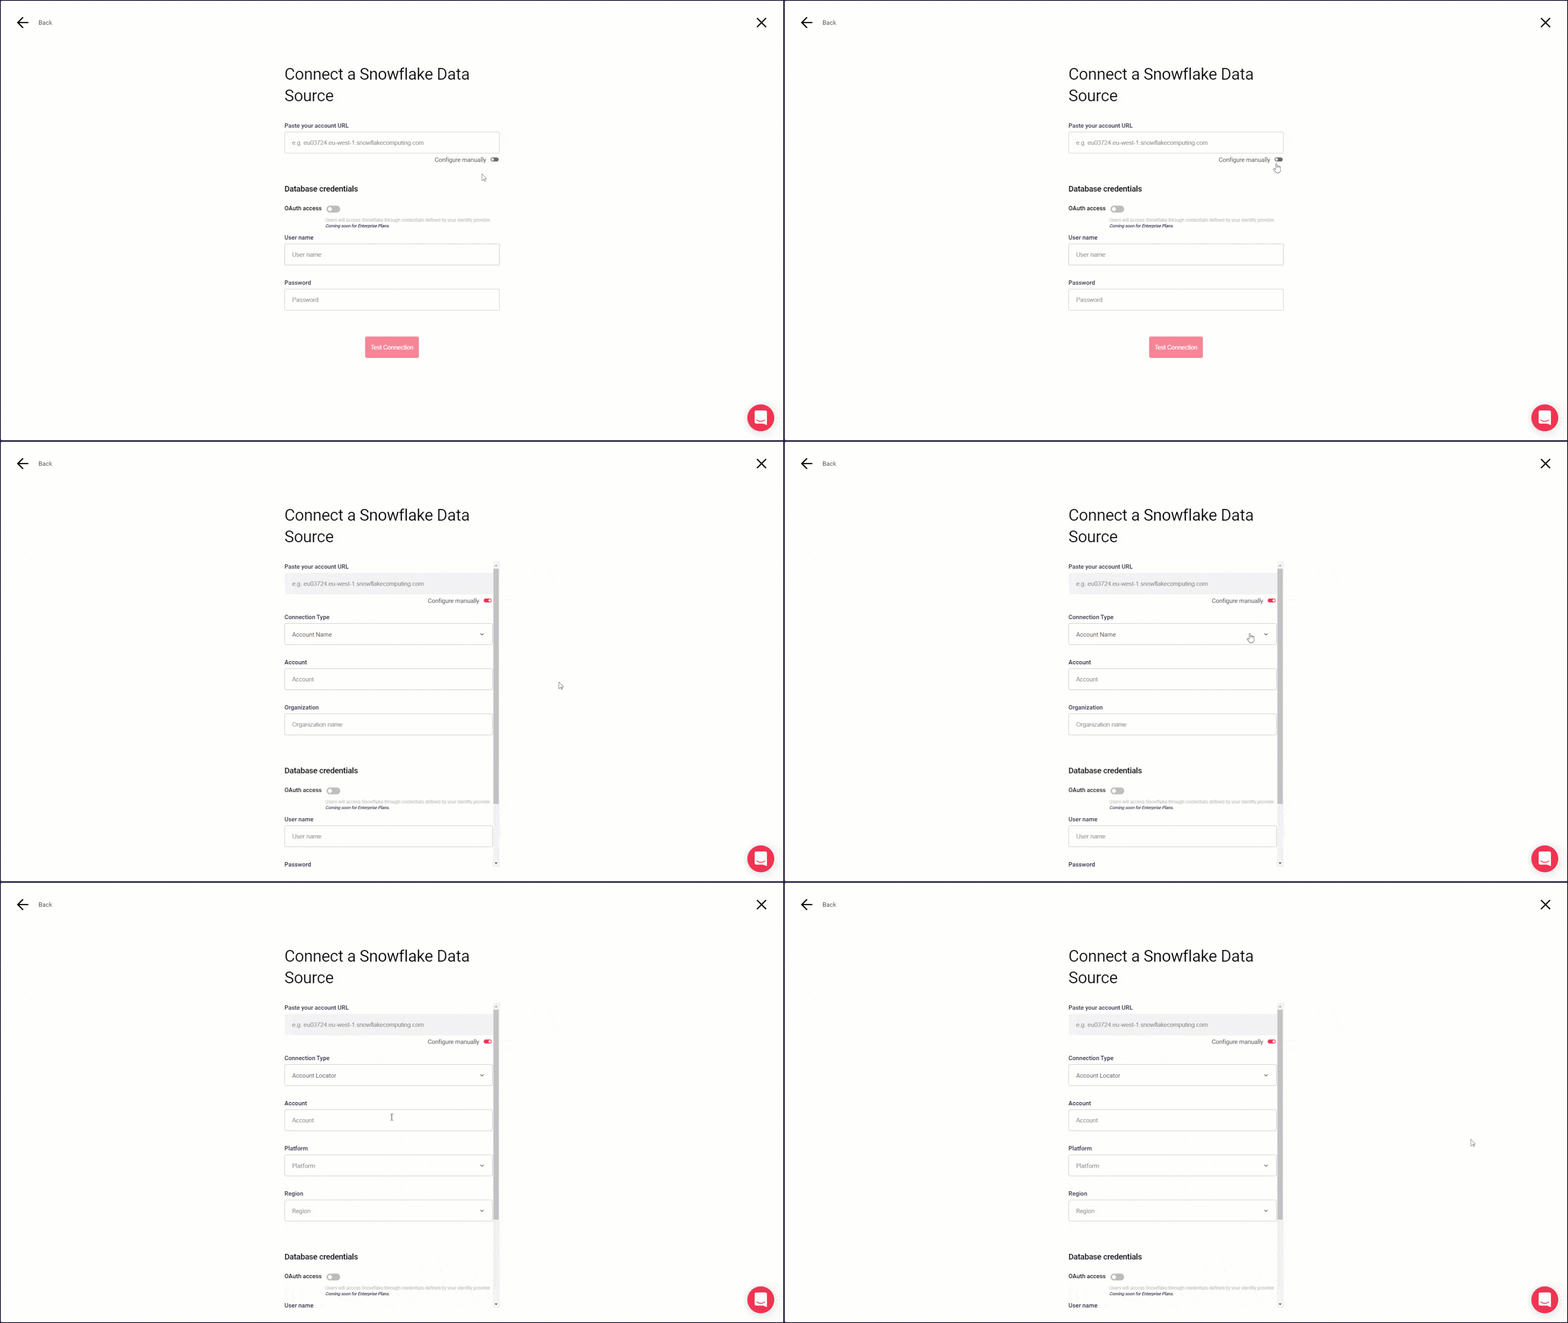
2.2.0 - January 2022
Section titled “2.2.0 - January 2022”Workbook Editor Tooltip - Are you terrible with names? We’ve added tooltip to the controls in the workbook editor to help you out.
2.1.0 - 15 December 2021
Section titled “2.1.0 - 15 December 2021”Workbook Editor - The header in the workbook editor now contains a link to the semantic layer you’re using to create the workbook.
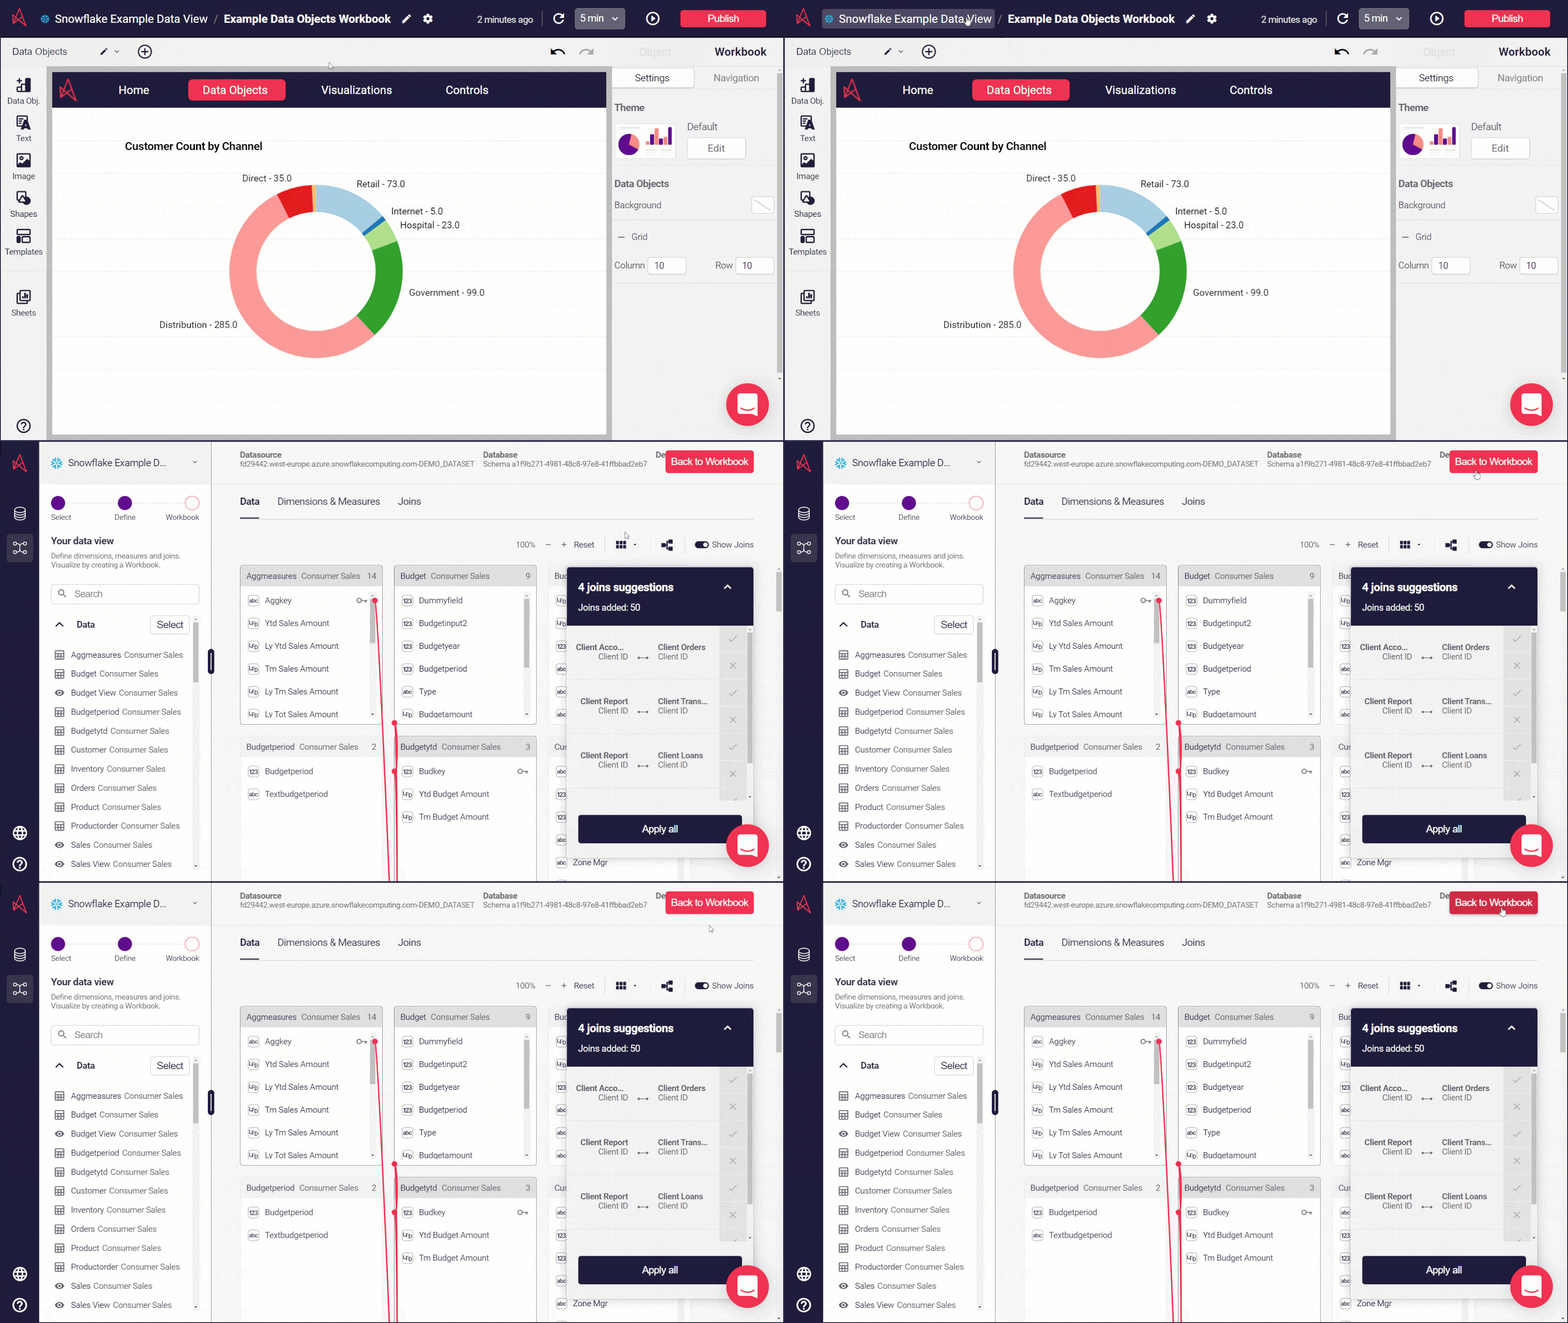
Enterprise Authentication - OKTA - Astrato now supports enterprise authentication for Open ID Connect (OKTA).
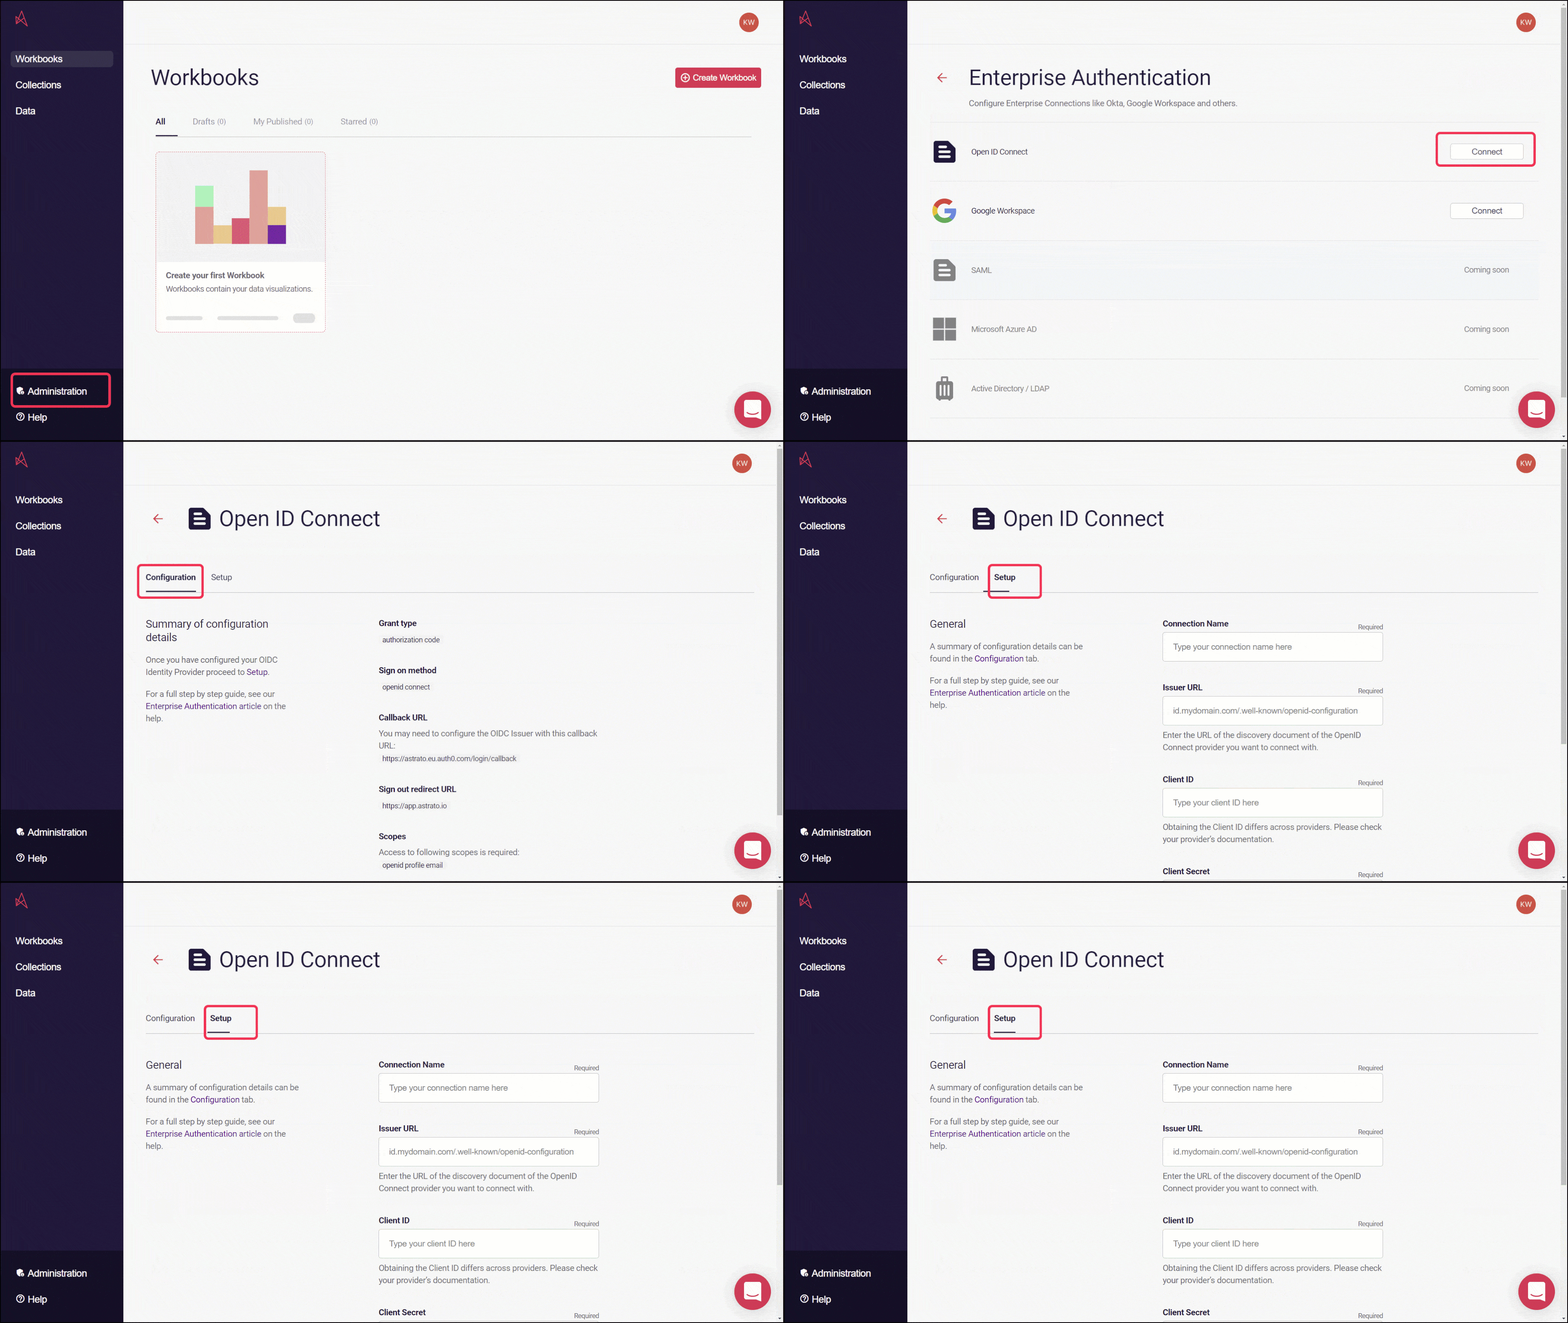
2.0.0 - 02 December 2021
Section titled “2.0.0 - 02 December 2021”Demo Data Assets - Astrato now contains some example published workbooks and a data connection to get you started when you first log in.
Enterprise Authentication - Google Workspace - Astrato now supports enterprise authentication for Google Workspace.
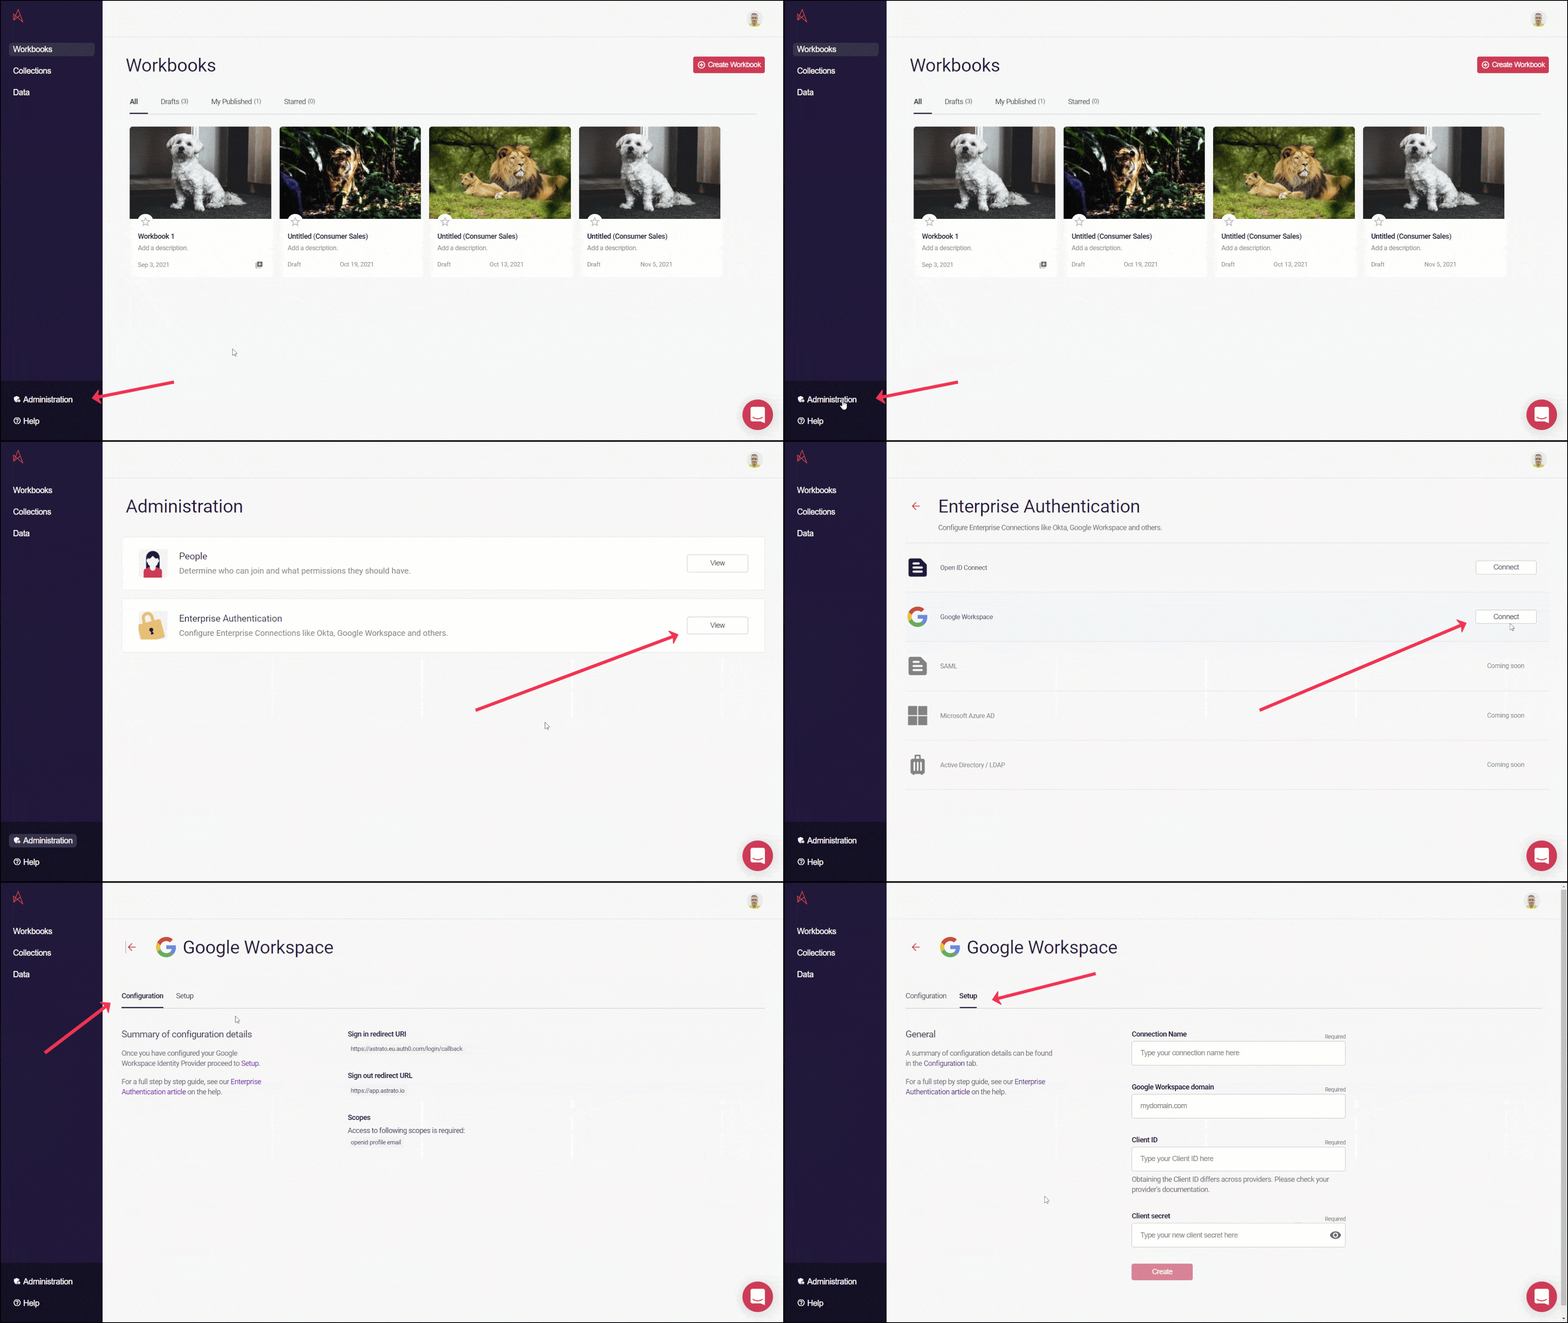
1.12.0 - 23 November 2021
Section titled “1.12.0 - 23 November 2021”Bar Chart Gradient - You can now apply colors to a bar chart with a gradient shading.
Demo Data Read-Only Resources - If you’re a user logging in to your workspace for the first time, you’ll see some published workbooks and a data connection with example semantic layers. We’ve included these examples to help you get started creating your own workbooks.
1.11.0 - 10 November 2021
Section titled “1.11.0 - 10 November 2021”Reverse / Limit - The properties panel now has controls which can reverse the color scheme in your data object, and also apply limitations to the data displayed.
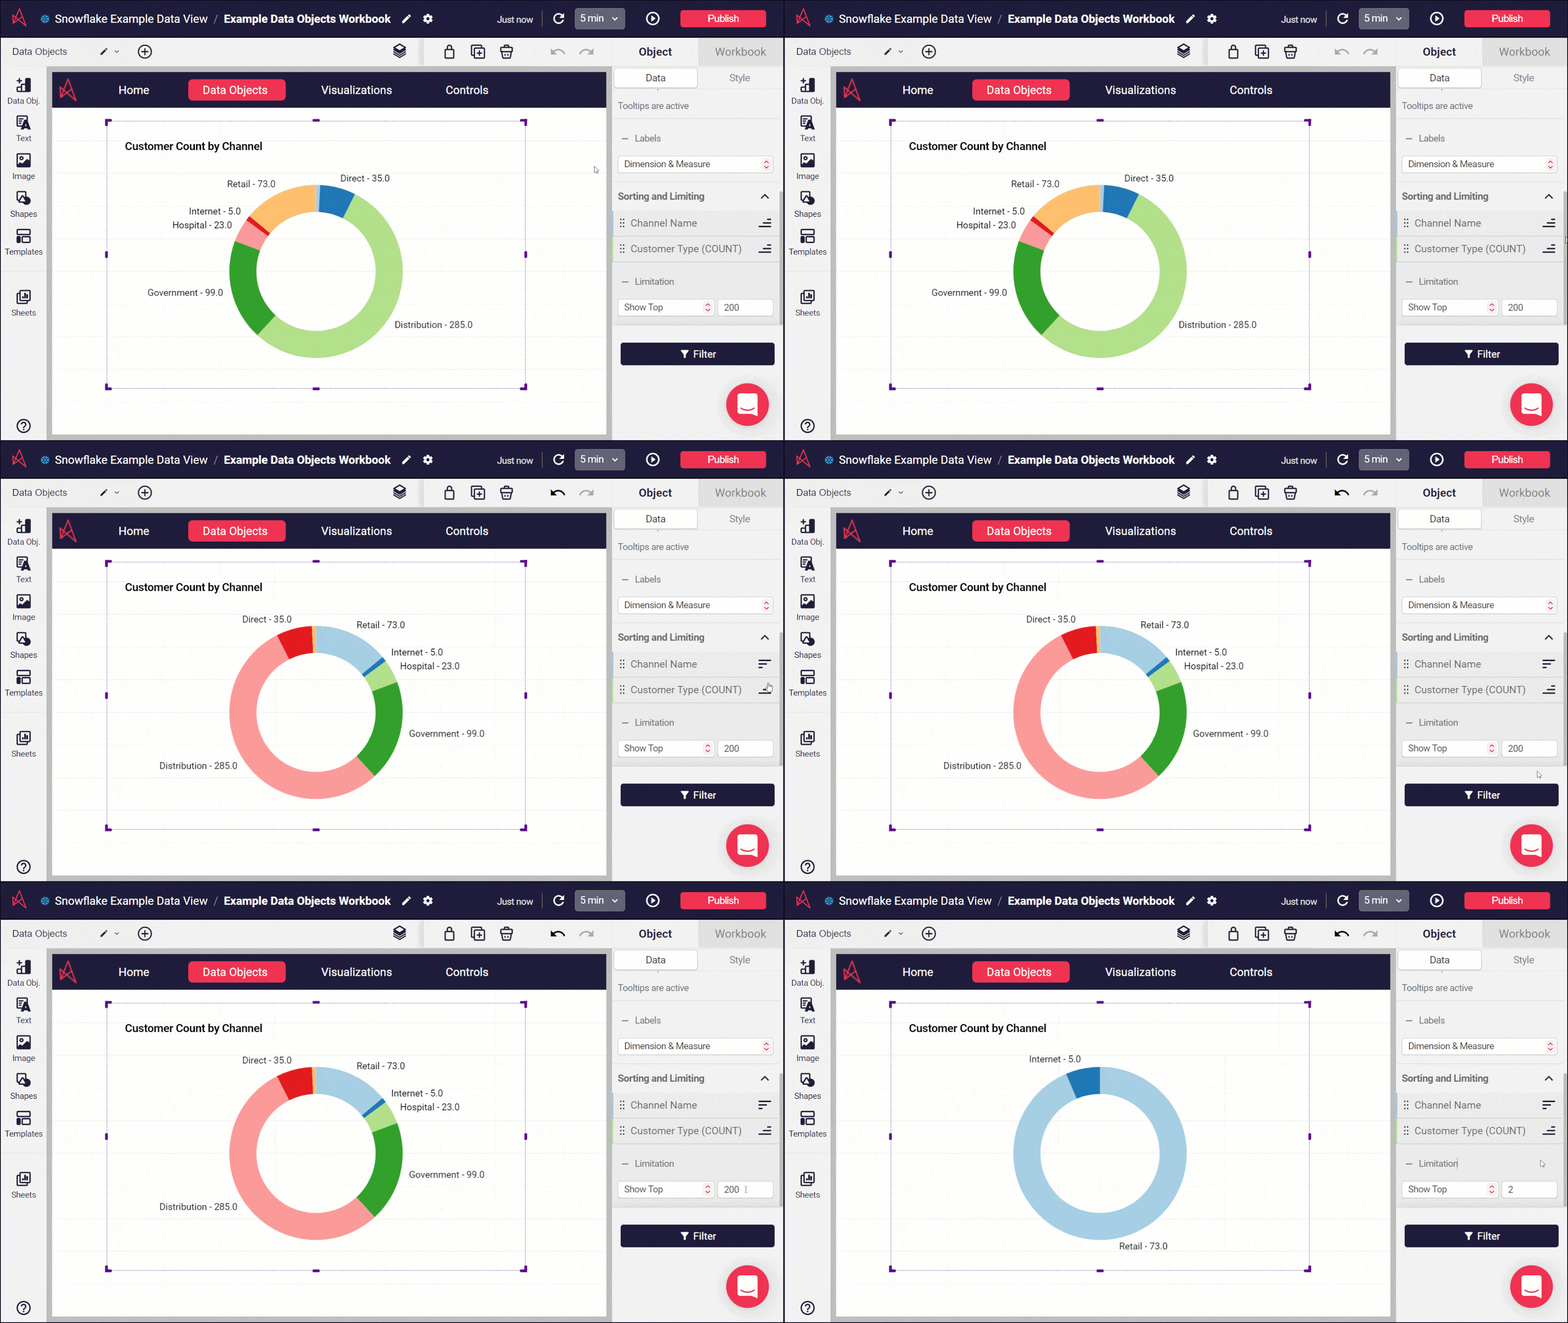
Templates - The templates section has been updated, with the Popular tab being d be renamed Astrato Defaults and My Templates changed to Workbook Templates.
1.10.0 - 29 October 2021
Section titled “1.10.0 - 29 October 2021”Auto-Refresh - workbooks now have an auto-refresh function where you can choose your own refresh rate.
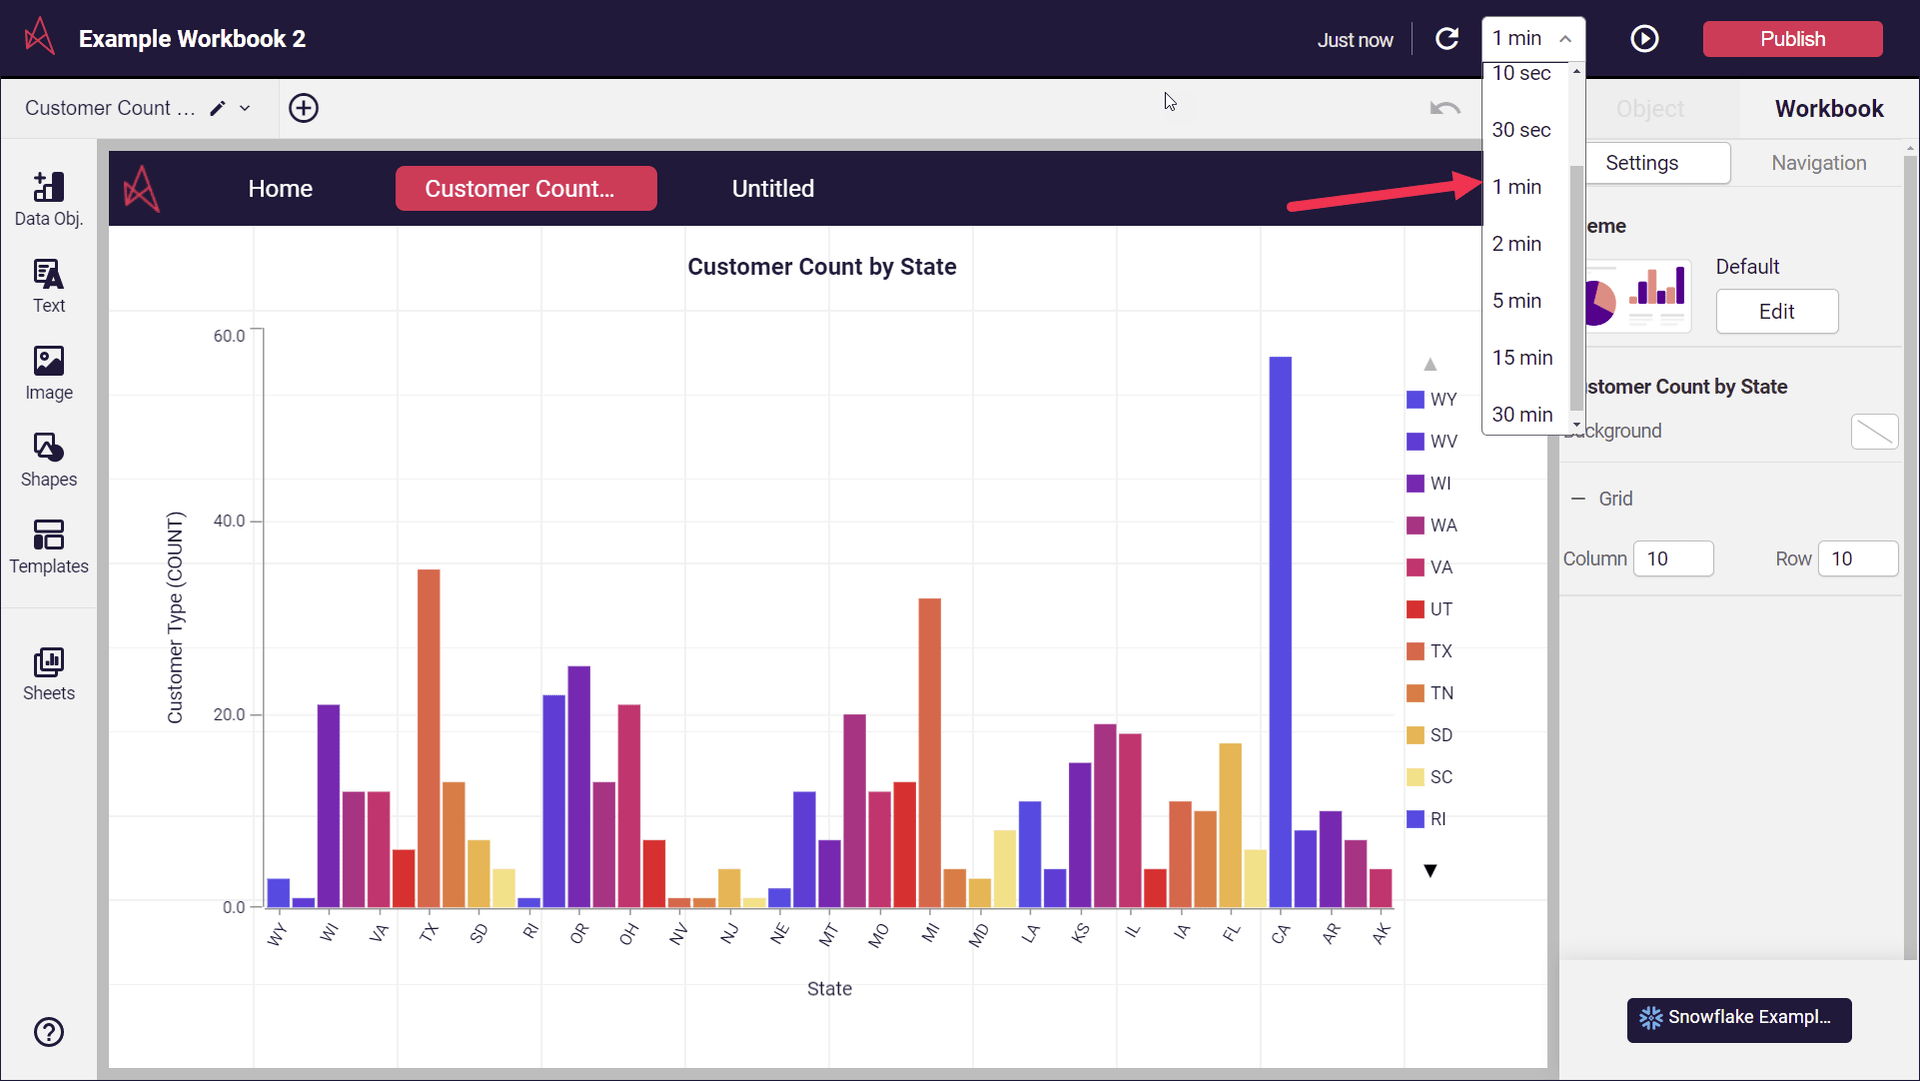
Spaghetti Joins - Adding joins in your semantic layer just got even easier with the joins suggestions feature, which lists all the possible joins you can add, and shows the joins you’ve already created. Link up your data in just a few clicks.
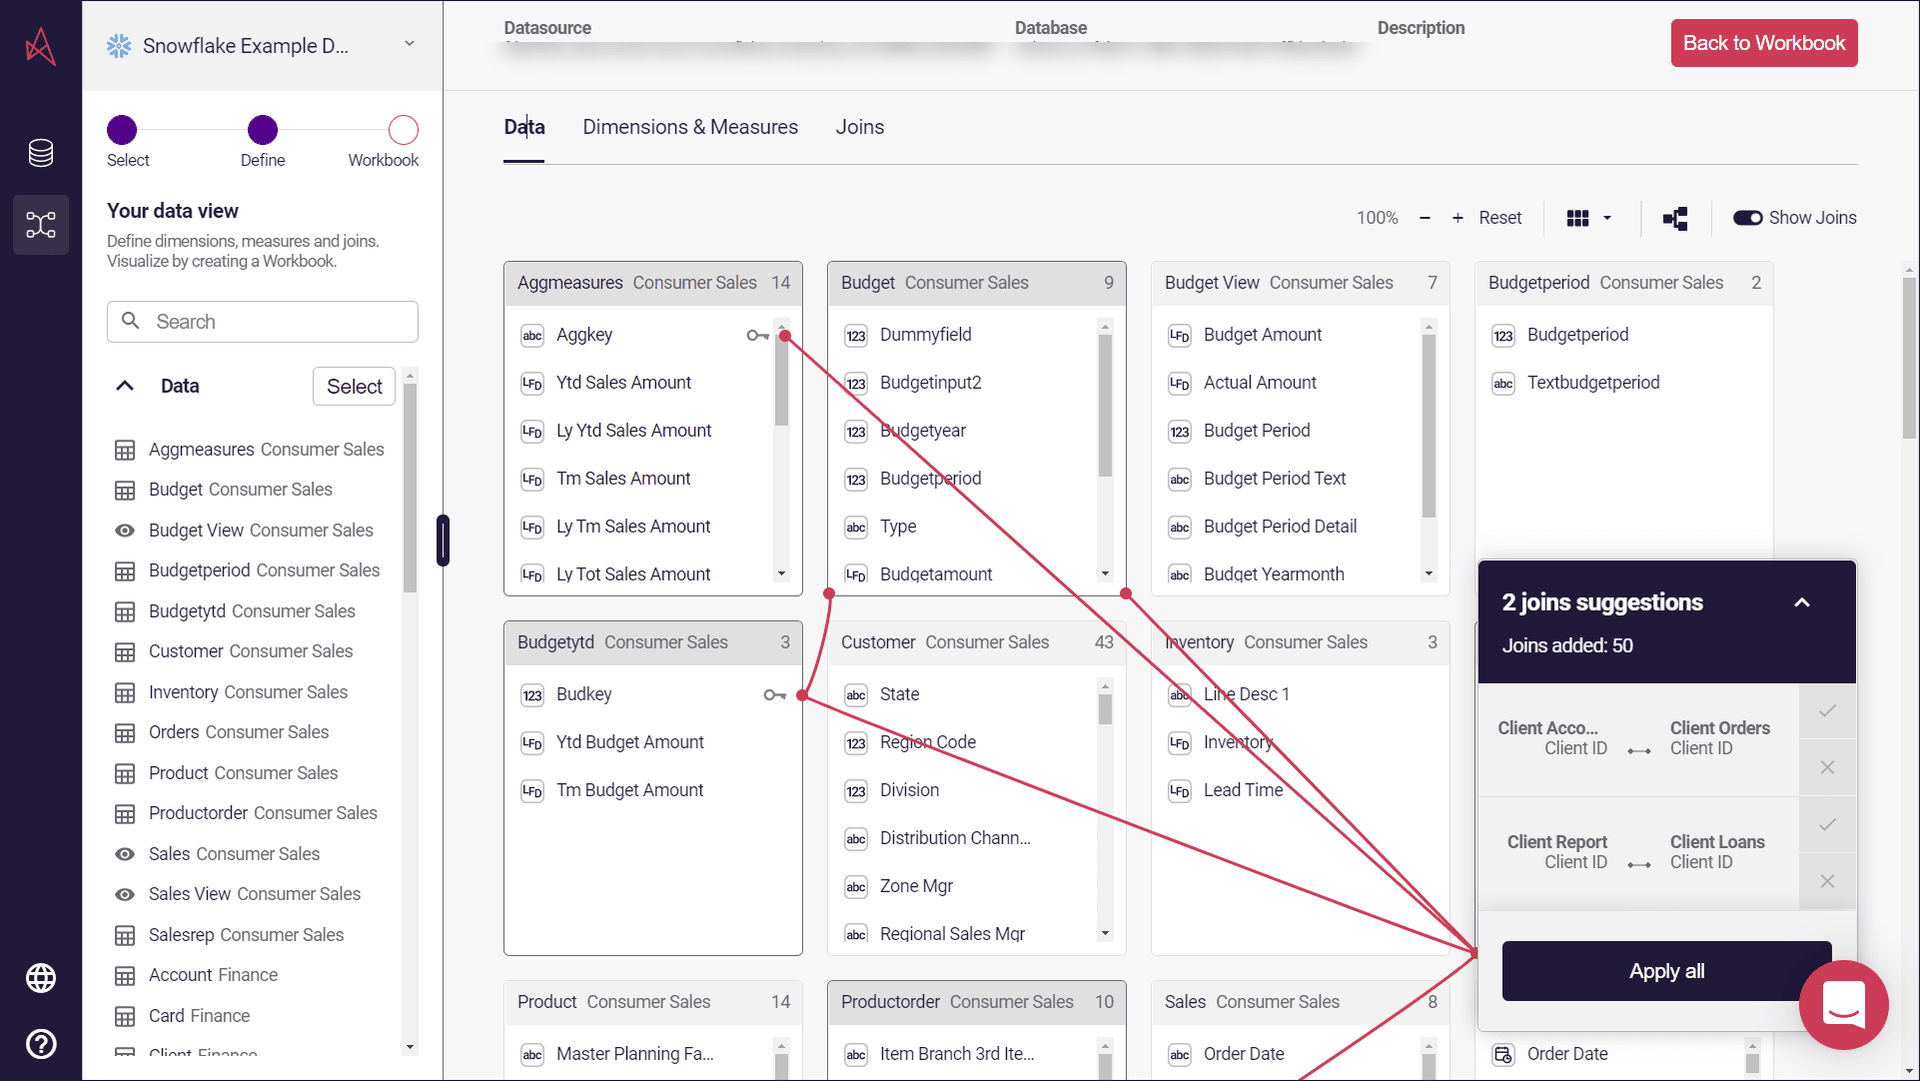
1.9.0 - 13 October 2021
Section titled “1.9.0 - 13 October 2021”Stacks of Tooltip - If you’re using a stacked bar chart or line chart, you’ll be able to display the total in tooltip.
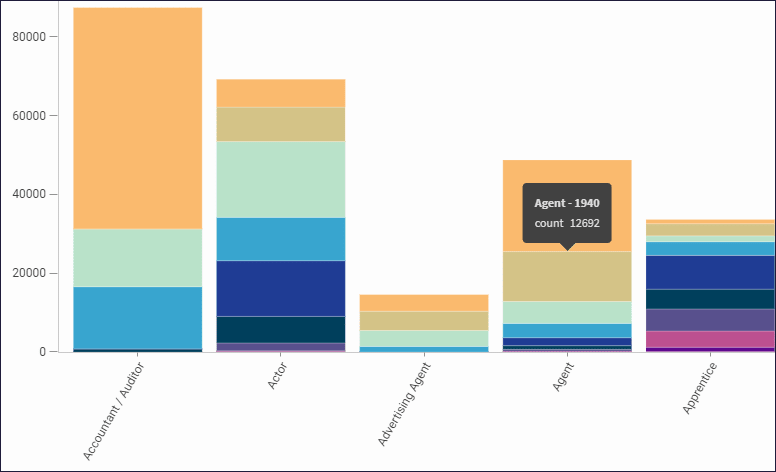
Alphabetical Sorting of Joins - When you add a join, the table and field data is now shown in alphabetical order.
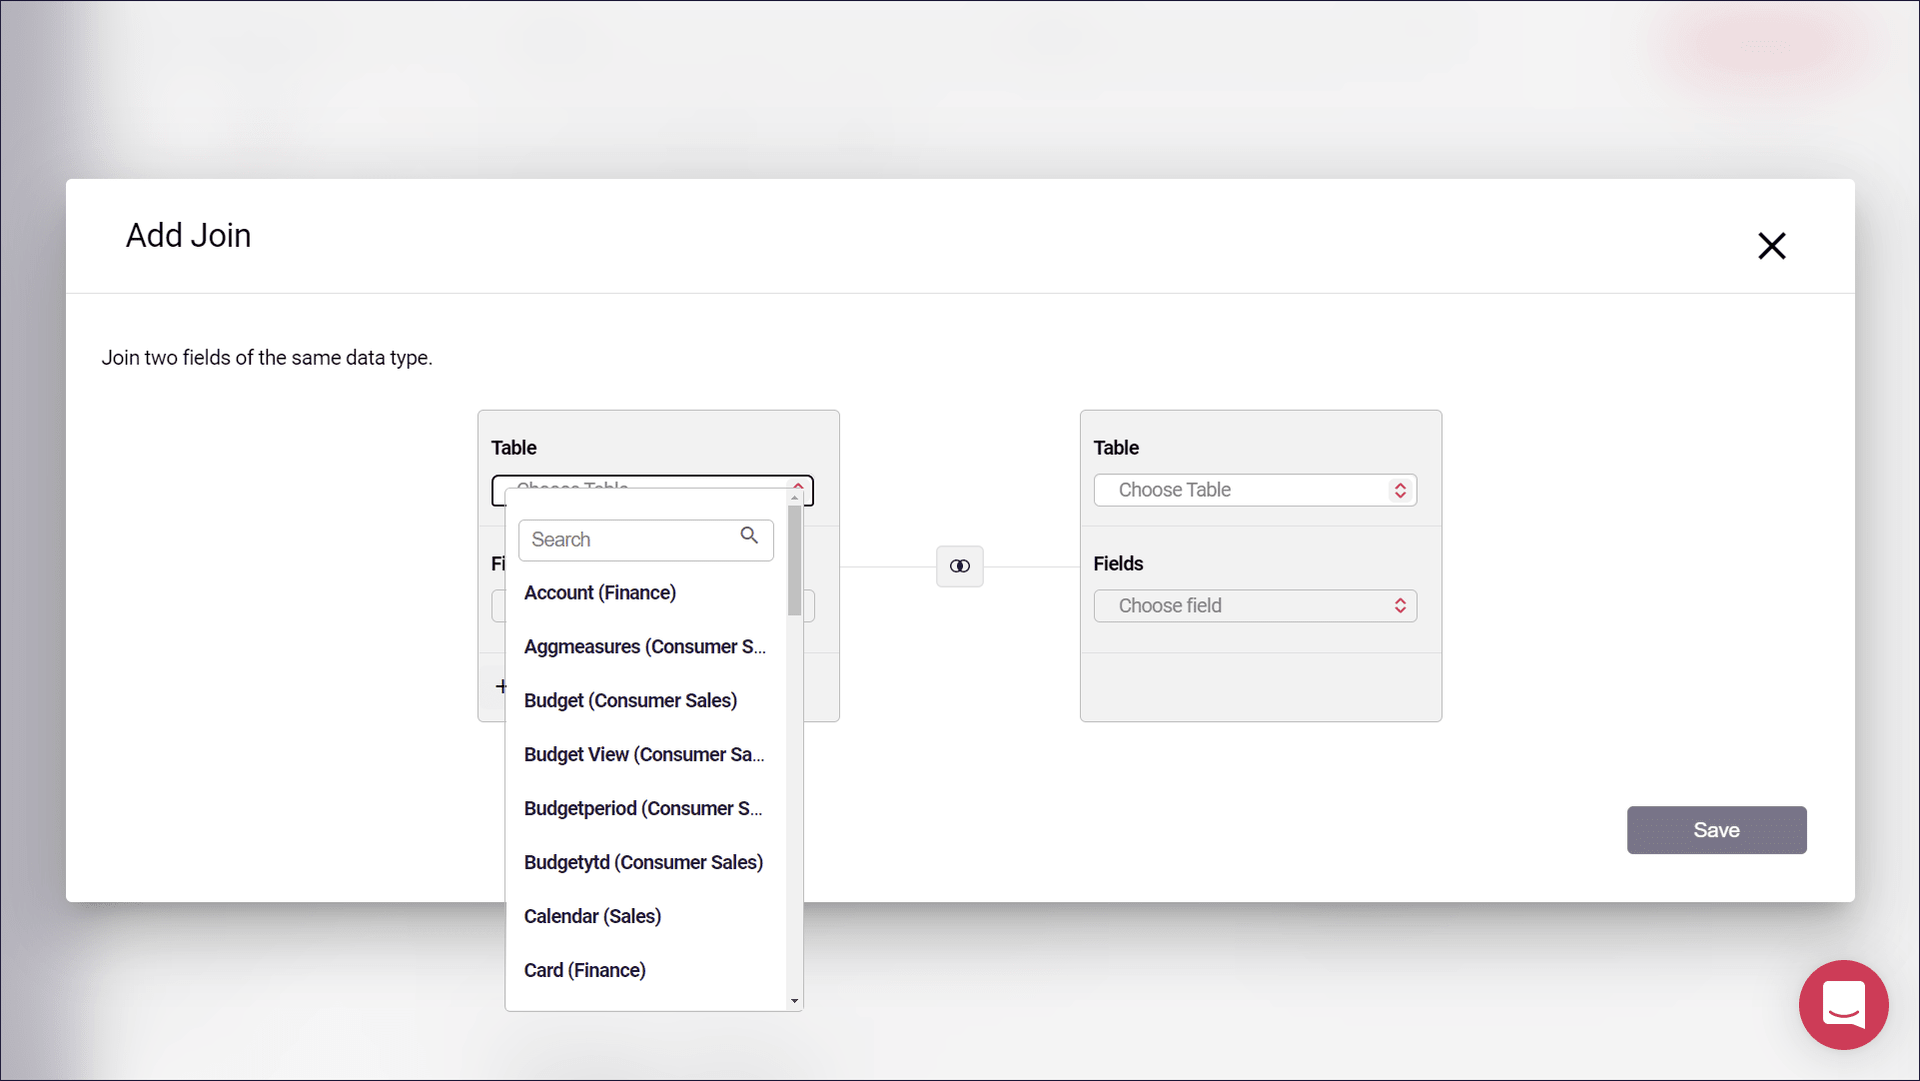
Preview then Review - The Preview function for a workbook now opens in a new tab, making it easy to check the workbook, then publish or return to the draft.
1.8.0 - 05 October 2021
Section titled “1.8.0 - 05 October 2021”Hit the Bars - Add an extra visual touch to your bar charts by enabling the Translucent bars setting.
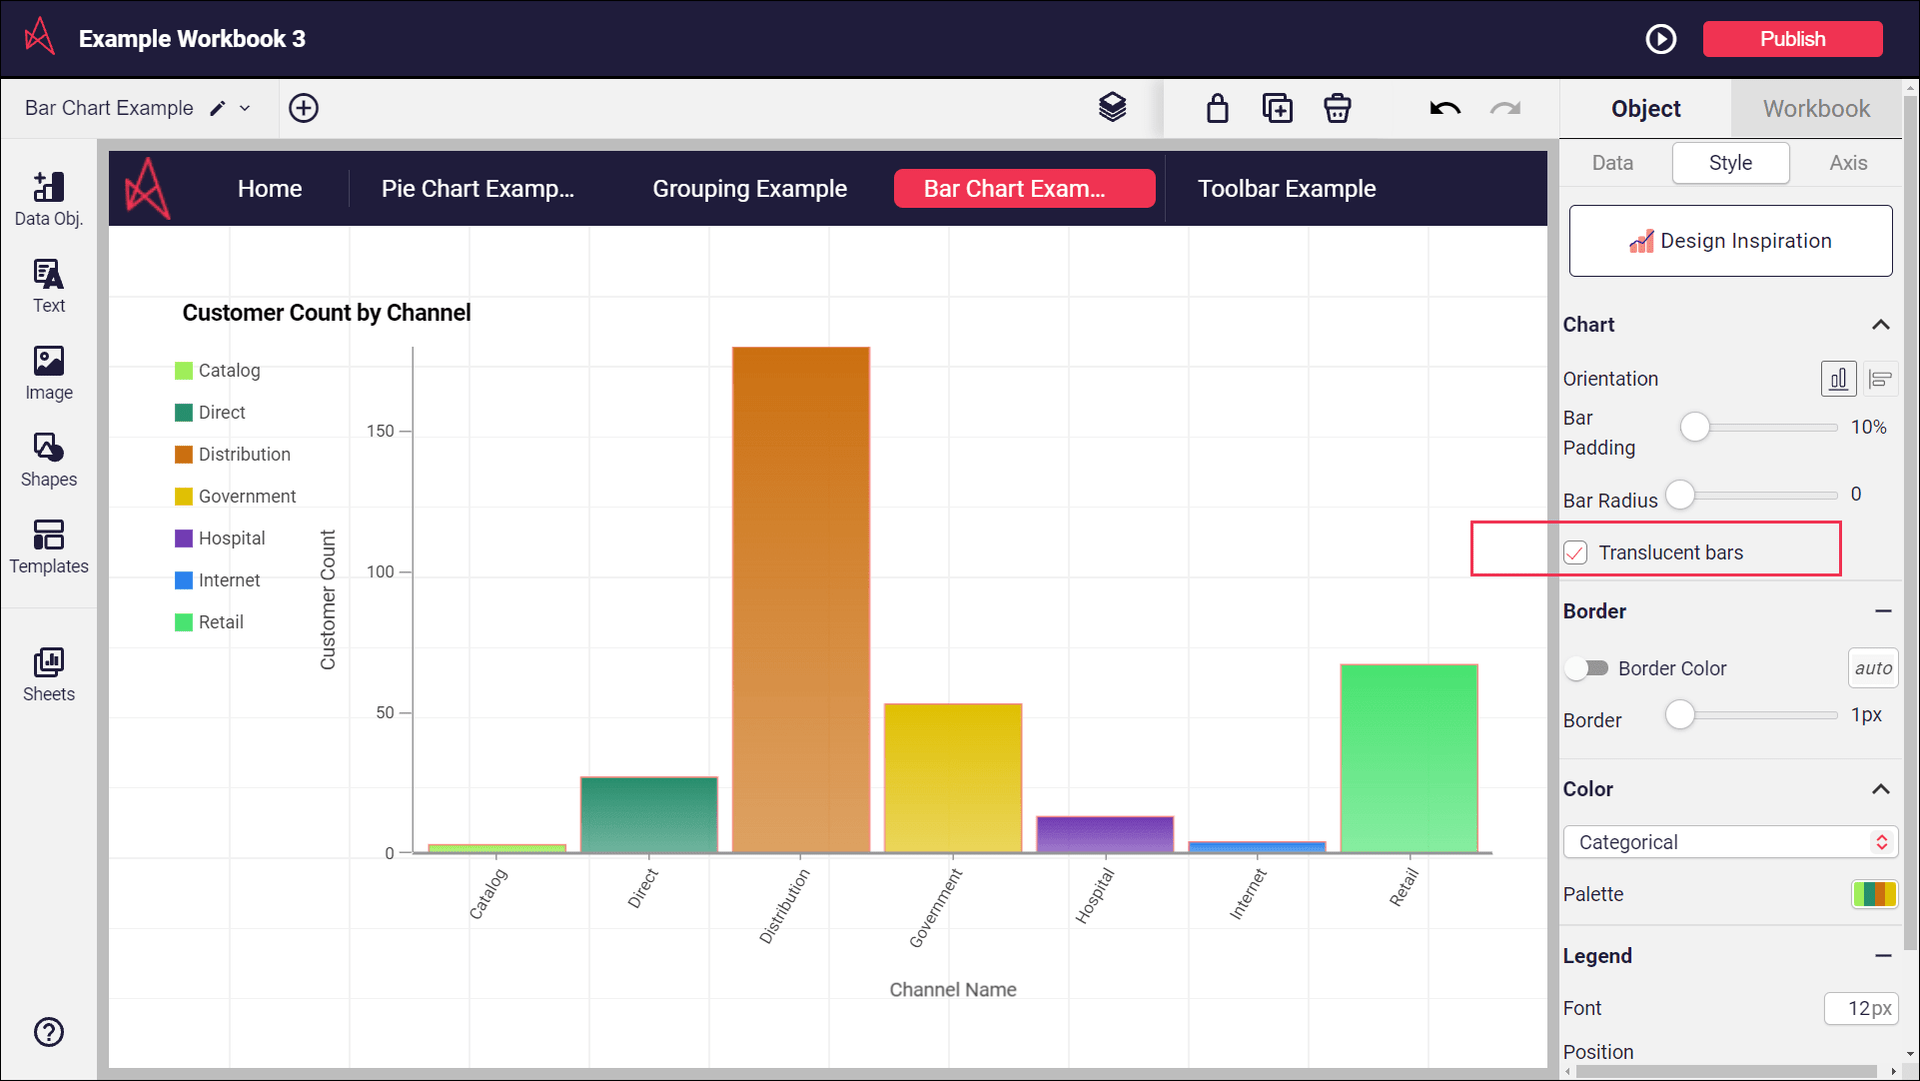
Semantic Layer Chat Show - If you’re working with the semantic layer and need to ask us a question, you can hit the Intercom chat button right then and there. No more going back to the lobby!
Measure for Measure - And you can now display pie chart labels as percentages if you select Measure only.
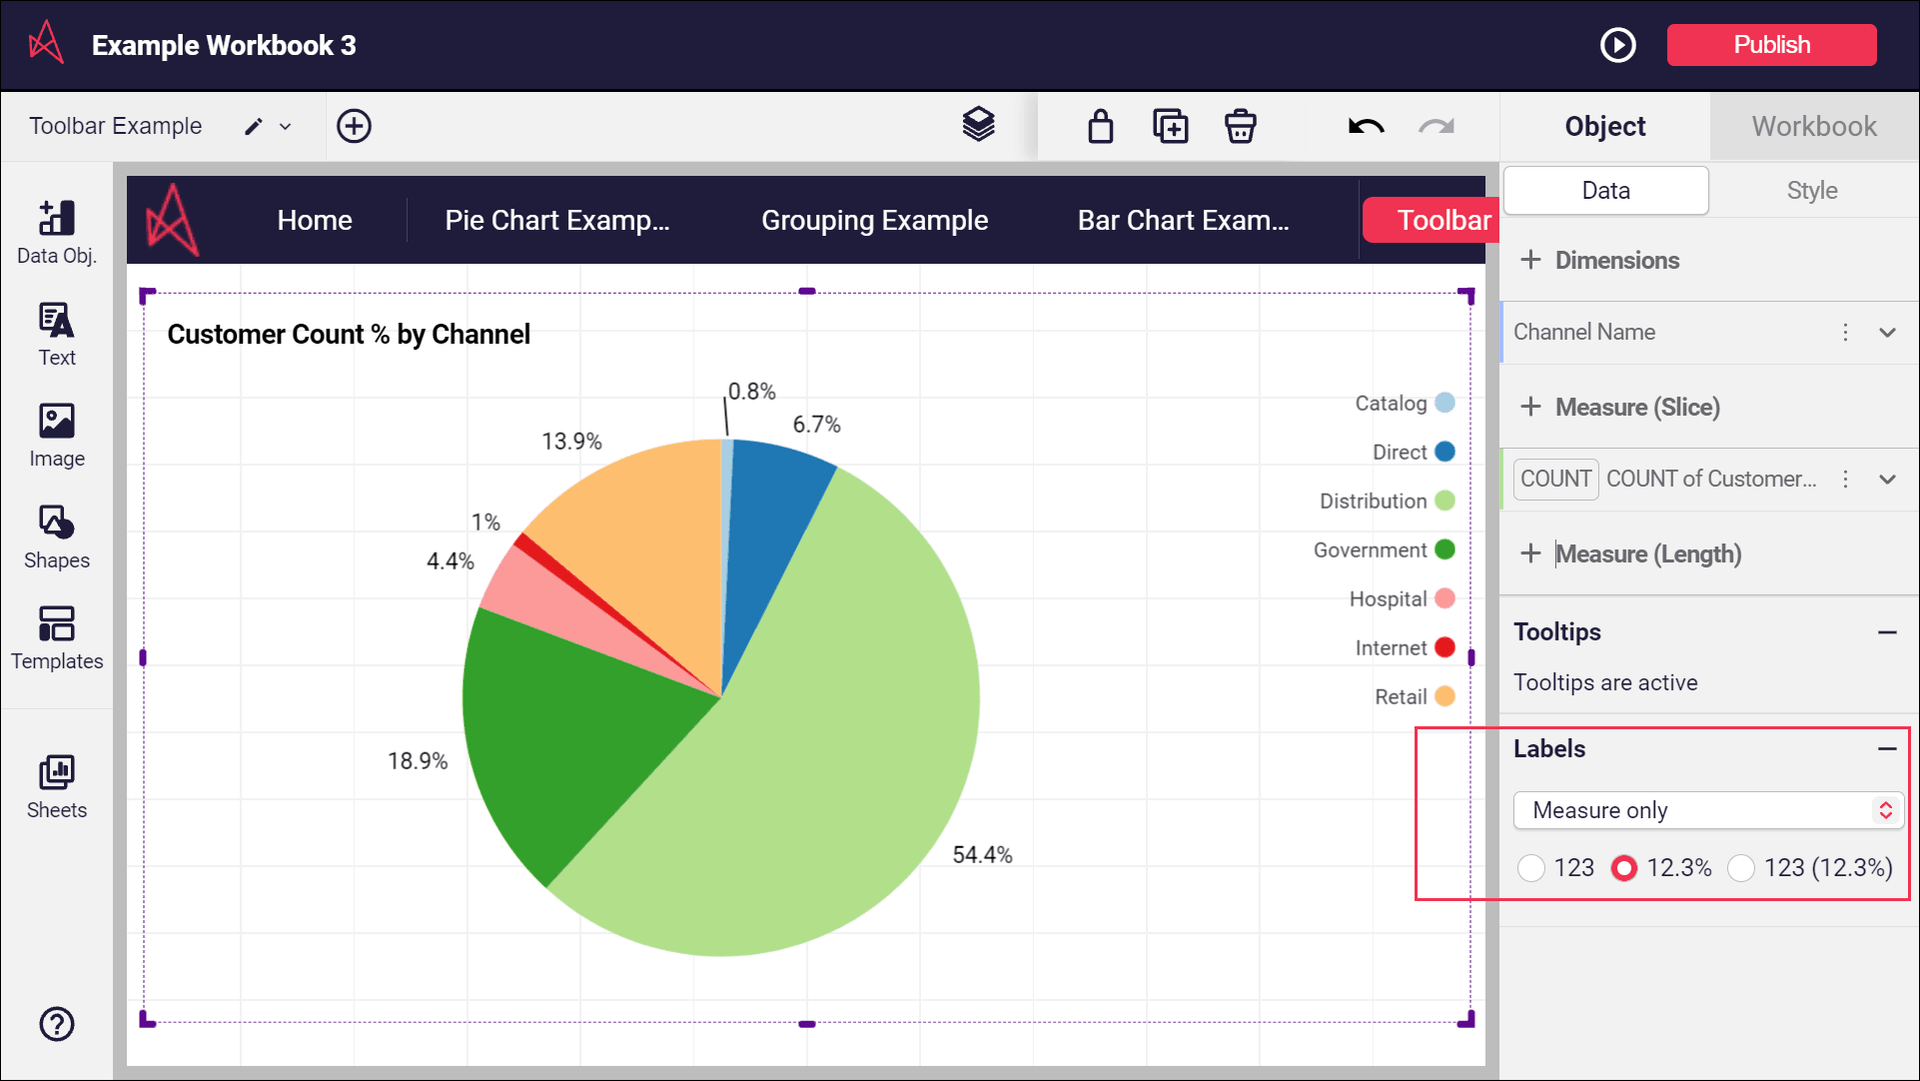
1.7.0 - 15 September 2021
Section titled “1.7.0 - 15 September 2021”No Google? No problem! - As well as using your Google and LinkedIn accounts, you can create your own login and password for your Astrato account.
Keep it Strong - To make sure your details stay secure, we’ve also implemented conditions for password strength.
Semantic Layer Drag Race - In the semantic layer, you can now drag the panel divider to increase the size of the left sidebar, which lists your source data.
1.6.0 - 31 August 2021
Section titled “1.6.0 - 31 August 2021”Coming soon! - In the toolbar, you can now see icons for objects we’re working on introducing in the near future.
Movers and Shakers - The Lock and Group icons have been moved into the action bar, and the Save Template control has been moved to the context menu (open on right-click).
Get Groups Moving - You can also use drag and drop to select and group objects, move them around the sheet, or re-size them.
1.5.0 - 17 August 2021
Section titled “1.5.0 - 17 August 2021”Object Resize - Resize an object in the content pane by dragging the edges in any direction. This works for bar charts, line charts, scatter charts and combo charts. Try it and see!
Custom Axis Height - Set a customized axis height for your charts in the properties panel Object settings. Choose to start at 0, and set maximum and/or minimum values for displaying objects.
Gauge Target Settings - Gauge data objects now have updated target settings, where you can choose between, automatic, manual and data options.
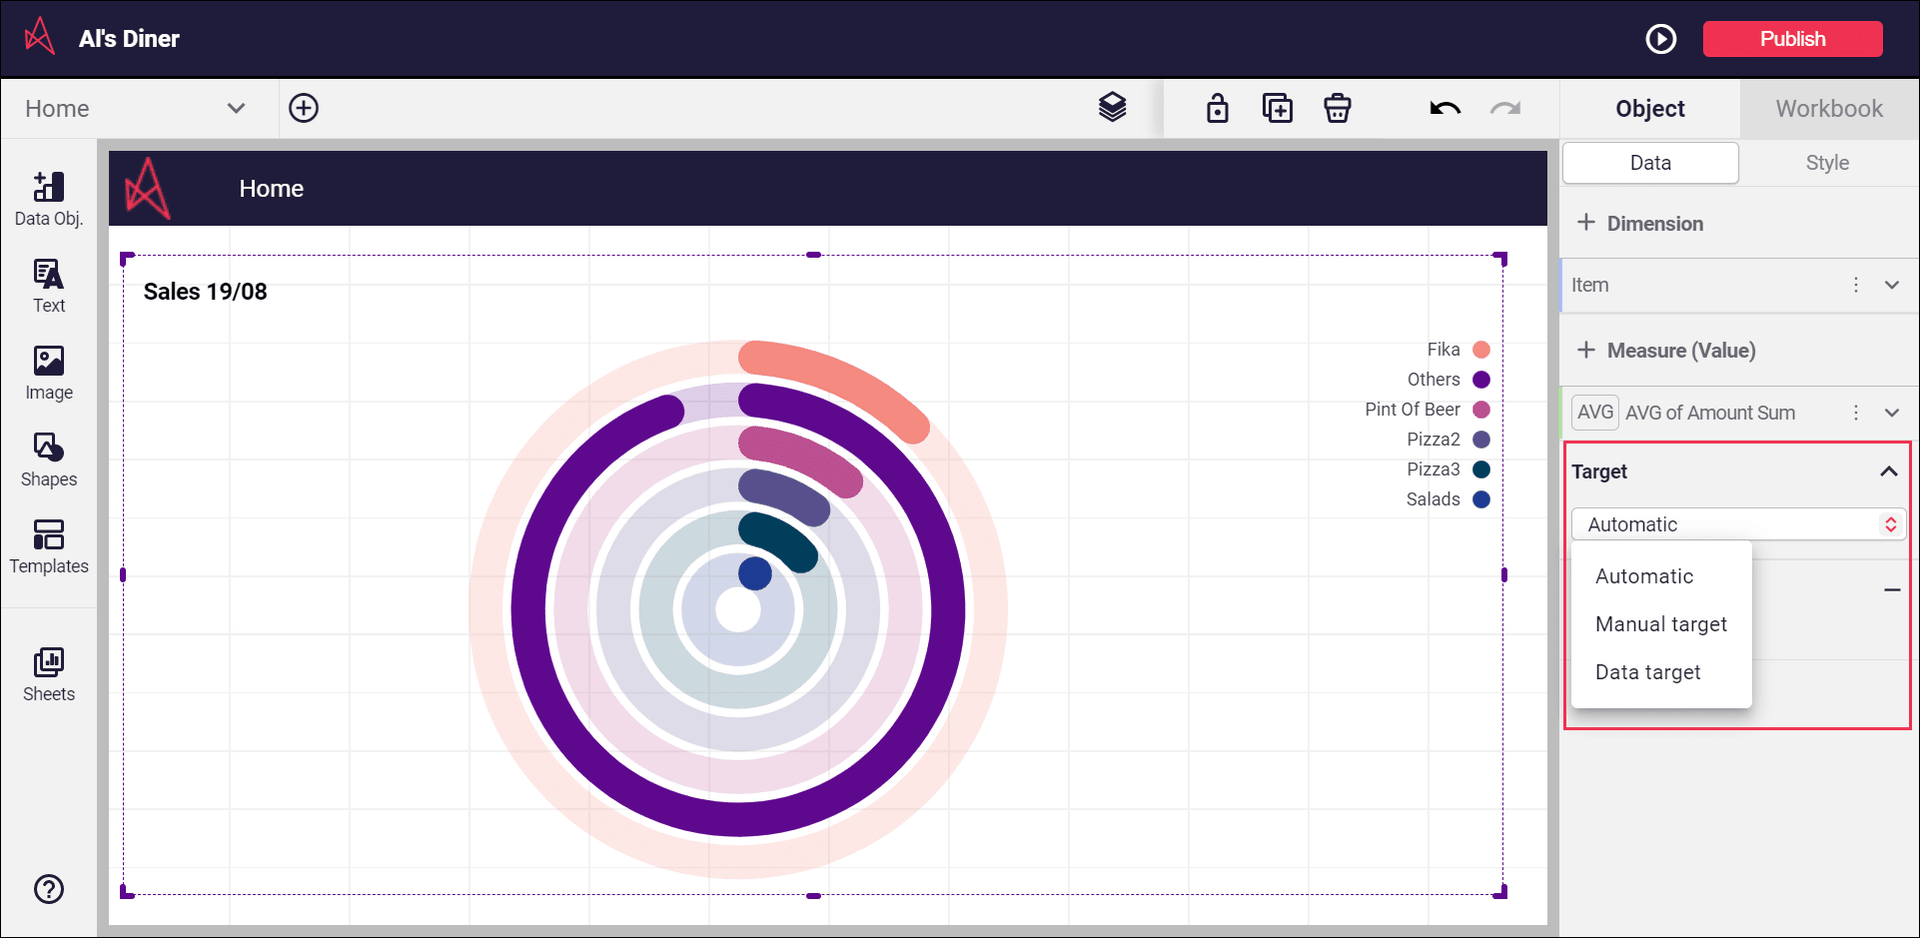
1.4.0 - 04 August 2021
Section titled “1.4.0 - 04 August 2021”Table Word Wrap - If you’re using a table, word wrap is now automatically enabled. You can display up to 445 characters in a cell, and enable a row height limit, and choose to show a maximum number of lines. You’ll always see complete lines, no cut-off text or partial displays. If you disable word wrap, the text is truncated. Remember Pokemon? Yes, we thought you might.
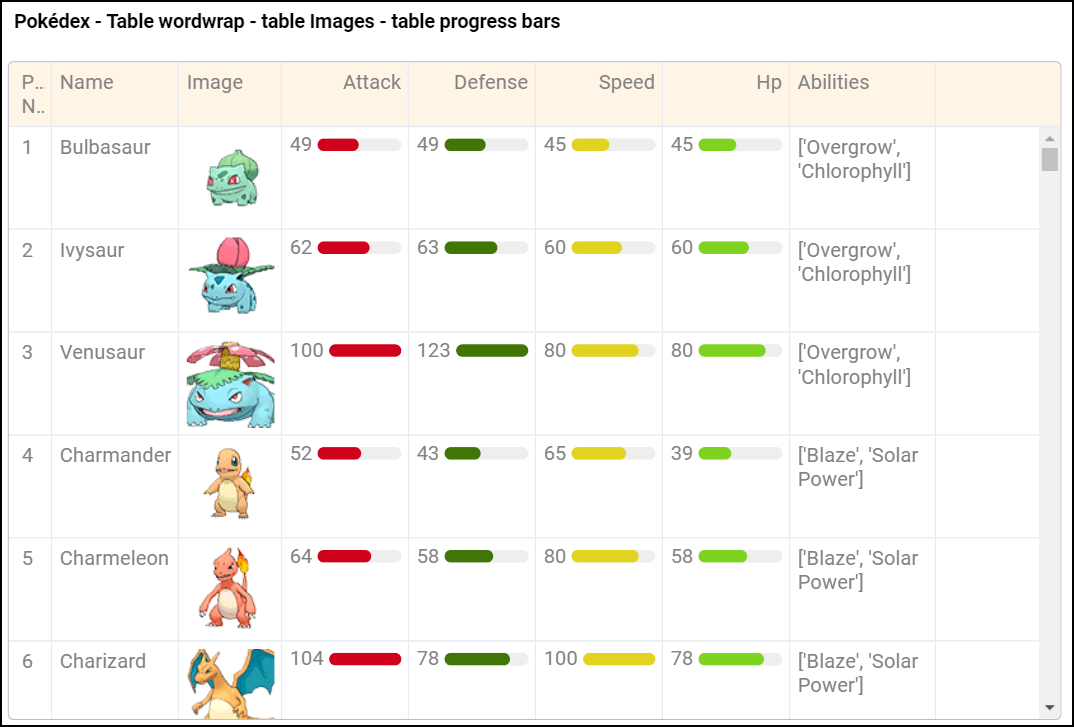
Bar Chart Grouped Bar- If you’re creating a bar chart with 2 dimensions and 1 measure, you can now switch between grouped and stacked bars. You can add multiple measures as well.
Line Chart Multi-Line - If you’re building a visualization with 2 dimensions, you’re now able to use a line chart to display multiple lines, and switch between stacked and overlaying options.
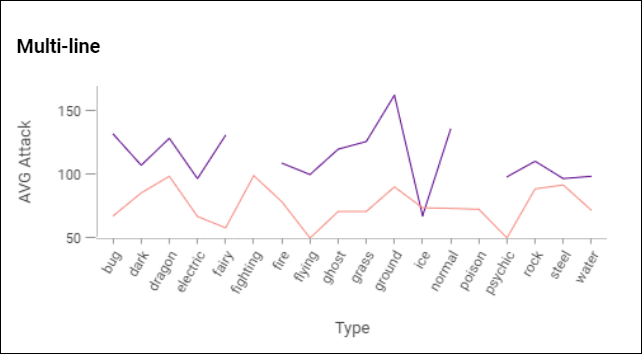
1.3.0 - 22 July 2021
Section titled “1.3.0 - 22 July 2021”Joins - The semantic layer now supports full outer joins to create connected visualizations and dashboards across multiple tables for an associative analytics experience. They’re defined on any field of the same type, and won’t lead to loops or circular joins - we’ll always take the short path.
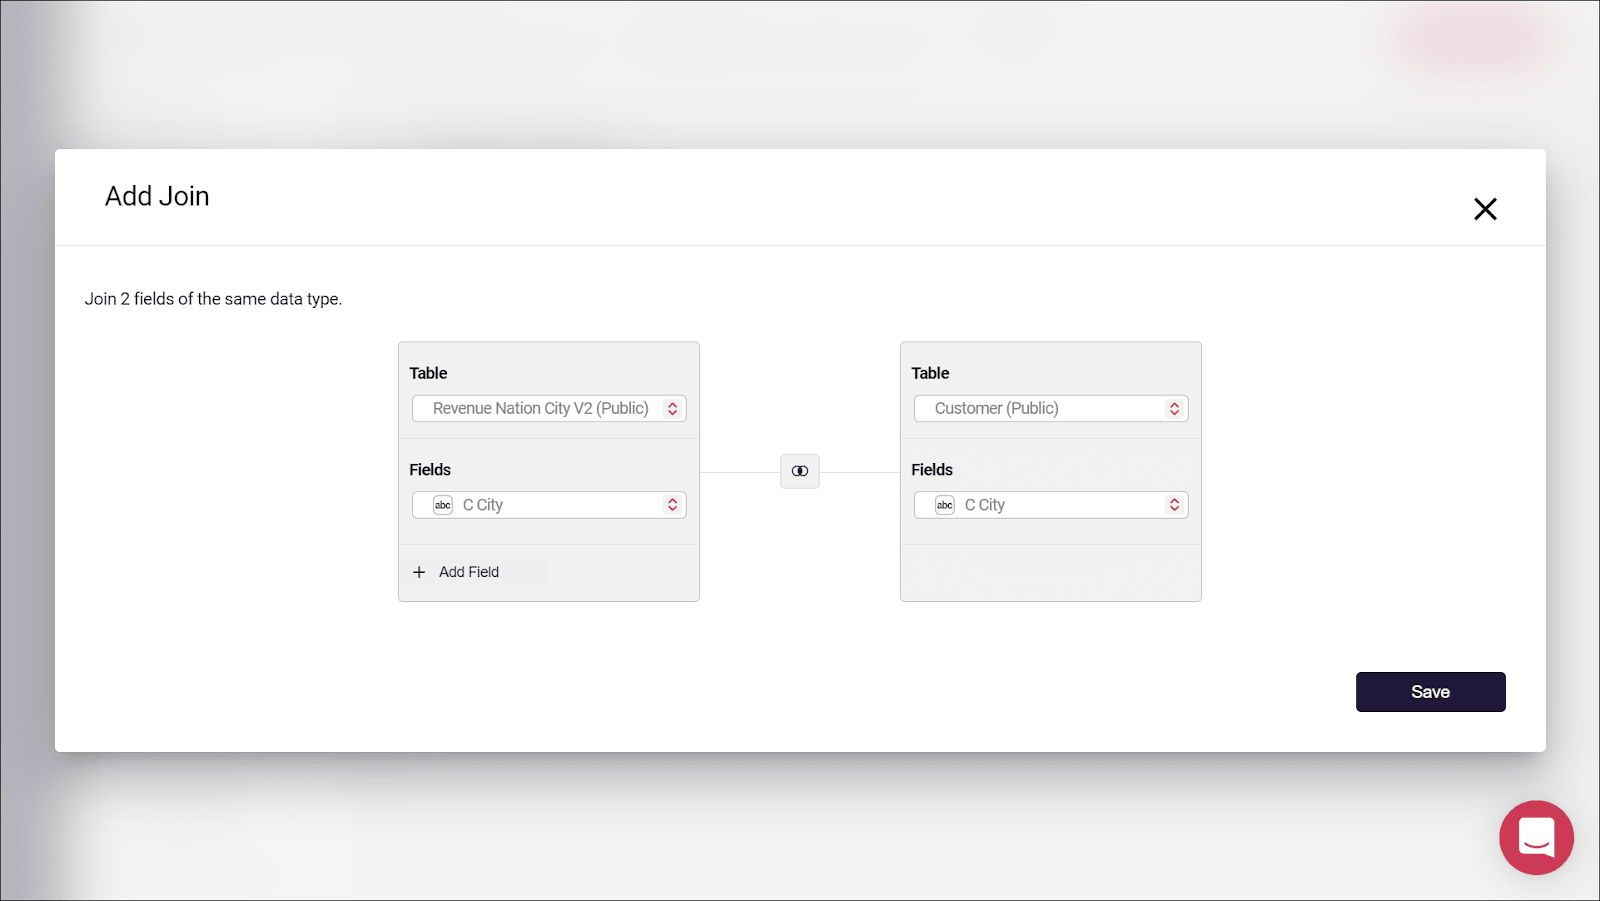
Editing Field Names
Section titled “Editing Field Names”Use the semantic layer to edit field names.
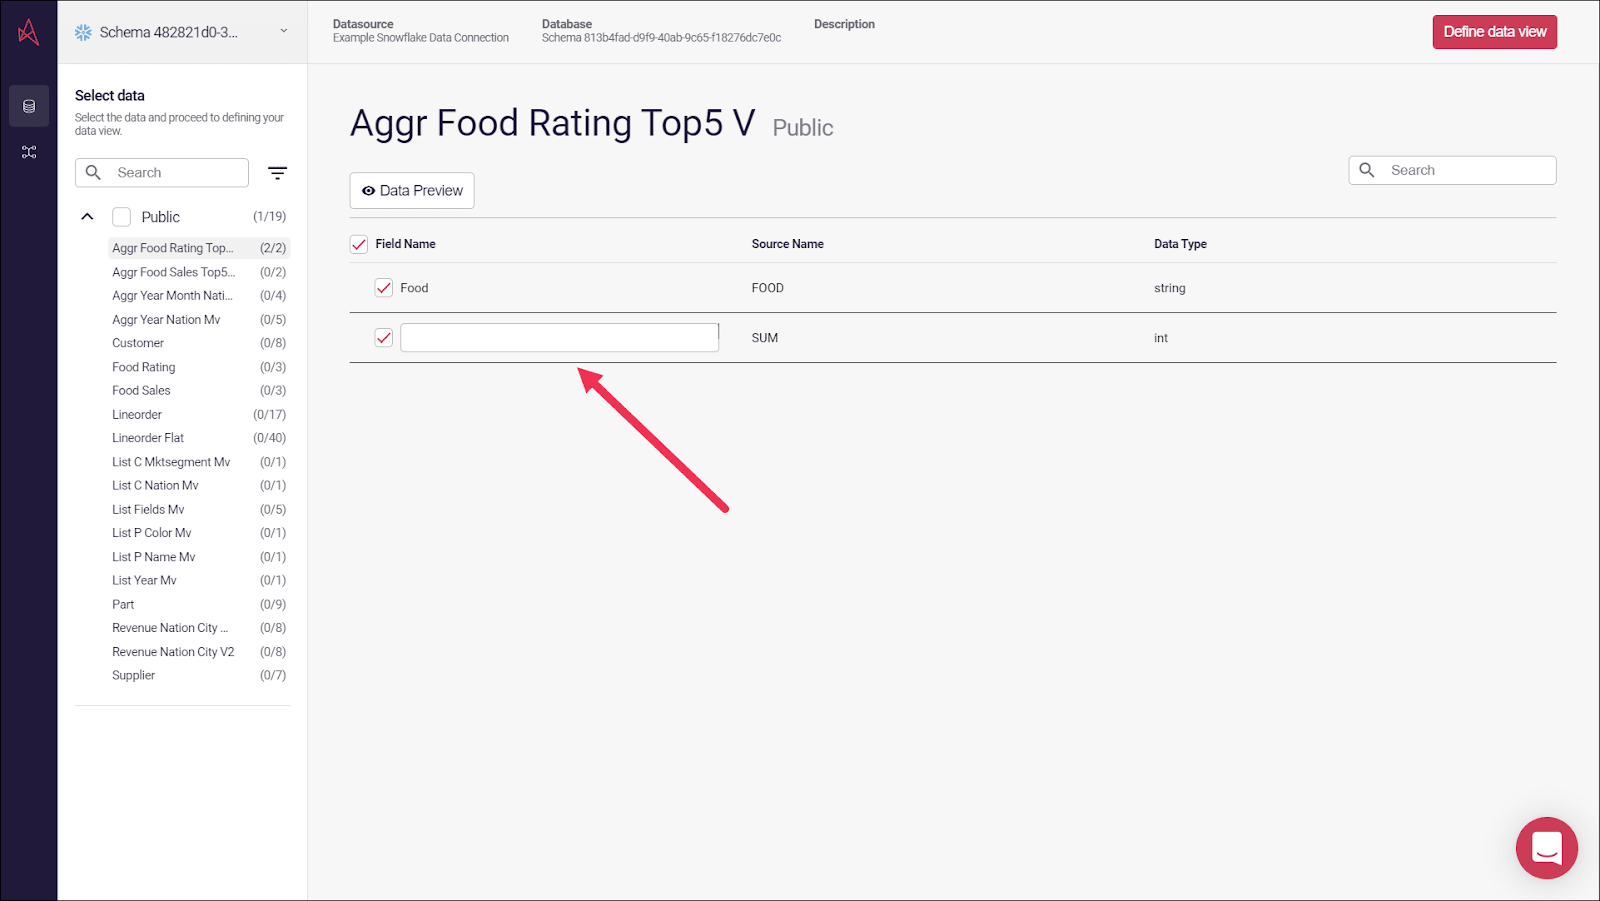
Filter
Section titled “Filter”You can now apply filters to your data visualizations that go across two tables for a true associative experience.
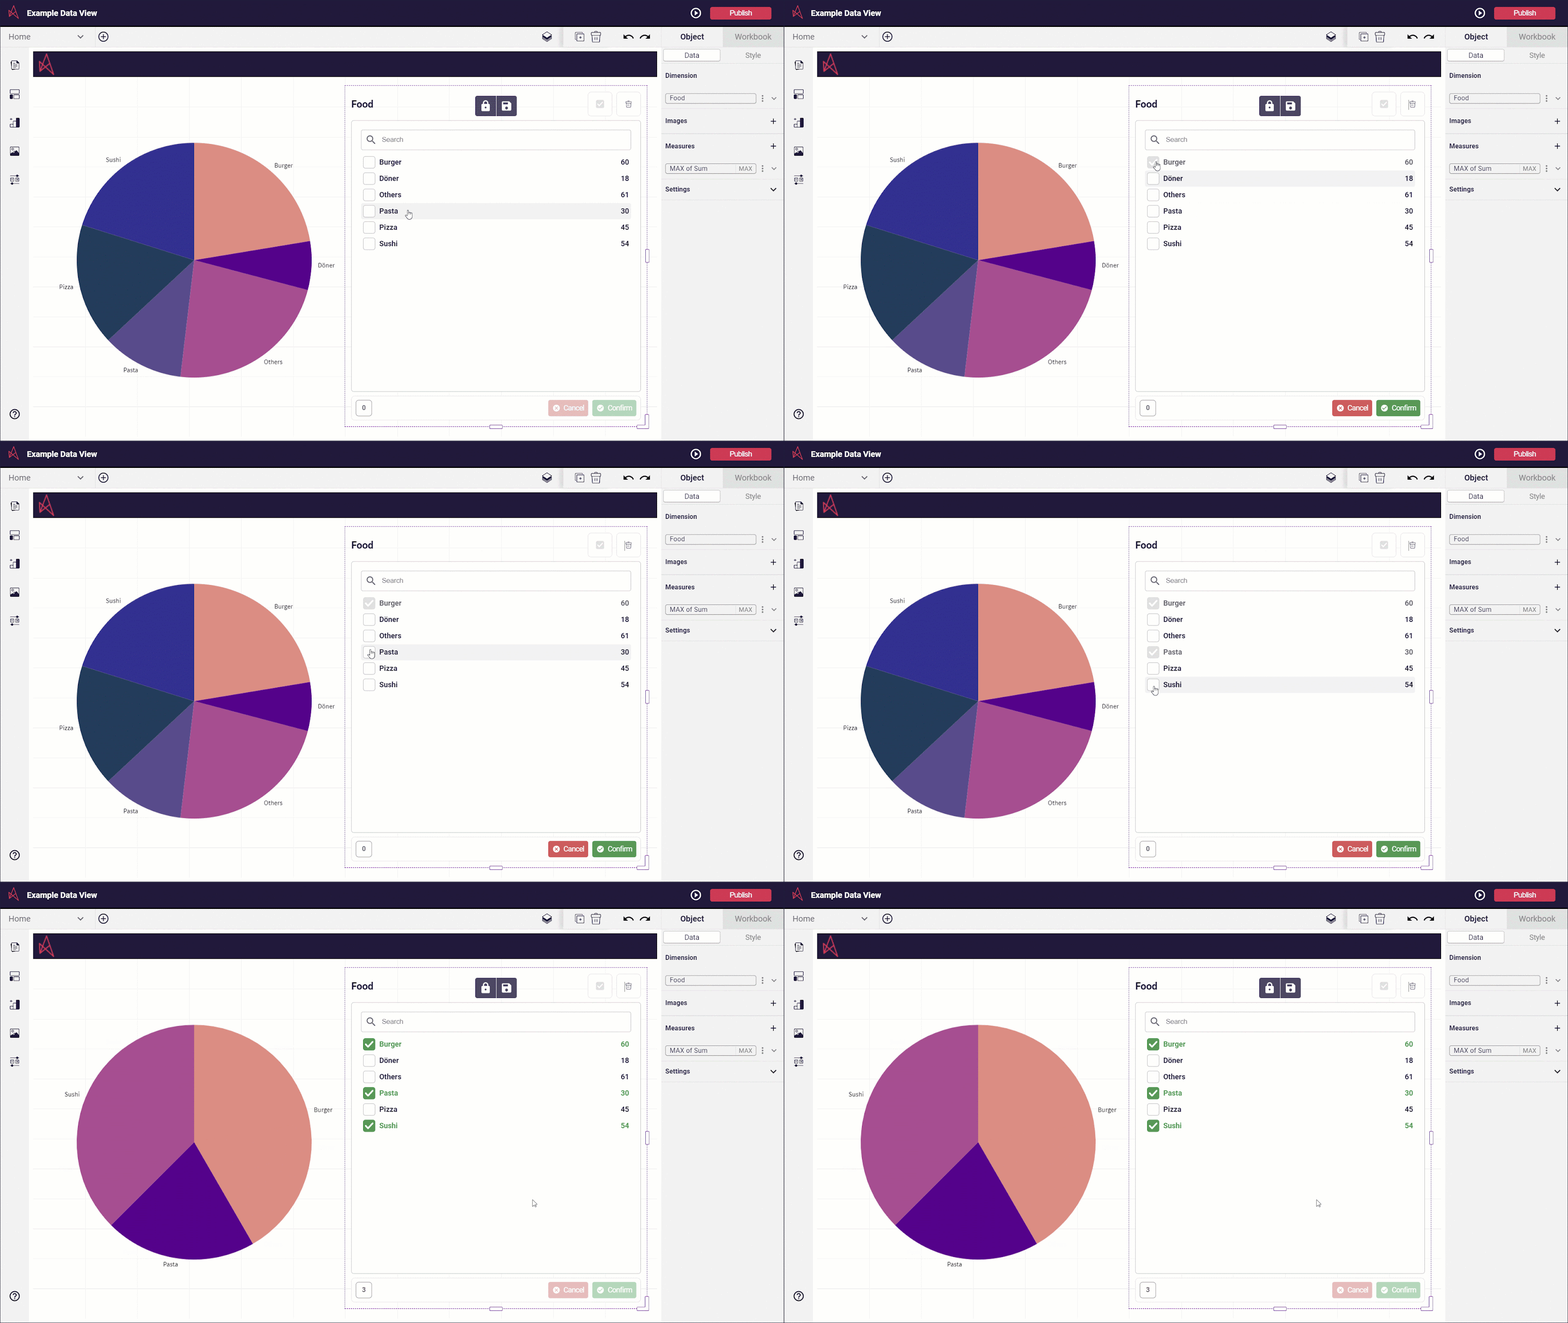
1.2.0 - 09 July 2021
Section titled “1.2.0 - 09 July 2021”Signup and Login options
Section titled “Signup and Login options”You can now use your LinkedIn account or your email address to sign up to Astrato and log in to the site.
Demo data check
Section titled “Demo data check”From the Properties panel in your workbook, select the Data tab to confirm the source of the chart data. A yellow label with the words Demo data is displayed.
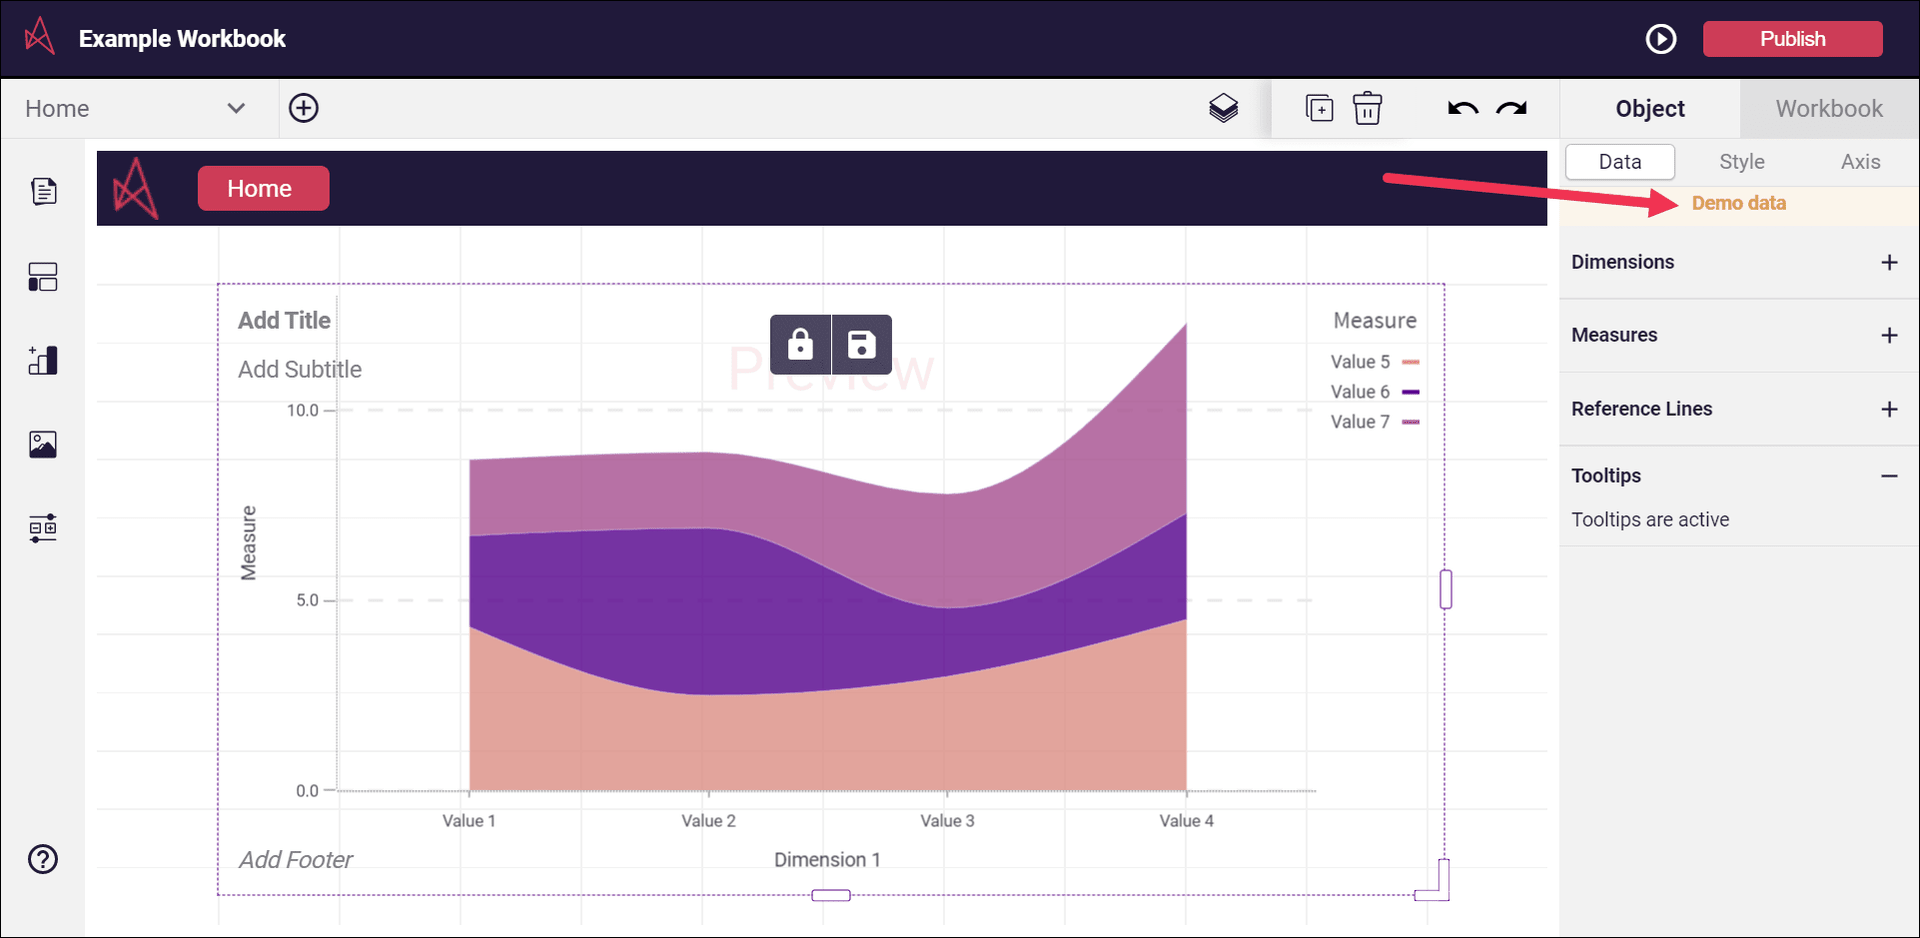
Invite users to Astrato
Section titled “Invite users to Astrato”In the Administration settings for People, click the Invite Users button to add email addresses to generate and send Astrato user invitations.