

Astrato default style
This style keeps what an App gets before any styling: the built-in light chart theme (Roboto, white background), the tenant’s theme palette and panels on a lightly tinted page. The other styles depart from it. Sizing tokens are on Tokens.
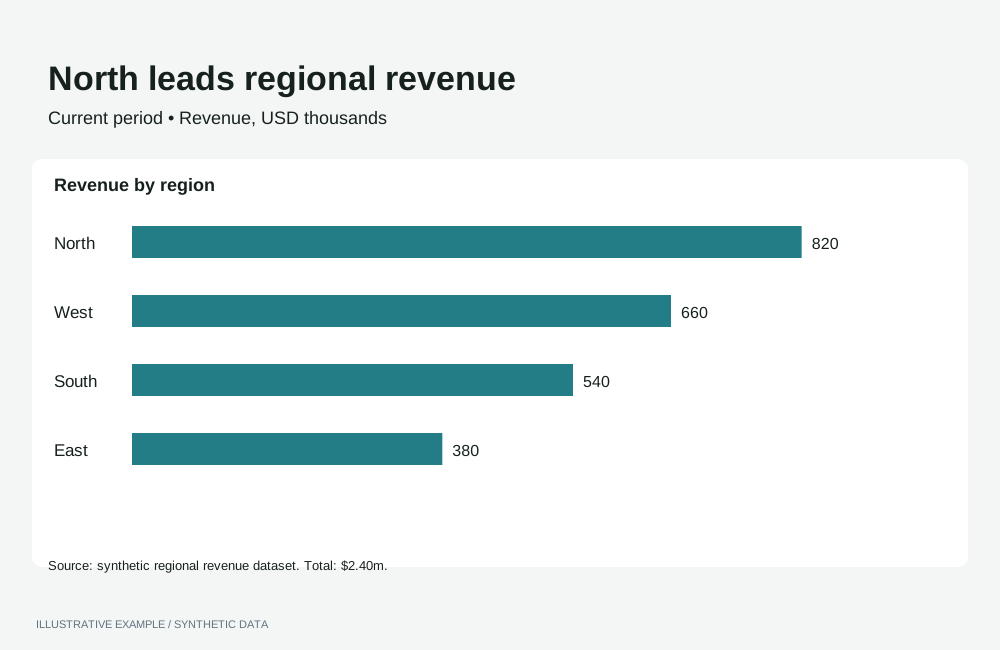
Illustrative example with synthetic data. Quiet surfaces and consistent chart framing.
When to use the Astrato default style
Section titled “When to use the Astrato default style”Use it when the App sits beside Workbooks and should look like them, and as the base for a tenant’s own brand colours: internal dashboards, operational monitoring and self-service reporting.
| The page is mainly | Use instead |
|---|---|
| Separate charts, each making one point from its title | Economist or Financial Times |
| A presentation that leads to one decision | Storytelling with data |
| Indicators read beside prose | Explainer |
| Many items compared at a glance, colour carrying categories | Information is Beautiful |
| A long narrative read by scrolling | Visual essay |
Use cases
Section titled “Use cases”| Use case | What the page shows |
|---|---|
| Workbook rebuilt as an App | The source Workbook’s objects and palette; see Rebuilding a Workbook |
| Operational dashboard | KPIs and charts on panels, in the tenant’s palette, in light and dark |
| Embedded reporting | Charts that match the host product’s Workbooks |
Tokens
Section titled “Tokens”These are the placeholder tokens from Define colour tokens. Replace the colours with your tenant’s theme and keep the names.
:root {  --page: #eeeeee;  --surface: #ffffff;  --line: #d4d4d4;  --ink: #262626;  --muted: #666666;  --panel-border: 1px solid transparent;  --panel-shadow: 0 1px 2px rgb(0 0 0 / 8%);  --accent: #525252;  --delta-up: #1a7f4b;  --delta-down: #b42318;  --radius: 8px;
--font: Roboto, system-ui, sans-serif;}:root[data-theme='dark'] { --page: #0f0f0f; --surface: #1f1f1f; --line: #3a3a3a; --ink: #e8e8e8; --muted: #a3a3a3; --panel-border: 1px solid var(--line); --panel-shadow: none; --accent: #a3a3a3; --delta-up: #6ee7b7; --delta-down: #f28b82;}- Font. Chart text is Roboto and cannot take another family, so set the page in Roboto too. Load it in the host page; see Load visualization fonts.
- Chart palette. Use the tenant’s theme palette, with a dark variant per chart; see Put the palette on the chart.
- Header chrome and radius. See
Keep the chrome consistent across themes
and Rounded corners. Take
--radiusfrom your tenant’s theme.
Page and card chrome
Section titled “Page and card chrome”Charts sit on panels: --surface on --page, separated by a shadow in light and a border in dark;
see Panel backgrounds, borders and shadows.
The panel is the Card with its default row heights.
<figure class="chart"> <figcaption> <h2 class="chart-title">Revenue by region</h2> <p class="chart-subtitle">USD, last 12 months</p> </figcaption> <div class="chart-host"></div></figure>body { margin: 0; background: var(--page); color: var(--ink); font: 400 14px / 1.4 var(--font);}.chart { overflow: hidden;}.chart-title { font-family: var(--font); font-weight: 500; font-size: 15px;}.chart-subtitle { font-family: var(--font); font-size: 13px;}Set font longhands only on Card text; a font shorthand resets line-height and moves the text out
of its row.
Charts
Section titled “Charts”In the light theme, leave chart colours at their defaults. The dark theme needs each colour set by operation, and switching back needs the light values set again, because the built-in values are not documented. Apply the token values in both themes; see Switch themes in place.
Palette
Section titled “Palette”Palette operations are refused while a chart is drawn in one colour. Keep a bar with one dimension
and one measure in one colour, with setColoringColor. On a pie or any other type that opens in one
colour, send the setColoringType that Colouring types names
before the palette.
| Setting | Operation | Value |
|---|---|---|
| Bar in one colour | setColoringColor |
--accent, in both themes |
| Theme default palette, light theme | resetChartPaletteToThemeDefault |
{} |
| Another tenant palette | setChartPalette |
A theme palette label, such as "theme palette 2" |
| Dark theme | setCustomPaletteColors |
The chart’s dark palette |
Axes and legend, bar and line
Section titled “Axes and legend, bar and line”The axis operations take an axisName; bar and line use dimension and primaryMeasure. Other
axis types publish the same operations with their own axis names; check the type’s operations page.
| Setting | Operation | Value |
|---|---|---|
| Axis labels and titles | setAxisLabelColor, setAxisTitleColor |
--muted |
| Axis lines and ticks | setAxisLineColor, setAxisTickColor |
--line |
| Legend text | setLegendItemLabelFill |
--ink |
| Bar data-label backdrop | setMeasureDataLabelBackdropColor |
--surface, per measure |
| Line data-label text | setMeasureDataLabelTextColor |
--ink, per measure |
const token = (name: string) => getComputedStyle(document.documentElement).getPropertyValue(name).trim();
const axes = ['dimension', 'primaryMeasure'] as const;// darkPalette is null for a bar in one colour, which refuses the palette operations.const chartColours = (theme: 'light' | 'dark', darkPalette: string[] | null) => [  ...axes.flatMap((axisName) => [    { name: 'setAxisLabelColor', payload: { axisName, labelColor: token('--muted') } },    { name: 'setAxisLineColor', payload: { axisName, lineColor: token('--line') } },  ]),  { name: 'setLegendItemLabelFill', payload: token('--ink') },  !darkPalette    ? { name: 'setColoringColor', payload: token('--accent') }    : theme === 'dark'      ? { name: 'setCustomPaletteColors', payload: { colors: darkPalette } }      : { name: 'resetChartPaletteToThemeDefault', payload: {} },];
Check each result; see Check operation results.
Pie, number and table
Section titled “Pie, number and table”| Type | Setting | Operation | Value |
|---|---|---|---|
| Pie | Slice labels, per measure | setPieLabelColor |
--ink |
| Pie | Legend text | setLegendItemLabelFill |
--ink |
| Pie | Slice borders, where enabled | setBorderColor |
--surface |
| Number | Figure and comparison | setNumberFontColor, setComparisonFontColor |
--ink, --muted |
| Table | Background and header background | setTableBackgroundColor, setTableHeaderBackgroundColor |
--surface |
| Table | Body and header text | setTableAllColumnsFontColor, setTableHeaderFontColor |
--ink |
| Table | Borders and dividers | setTableBorderColor, setTableColumnBorderColor, setTableHeaderBorderColor |
--line |
| Table | Row highlight | setTableHighlightBackgroundColor |
--page |
| Table | Totals row | setTableTotalsBackgroundColor, setTableTotalsFontColor |
--page, --ink |
A table definition’s presentation takes literal colours: treat them as the light theme and apply
the dark values as operations. Re-apply per-column colours too; see
Colour visualizations with operations.
Titles, labels and annotation
Section titled “Titles, labels and annotation”- Title. Name the measure and its breakdown: “Revenue by region”.
- Units. Keep the default axis titles, or put the unit in the subtitle.
- Numbers and deltas. See Numbers: pin one locale and Deltas and indicators.
Contrast
Section titled “Contrast”WCAG ratios from Measure contrast. Text needs 4.5:1 and series
3:1; --page against --surface is checked against the 1.15 guide and --line against 1.4.
| Pair | Light | Ratio | Dark | Ratio |
|---|---|---|---|---|
--page against --surface |
#eeeeee / #ffffff |
1.16 | #0f0f0f / #1f1f1f |
1.16 |
--line against --surface |
#d4d4d4 |
1.48 | #3a3a3a |
1.45 |
--ink against --surface |
#262626 |
15.13 | #e8e8e8 |
13.45 |
--muted against --surface |
#666666 |
5.74 | #a3a3a3 |
6.53 |
--ink against --page |
13.04 | 15.64 | ||
--muted against --page |
4.95 | 7.60 | ||
| Example palette 1 | #262626 |
15.13 | #f0f0f0 |
14.46 |
| Example palette 2 | #525252 |
7.81 | #cfcfcf |
10.58 |
| Example palette 3 | #6e6e6e |
5.10 | #adadad |
7.34 |
| Example palette 4 | #8c8c8c |
3.36 | #8c8c8c |
4.90 |
Not available
Section titled “Not available”See App limitations: charts do not follow the page theme; the built-in axis, legend and label colours are undocumented, so only the palette can be reset; chart text stays in Roboto; bar data labels have no text colour; gridlines cannot be styled; axis charts, pie and number have no background operation.
Pairs well with
Section titled “Pairs well with”- Layouts: KPI-led, Card grid, Table-first, Hub.
- Experts: Few.
Related
Section titled “Related”- Theming: tokens, dark theme, fonts and chart palettes.
- Styling and theming: the built-in theme and palette operations.
- Visualization operations: every operation per chart type.