

Data Objects - Getting Started
Introduction to Data Objects
Section titled “Introduction to Data Objects”Data Objects
Section titled “Data Objects”When you’re building an Astrato workbook, you’ll add Data Objects to a sheet to display and manage your data. Data objects are split into two categories - Visualizations and Controls (Table 1).
Note: If you see an image that is greyed out, it means the object is being developed and will be added soon.
Table 1: Data Objects
Visualizations are data objects which display data from the data view powering your workbook. |
|
Controls are data objects which manage visualizations. |
Back to Top
Getting Started
Section titled “Getting Started”You’ll find data objects in the workbook editor toolbar (Figure 1).
-
Click the data object icon to open the menu.
-
Click the object you want to use, or drag it onto the sheet.
-
Click and hold to move the object within the sheet. You can also drag the edges to resize the object.
Figure 1: Add Data Object
Back to Top
Properties Panel
Section titled “Properties Panel”Once you’ve added the data object, its settings will be displayed in the properties panel. You can use these settings to add your own data and apply changes to the object’s appearance.
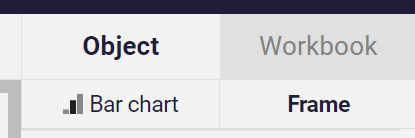
You’ll notice there are two tabs in the properties panel:
One is the tab with the visualization type, in this tab there are all the unique settings for the specific visualization including defining the data for it.
The other is the frame and it includes all the general settings that are shared between all data objects. This tab is called Frame, to learn more about the settings in this section check this article.
Visualization
Section titled “Visualization”In Figure 2, we use the Data tab to apply a Dimension (a group of data values used to construct the chart) and a Measure (a unit used to calculate data in the chart) from the data set, replacing the test values. Switching to the Style tab, we change the Chart Type and select a Color Palette using the options in the Color menu.
Figure 2: Visualization
Back to Top
Controls
Section titled “Controls”In Figure 3 we see a control (a filter in this example) applied to the visualization and managing the appearance of the pie chart. Once the filter is applied, only the selected dimensions (Catalog and Government) channels are displayed.
Figure 3: Control
Back to Top
Settings
Section titled “Settings”There are several categories of settings for Astrato data objects, which are displayed in the properties panel when you select the data object. We’ve listed the settings available for each data object in Table 2.
Table 2: Data Object Settings
Visualizations | Settings |
Data, Style, Layout | |
Number, Pie Chart, Progress Chart | Data, Style |
Bar Chart, Line Chart, Scatter Chart, Combo Chart, Heatmap Chart | Data, Style, Axis |
Controls | Settings |
Data, Style |
Data settings are where you manage the data powering the visualization, adding fields from the data view as dimensions (the type of data you’re displaying) and measures (the quantity of each dimension value). In addition, some data objects will have extra settings like adding Labels and Tooltip, displaying Reference Lines and also applying sorting or limiting functions.
Style settings control the look and feel of your chart. In the Chart settings, you can select a chart type, and there’s even a Design Inspiration function to show you examples if you’re not sure. The Color settings are designed to apply changes in a couple of clicks, either with the color picker or by choosing from a range of pre-defined palettes. There are also specific settings for each data object, including adding a Legend and selecting the Appearance of a data point.
Axis settings control the appearance of the axis for several data objects (see Table 1 above), where you can manage elements like your axis Title and Labels, define an axis Range and add Gridlines.
Layout settings are currently only used with table data objects and control settings for text in table cells.
Back to Top
Linked Objects
Section titled “Linked Objects”The Linked Object feature in Astrato empowers creators to build and maintain data apps with greater efficiency and consistency. By enabling the reuse of buttons and visualizations across an app, it ensures faster updates and streamlined workflows, making it a powerful tool for guided analytics and OEM data products.
With Linked Objects, any updates to the original object are automatically applied to all linked instances—saving time and ensuring uniformity across your app.
Linked Object/Visualization in Astrato
Section titled “Linked Object/Visualization in Astrato”Overview
Section titled “Overview”The Linked Object feature in Astrato empowers creators to build and maintain data apps with greater efficiency and consistency. By enabling the reuse of buttons and visualizations across an app, it ensures faster updates and streamlined workflows, making it a powerful tool for guided analytics and OEM data products.
With Linked Objects, any updates to the original object are automatically applied to all linked instances—saving time and ensuring uniformity across your app.
Key Benefits
Section titled “Key Benefits”-
Time Efficiency: Reuse visual elements across your app without recreating them.
-
Easy Maintenance: Make updates in one place, and they’ll apply everywhere the object is used.
-
Consistency: Keep your data app interface consistent by linking shared elements.
How to Use Linked Objects
Section titled “How to Use Linked Objects”1. Copy an Object
Section titled “1. Copy an Object”To create a linked object, follow these steps:
-
Select the object (e.g., button, visualization) you want to reuse.
-
Open the context menu (right-click or click the options menu).
-
Choose Copy.
2. Paste as Linked
Section titled “2. Paste as Linked”Once the object is copied:
-
Navigate to the location where you want to reuse the object.
-
Open the context menu and select Paste as Linked.
The object will now be linked to the original. Any changes made to the original will automatically be reflected in the linked instance.
Editing Linked Objects
Section titled “Editing Linked Objects”-
Centralized Updates: Linked objects are edited in a central location.
-
Uniform Behavior: Linked buttons and visualizations perform the same set of actions, such as triggering filters or navigation.
Best Practices
Section titled “Best Practices”-
Plan Shared Components: Use linked objects for frequently reused elements like navigation buttons, headers, and common KPIs.
-
Avoid Overuse: While linked objects save time, use them strategically to avoid unnecessary complexity.
Unlinking an Object
Section titled “Unlinking an Object”If you need to break the link:
-
Right-click the linked object.
-
Select Unlink to convert it into a standalone object.
-
The object will no longer receive updates from the original.