Creating efficient queries using data Query Profile Insights
Astrato’s Data Query Profile Insights detects and identifies query inefficiencies - no coding required. This feature works with Snowflake’s new table function - GET_QUERY_OPERATOR_STATS - that returns statistics about individual operators within a query.
Figure 1: Right-click on any chart, scroll down to select Data Query Insights
Viewing your Data Query Insights
Section titled “Viewing your Data Query Insights”-
Right-click on any chart.
-
Scroll down to select Data Query Insights.
-
The Query Profile Insights details display beneath the formatted SQL query.
-
The results display a red circle when a common query inefficiency - Cartesian, Union, Memory, or Pruning - appears.
-
Click Copy result to send the results to your Snowflake administrator. The results include the number of rows scanned and the estimated credits the query uses.
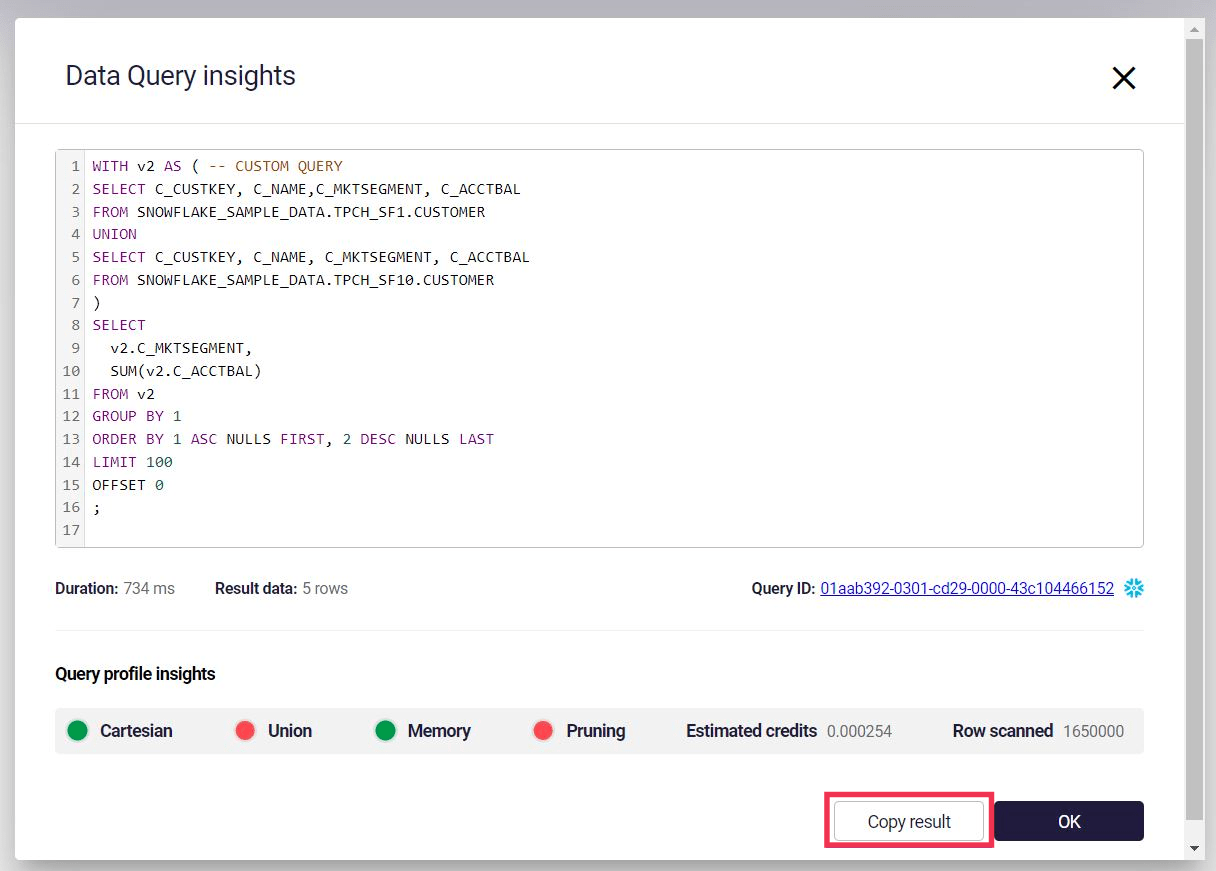
Figure 2: View and copy the results of the data Query Profile.
Example of a query result
Section titled “Example of a query result”{"querylink":"https://app.snowflake.com/west-europe.azure/XXXXXX/#/compute/history/queries/XXXXXXXX-XXXX-XXXX-XXXX-XXXXXXXXXXXX/detail","cacheUsed":false,"metaDataQuery":false,"creditsBestCase":3.1e-05,"creditsWorstCase":0.000276,"creditsFairValue":0.000276,"rowsScanned":2788,"joinIssue":false,"unionIssue":false,"memoryIssue":false,"pruningIssue":false}How to read the query insights
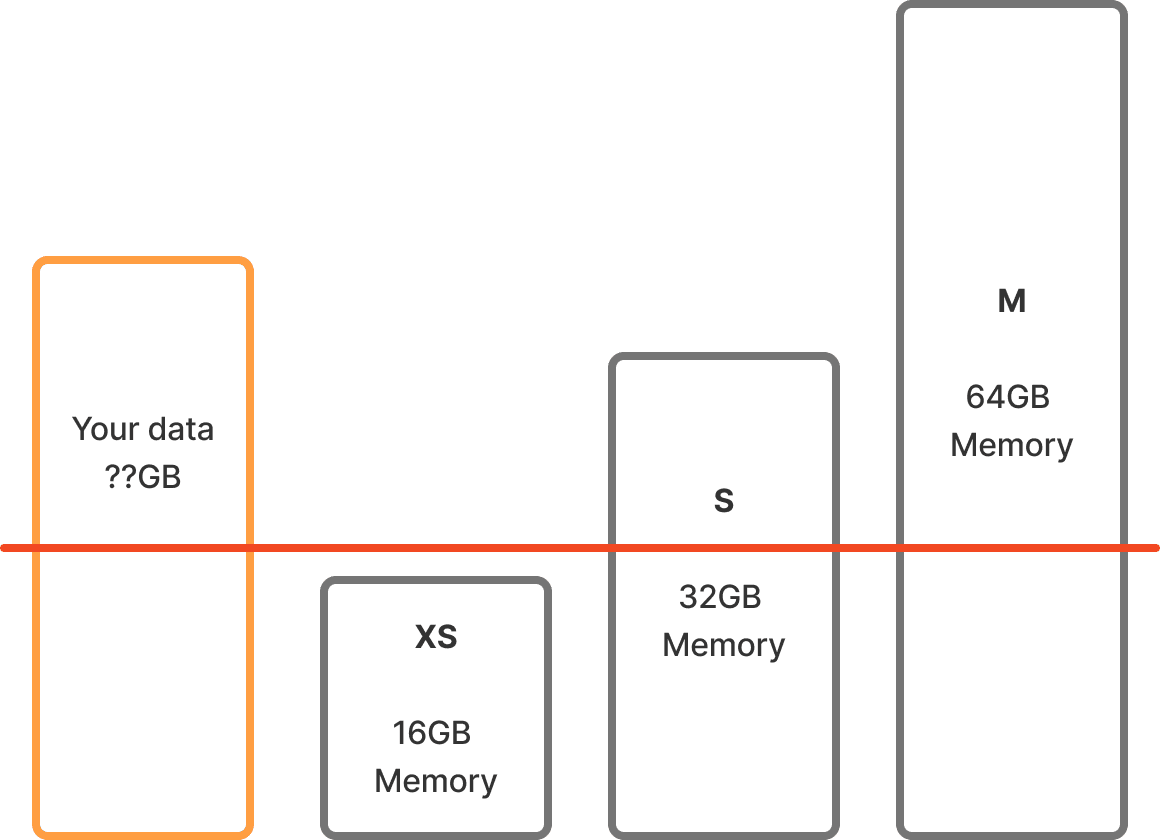
Section titled “How to read the query insights”One of the key signals in inefficient queries or incorrectly sized warehouses, is memory. If a warehouse is out of memory, the data being queried is larger than the resources available in the warehouse, which leaves 2 options:
-
Query less data (possible via clustering tables)
-
Increase warehouse size