

Start from a CSV file
Use this page when your data is a CSV file, for example an export from a spreadsheet, rather than a table already in a database. You upload the file in the semantic layer editor, Astrato loads it into a new table in your data connection, and the table lands on the map ready to model. From there, Your first Data App carries on as usual.
Before you start
Section titled “Before you start”- Your role must be Creator, Admin or Owner. The semantic layer editor is in Data & AI. A Designer does not have it on the rail, and a Viewer can only be given View on a layer. See Roles.
- You still need a data connection. The upload is stored as a real table, so it goes into a data
connection your workspace already has, and that connection must allow writes: Astrato creates a
schema for uploads in it, named
Astrato. A read-only connection is refused before you can pick a file. If you have no connection at all, create one first in Data connections, or ask whoever administers your workspace which connection takes uploads. Only read-only connections to hand? A table of up to 100 cells, such as the sample below, can go into an inline table instead; see No writable connection?. - You need a semantic layer on that connection. Create one in Data & AI → Semantic Layers with Create, then New Semantic Layer, selecting the connection as the Datasource. See Create a semantic layer.
- Check the file’s size. An upload takes up to 10 MB, 100,000 rows and 1,000 columns.
- Save the file as CSV. The file picker accepts
.csvfiles. In a spreadsheet, use your application’s save or download option for comma-separated values. A semicolon-separated export works too: the delimiter is detected from the file.
No file to hand? Use this sample
Section titled “No file to hand? Use this sample”To try the steps without your own data, copy these lines into a text file and save it as
sales.csv.
order_date,region,product,units,revenue2026-01-05,North,Road bike,2,24002026-01-09,South,Helmet,10,4502026-01-14,East,Road bike,1,12002026-01-20,West,Mountain bike,3,42002026-02-02,North,Helmet,6,2702026-02-11,South,Mountain bike,2,28002026-02-17,East,Gloves,12,3002026-02-25,West,Road bike,2,24002026-03-03,North,Gloves,8,2002026-03-10,South,Road bike,1,12002026-03-18,East,Mountain bike,1,14002026-03-27,West,Helmet,5,225The rest of this page, and the worked example in Your first Data App, uses this file.
Upload the file
Section titled “Upload the file”-
Open your semantic layer in the editor and stay on the Map tab.
-
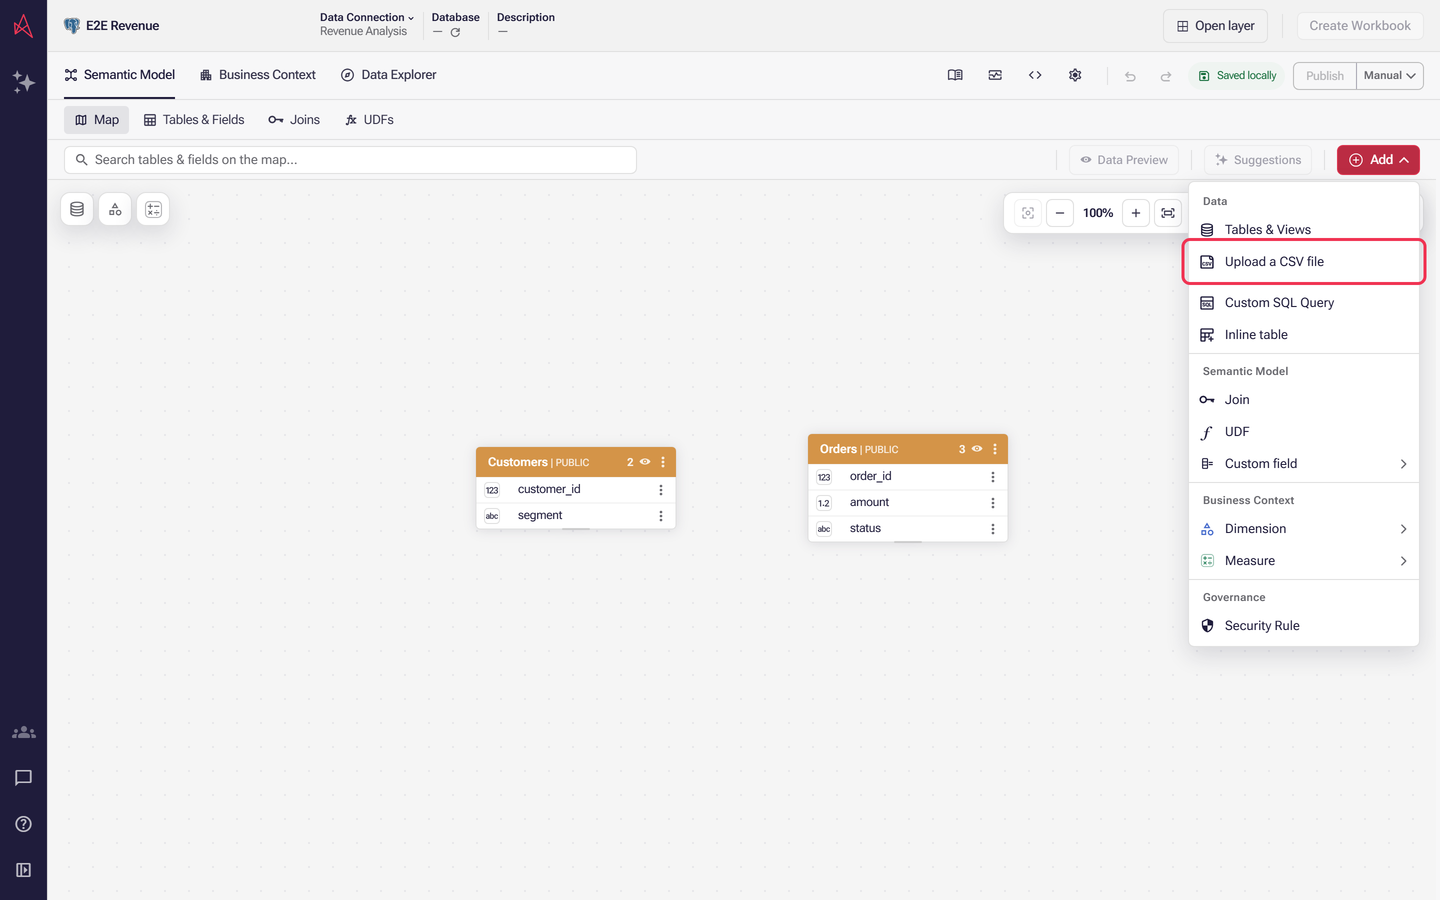
Select Add in the toolbar, then Upload a CSV file under Data. The Upload a CSV file dialog opens.
-
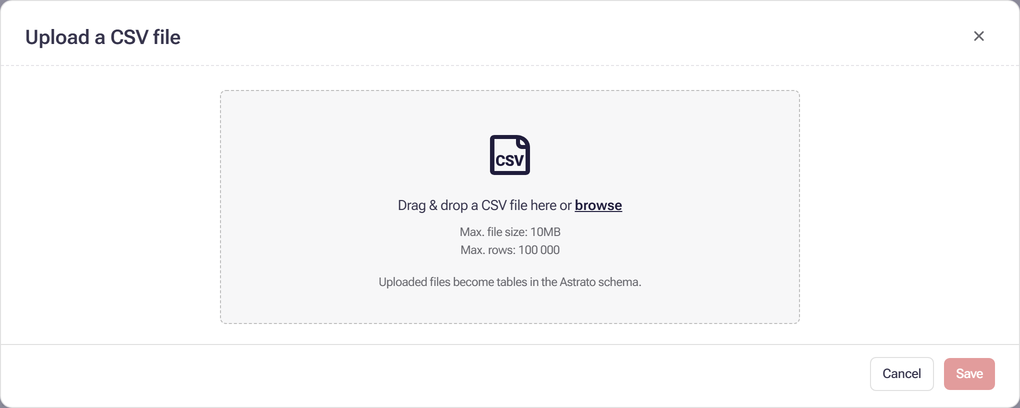
Wait while the dialog shows Checking where this connection stores uploaded files…. When the connection can take an upload, a drop area appears with the size limits and a line such as Uploaded files become tables in the Astrato schema.
-
Drag your file onto the drop area, or select browse and pick it.
-
Check the preview:
- Table name starts as the file name without
.csv, for examplesales. Change it if you like. - Set the first row as the header is ticked. Untick it if your file has no header row.
- Each column has a tick box and a data type. Untick a column to leave it out, and change a type
if it was guessed wrong. The types offered are
boolean,date,float,int,string,timeandtimestamp. - The preview shows up to the first 20 rows. Every row in the file is imported.
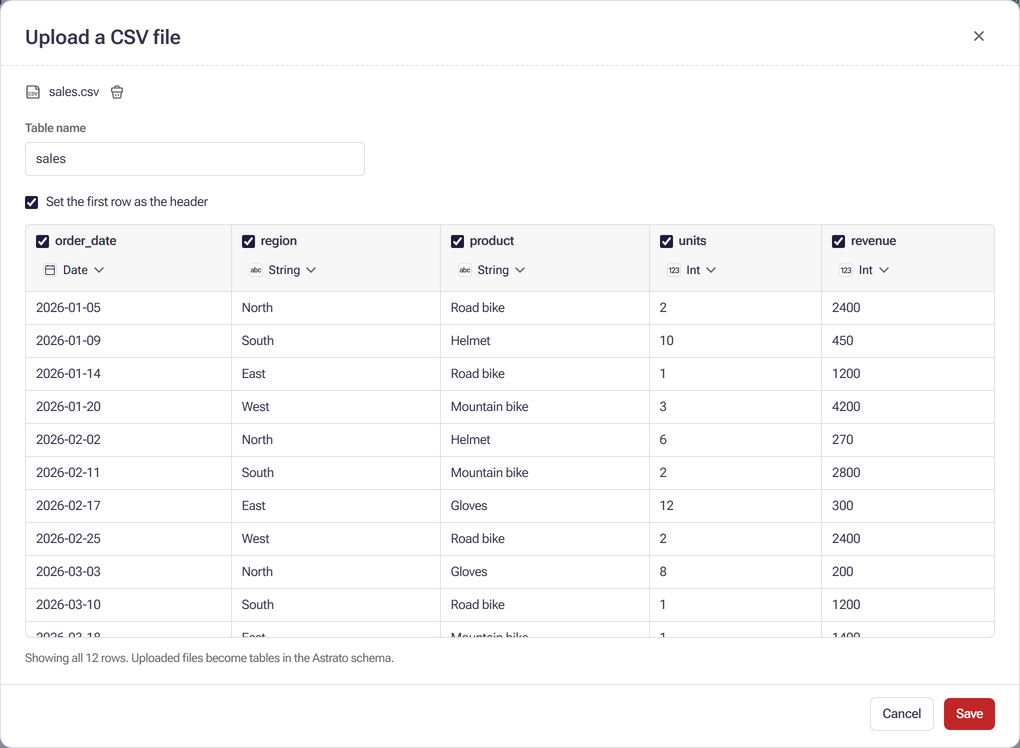
- Table name starts as the file name without
-
Select Save. The dialog shows Uploading and importing… while it works.
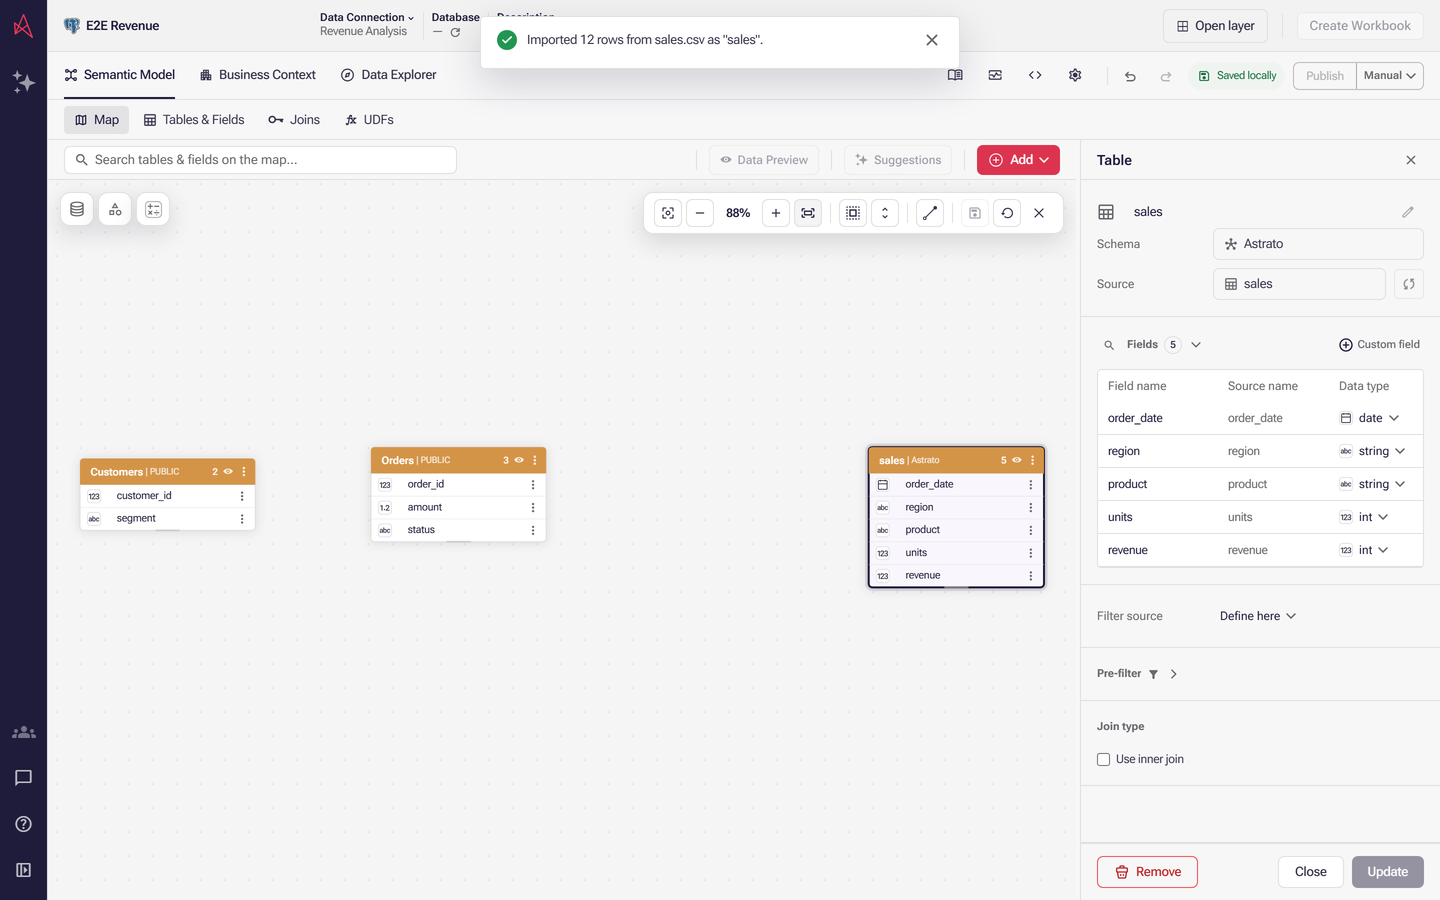
Result: the dialog closes, a message such as Imported 12 rows from sales.csv as “sales” appears, and the new table sits on the map with all its columns as fields. The table is selected. The change is in your draft until you publish the layer.
Column names can change on the way in: the importer normalises headers, so a header such as
firstName can become first_name. Use the names you see on the map.
If the upload does not work
Section titled “If the upload does not work”- The dialog shows a message instead of the drop area. The connection cannot take an upload, usually because it is read-only, or the layer has no data connection. Use a connection that allows writes, or ask its owner to give the connection’s credentials the right to create a schema and tables.
- Save stays unavailable. Hover over it to see why. It needs a file, a table name and at least one ticked column. A name that is already used in the upload schema is refused: choose another.
- The file is refused when you pick it. The message says why, for example That file has no rows. Check that it is a CSV file with at least one row of data.
- The import fails after you select Save. The dialog stays open with the reason and keeps your file, so you can fix the name or a column type and select Save again.
- The table is not where you expected. Open Add, then Tables & Views, and look in the upload schema named in the dialog.
No writable connection? Paste a small table
Section titled “No writable connection? Paste a small table”An Inline table keeps its rows in the semantic layer itself rather than in your database, so it works on a read-only connection. It holds up to 100 cells and 20 columns, which suits the sample above (12 rows of 5 columns) and short lookup lists, not a full data set.
-
Open your semantic layer in the editor and stay on the Map tab.
-
Select Add in the toolbar, then Inline table under Data. The Create inline table dialog opens.
-
Enter a Table name, for example
sales. -
Copy the whole sample, header row included, from a text file or a spreadsheet. Click the first column’s name in the grid and paste. The column names and rows fill in from what you pasted; the counter above the grid shows how many of the 100 cells you have used. If every line lands in the first column instead, copy again with an empty line at the end and paste once more.
-
Check the data type above each column, and change any that is wrong:
unitsandrevenueare numbers,order_dateis a date.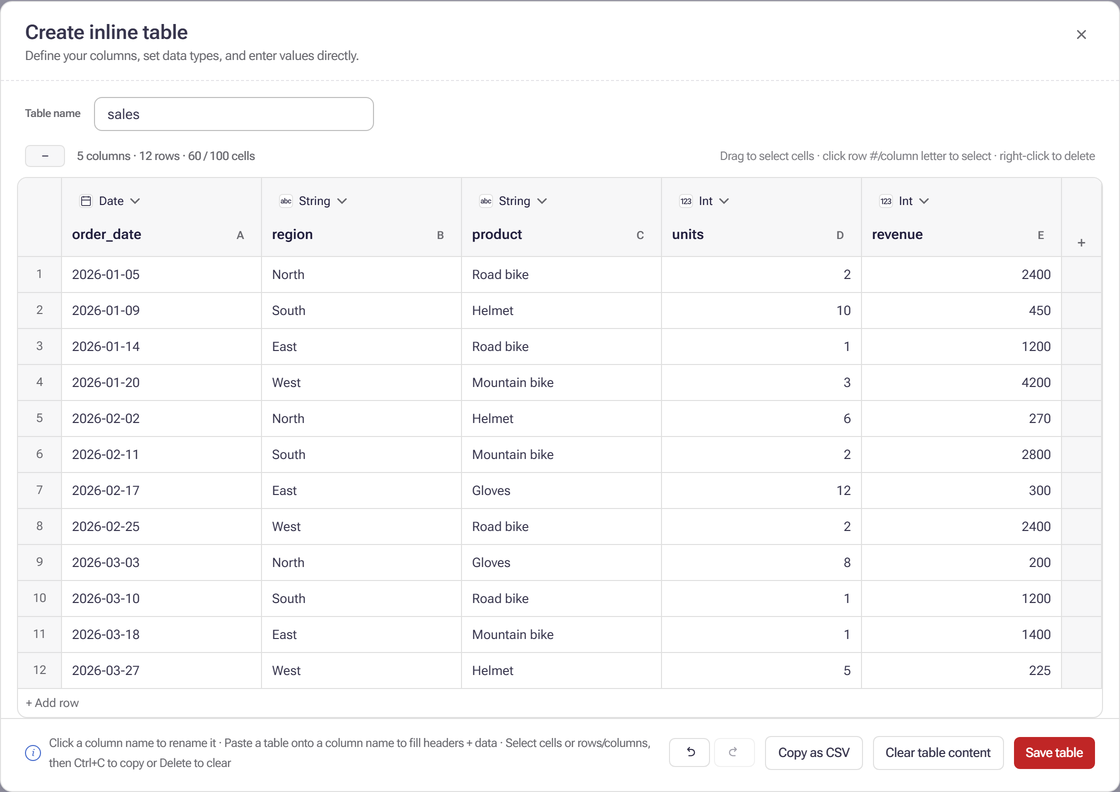
-
Select Save table. It stays unavailable until the table has a name that is not already used, at least one value, and every value matches its column’s data type; hover over it to see why.
The table appears on the map like any other, and Your first Data App carries on from there. As with an upload, the table is in your draft until you publish the layer.
Prefer to ask Nash? You can also attach a CSV file to a message in the Nash panel and Nash imports it the same way. See Attach a file to a message.
What next
Section titled “What next”- Your first Data App: turn the uploaded table into a measure and a dimension, publish, and build the app.
- Define a measure in Business Context: every kind of measure, in full.
- Publish your changes: what to do when Publish is unavailable.
- Data connections and CSV imports with MCP: the same import from an AI assistant.