

Legend
A legend names what each colour on a chart means. For a mounted chart, use the chart’s own legend or name the series in text. For an app-drawn object, an HTML legend can share its colours and bins. Use Chart rendering policy when the object is a custom chart; ordinary icons, shapes and UI indicators need no exception.
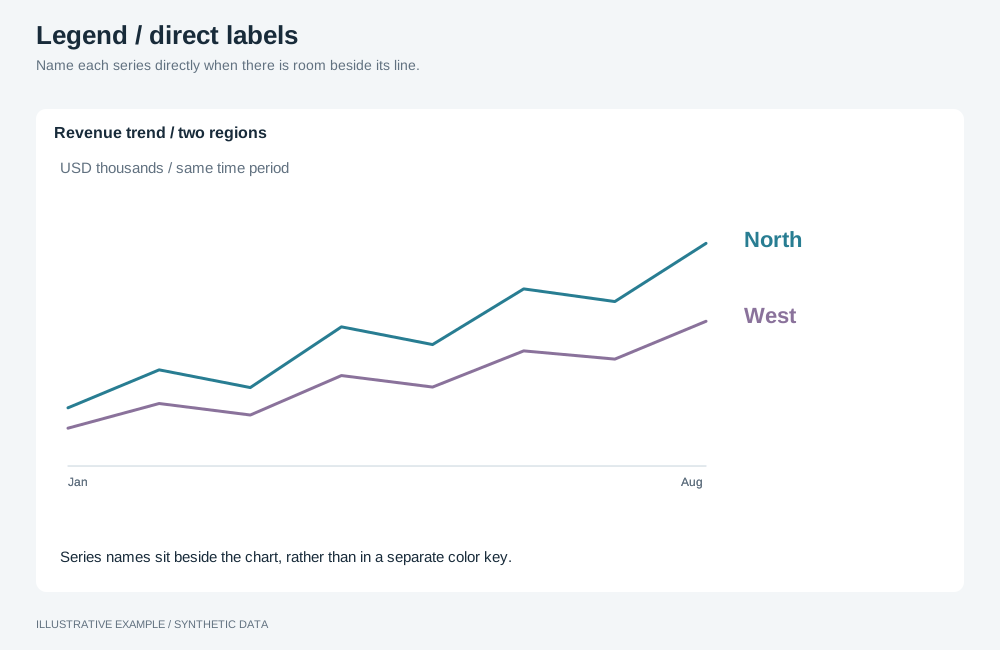
Illustrative example with synthetic data. Name each series directly when there is room beside its line.
Choose a variant
Section titled “Choose a variant”- Can each series be named in the title, subtitle or text beside the chart? Use direct labels.
- Is the object a mounted chart? Use the chart’s own legend.
- Is it an object your app draws? Use a legend for an object you draw.
| Variant | Where | Common use cases | Choose another variant when |
|---|---|---|---|
| Direct labels | The title, subtitle or nearby text | Actual against target; this year against last year | More than about three series |
| Chart’s own legend | Inside the chart | Sales by channel as stacked bars; tickets by priority as a pie | The chart type has no legend setting |
| For an object you draw | Beside or under the object | The bins of a hand-drawn choropleth | The object is a mounted chart |
Direct labels
Section titled “Direct labels”Name the series in the subtitle or text and turn the chart’s legend off with the settings below.
The chart’s own legend
Section titled “The chart’s own legend”Set the legend in the definition’s legend feature, which covers visibility, position and title;
see definitions. Change it later with setLegendEnabled,
setLegendPosition (left, right, top, bottom), setLegendTitle and
setLegendItemLabelFill for the text colour.
In the current visualizations package, these settings exist on bar, combo,
distribution-gauge, dot, gauge, heatMap, histogram, line, pie, radar, scatter and
treemap. Check each type’s page in the operations reference; see
Operation names are per type. Re-apply the label
colour when the theme changes; see Switch themes in place.
Legend for an object you draw
Section titled “Legend for an object you draw”When your app draws the object from its own query, colour the marks and the swatches from the same values and the same function, so they cannot disagree.
<ul class="legend" aria-label="Sales, USD"> <li class="legend__item"> <span class="legend__swatch" aria-hidden="true" style="--swatch: var(--map-1)"></span>Under 100K </li> <!-- one item per colour, in the object's order --></ul>.legend { display: flex; flex-wrap: wrap; align-items: center; gap: 0 16px; margin: 0; padding: 0; list-style: none; line-height: 20px;}.legend__item { display: inline-flex; align-items: center; gap: 6px; white-space: nowrap;}.legend__swatch { flex: none; width: 10px; height: 10px; border-radius: 2px; background: var(--swatch);}.legend--line .legend__swatch { width: 16px; height: 3px; border-radius: 0;}- The swatch is
aria-hidden; the label carries the meaning. - Write labels with
textContent; they are data. - A legend that wraps adds 20px per line; include it in the layout’s scrolling threshold.
Not available
Section titled “Not available”An HTML legend cannot be kept in step with a mounted chart’s colours: no operation assigns a colour to a named category, and no call reads back the colours a chart used. This also rules out one shared legend for several mounted charts, and legend entries that filter while showing the chart’s colours; use quick filters for filtering. See Chart settings and Styling and theming.