

The Context Map in Business Context
A semantic layer is built one measure and one question at a time, and nobody holds the whole of it in their head. The Context Map draws it: every business question, measure, dimension, dataset and filter is a dot, and a line joins any two where one reaches for the other. It answers what a list cannot — what everything depends on, what nothing asks for, and where the same number has been defined twice.
It is the first tab under Business Context → Context Map, and it is available where Business Questions are enabled for your workspace. The map is drawn from the layer you are editing, so your unpublished work is on it. Until the layer holds a business question, measure or dimension, the tab says Nothing to map yet.
What the map draws
Section titled “What the map draws”The Entities legend in the Insights card names each kind of dot the picture holds — Business Questions, Datasets, Filters, Measures, Dimensions, Fields, Tables and Categories — with how many of each there are. The Relations legend names each kind of line in the picture: a question selects a measure or filters on a dimension, a measure is derived from another, a dimension drills to its levels, a question is followed up by another, and anything is filed under a category. Selecting a legend entry hides that kind, and selecting it again brings it back. is filed under starts hidden, so category lines appear only once you ask for them.
Hover a dot for its kind and its connection count. That count, and the Connections tile, count only lines between business concepts: a link to a field, a table, a category or a look-alike does not add to them.
Find your way around
Section titled “Find your way around”Type in the search box to light up what matches, with their neighbours; it reports No results or how many it found. Select a dot to light up its neighbourhood; select it again, use Clear, or press Escape to let the map go. Tab and the arrow keys move between dots. Zoom in, Zoom out and Fit whole map change the view, and Replay the layout settles the dots again.
Selecting a dot also opens a card with its kind, name and categories. Below that, one section per relation lists what it is joined to — selects 4 measures, is selected by 2 business questions — as chips you can select to walk across the graph. An entity joined to nothing says Not connected to anything, and Overlaps appears where something else says the same thing. On a measure or dimension, Show fields & tables adds the fields it reads and their tables. Open in editor opens the entity where you edit it, as does double-clicking a dot.
The three toggles
Section titled “The three toggles”- Show unused draws the measures and dimensions that nothing selects, filters on or derives from. It is off by default: on a large layer they outnumber everything connected.
- Show overlaps joins entities that say the same thing — measures with the same definition, field dimensions on the same field, questions with the same selection. It is on by default.
- Group by category pulls the entities sharing a category together and outlines each one with its name above it. It also adds Uncategorised and Categories that share members to Insights.
The toggles, the hidden kinds and whether Insights is open are remembered for that semantic layer, so the map opens the way you left it.
What Insights reports
Section titled “What Insights reports”Four tiles sit at the top: Connections, Clusters — islands of two or more entities with no line running out to the rest — and Measures asked and Dimensions asked, the share of your measures and dimensions that at least one business question selects or filters on.
Coverage then lists Largest cluster, Unused measures & dimensions, Unlinked questions — questions that select, filter on and follow up nothing in the layer — and, while grouping by category, Uncategorised. Selecting a count selects those entities on the map. Consolidation candidates lists the look-alike groups with the reason for each, and Most connected ranks the measures and dimensions the layer leans on hardest.
Audit what no question asks about
Section titled “Audit what no question asks about”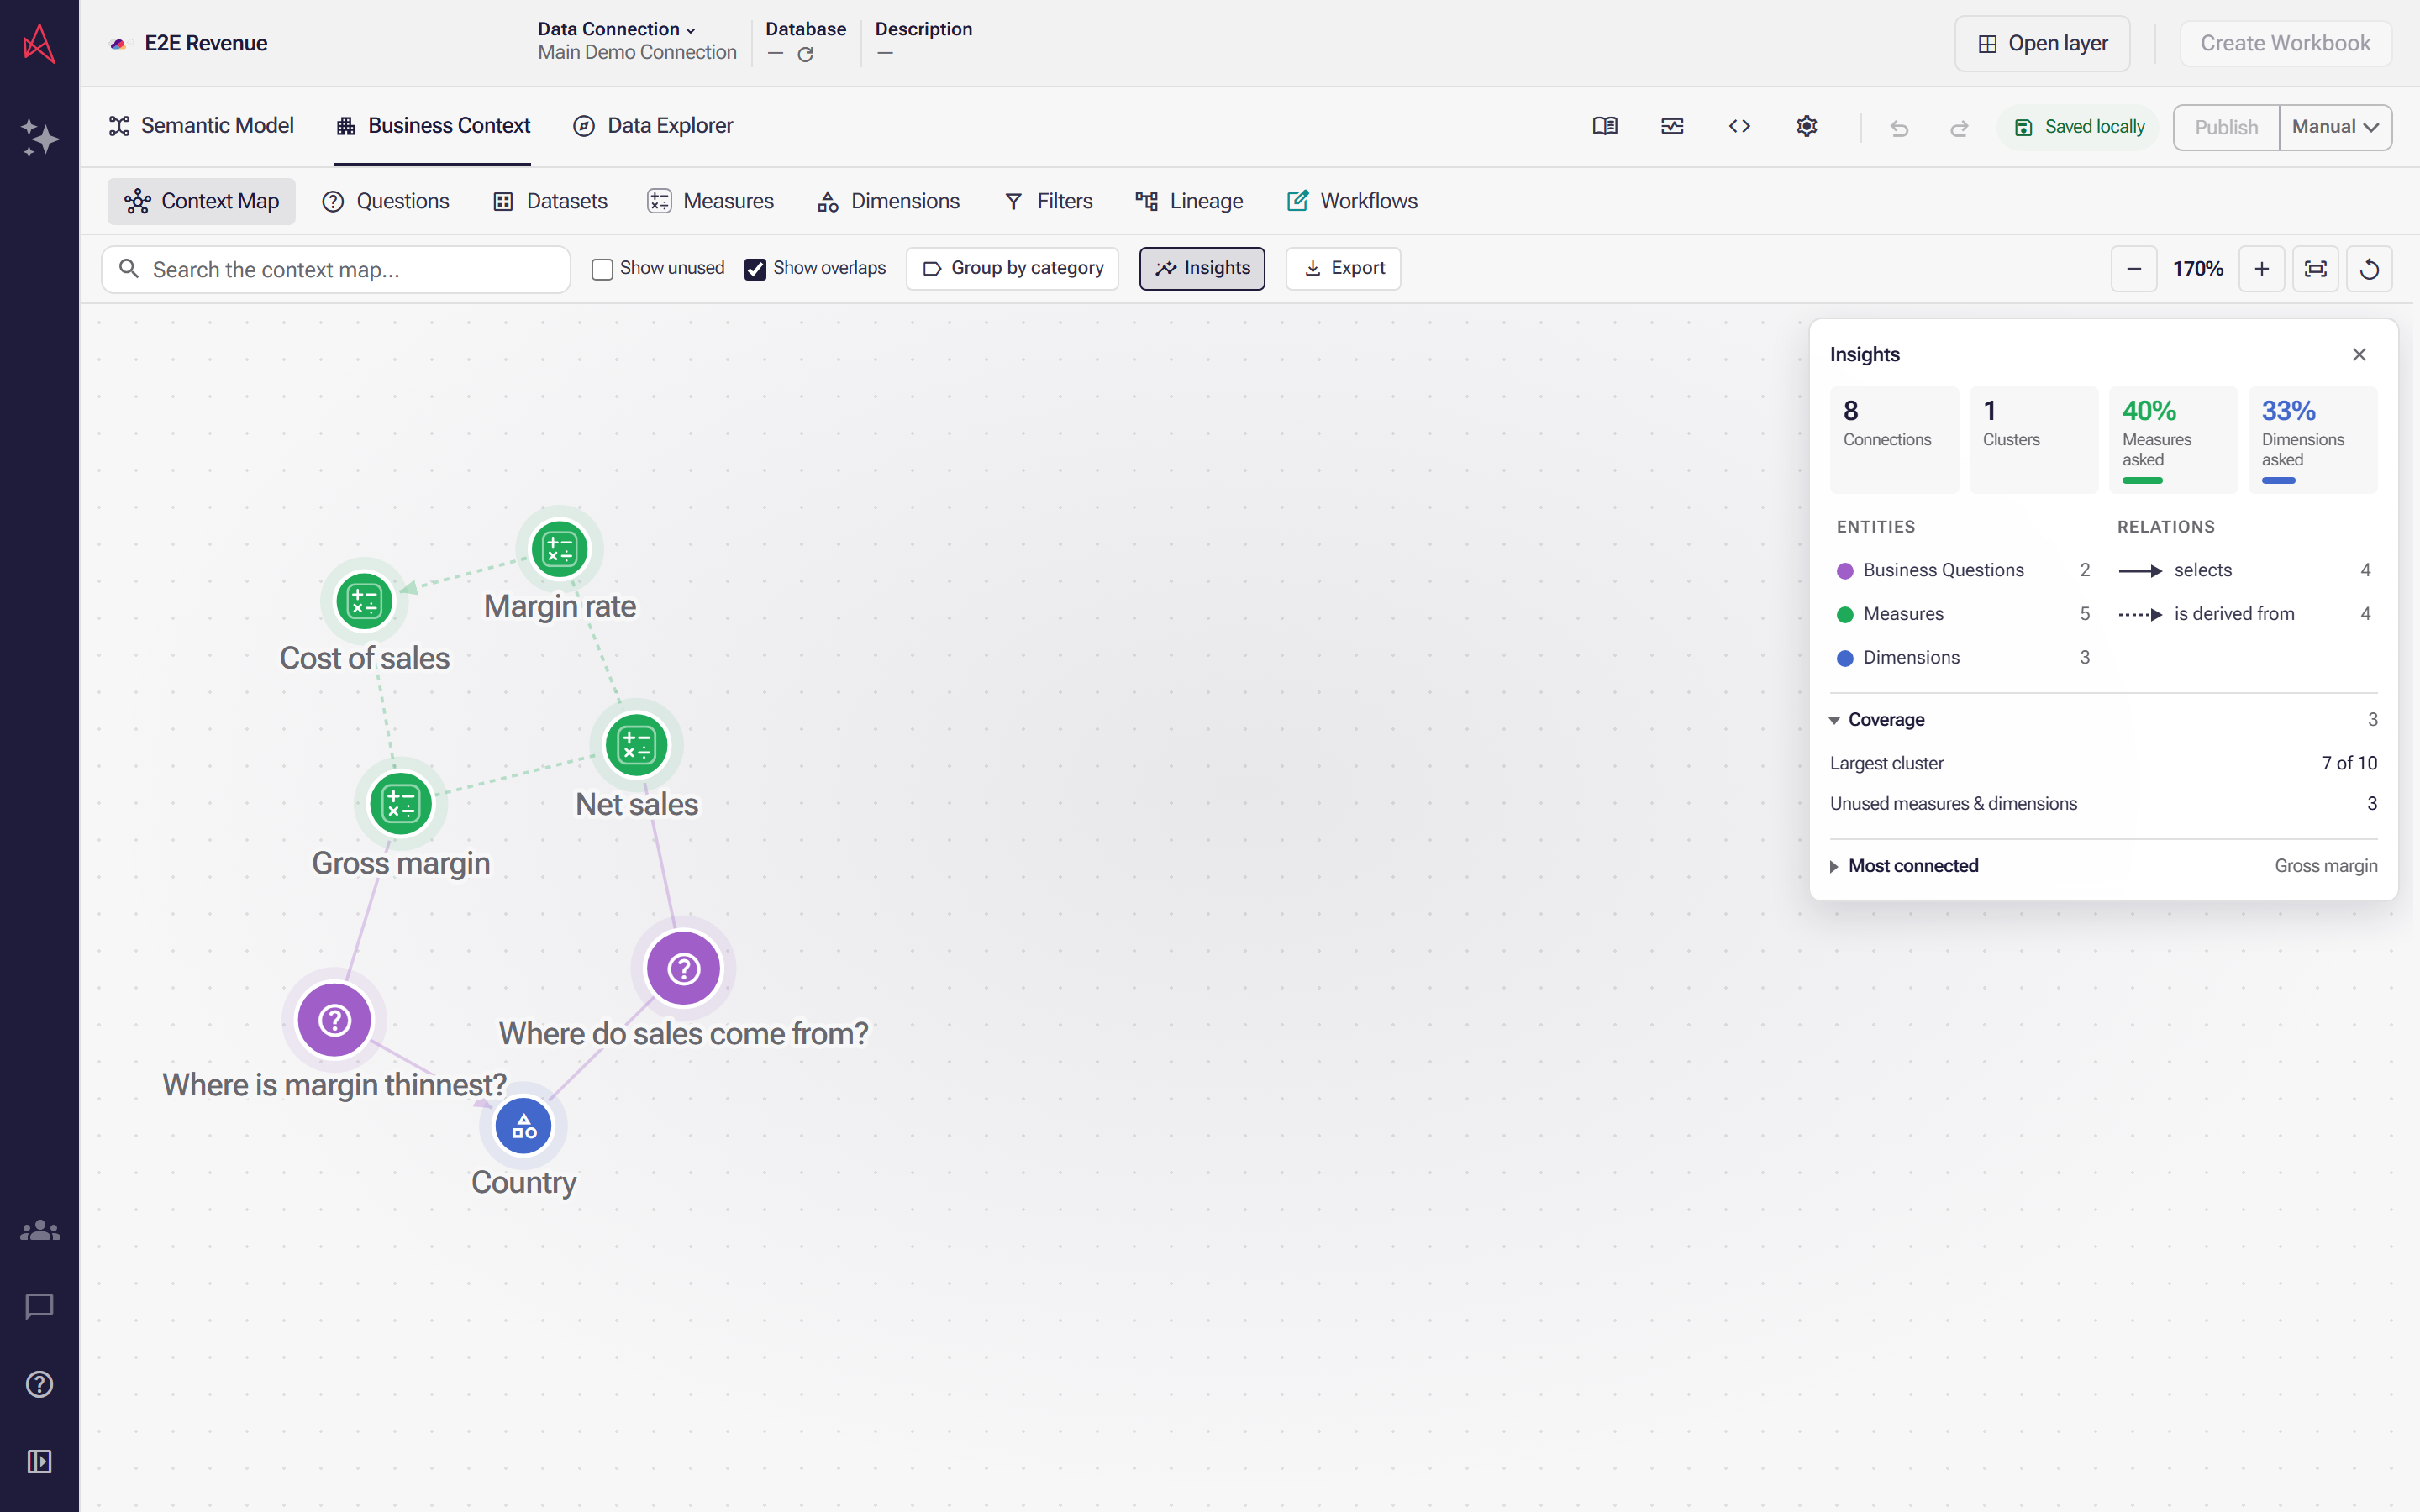
The Context Map draws the layer you are editing: a dot for every question, measure and dimension, and a line wherever one reaches for another. Insights is the card you audit from, and it opens with the map.

Measures asked and Dimensions asked report the share of your definitions at least one business question reaches for: two of five, and one of three. A low figure means you are governing numbers nobody has asked a question of.
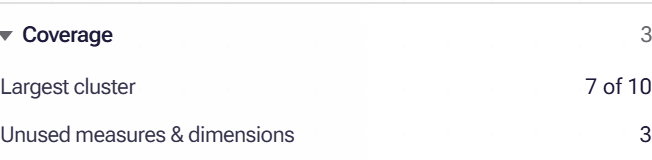
Coverage counts what the picture is missing: three definitions that nothing selects, filters on or derives from. Select the figure to put them on the map rather than reading the lists for them.
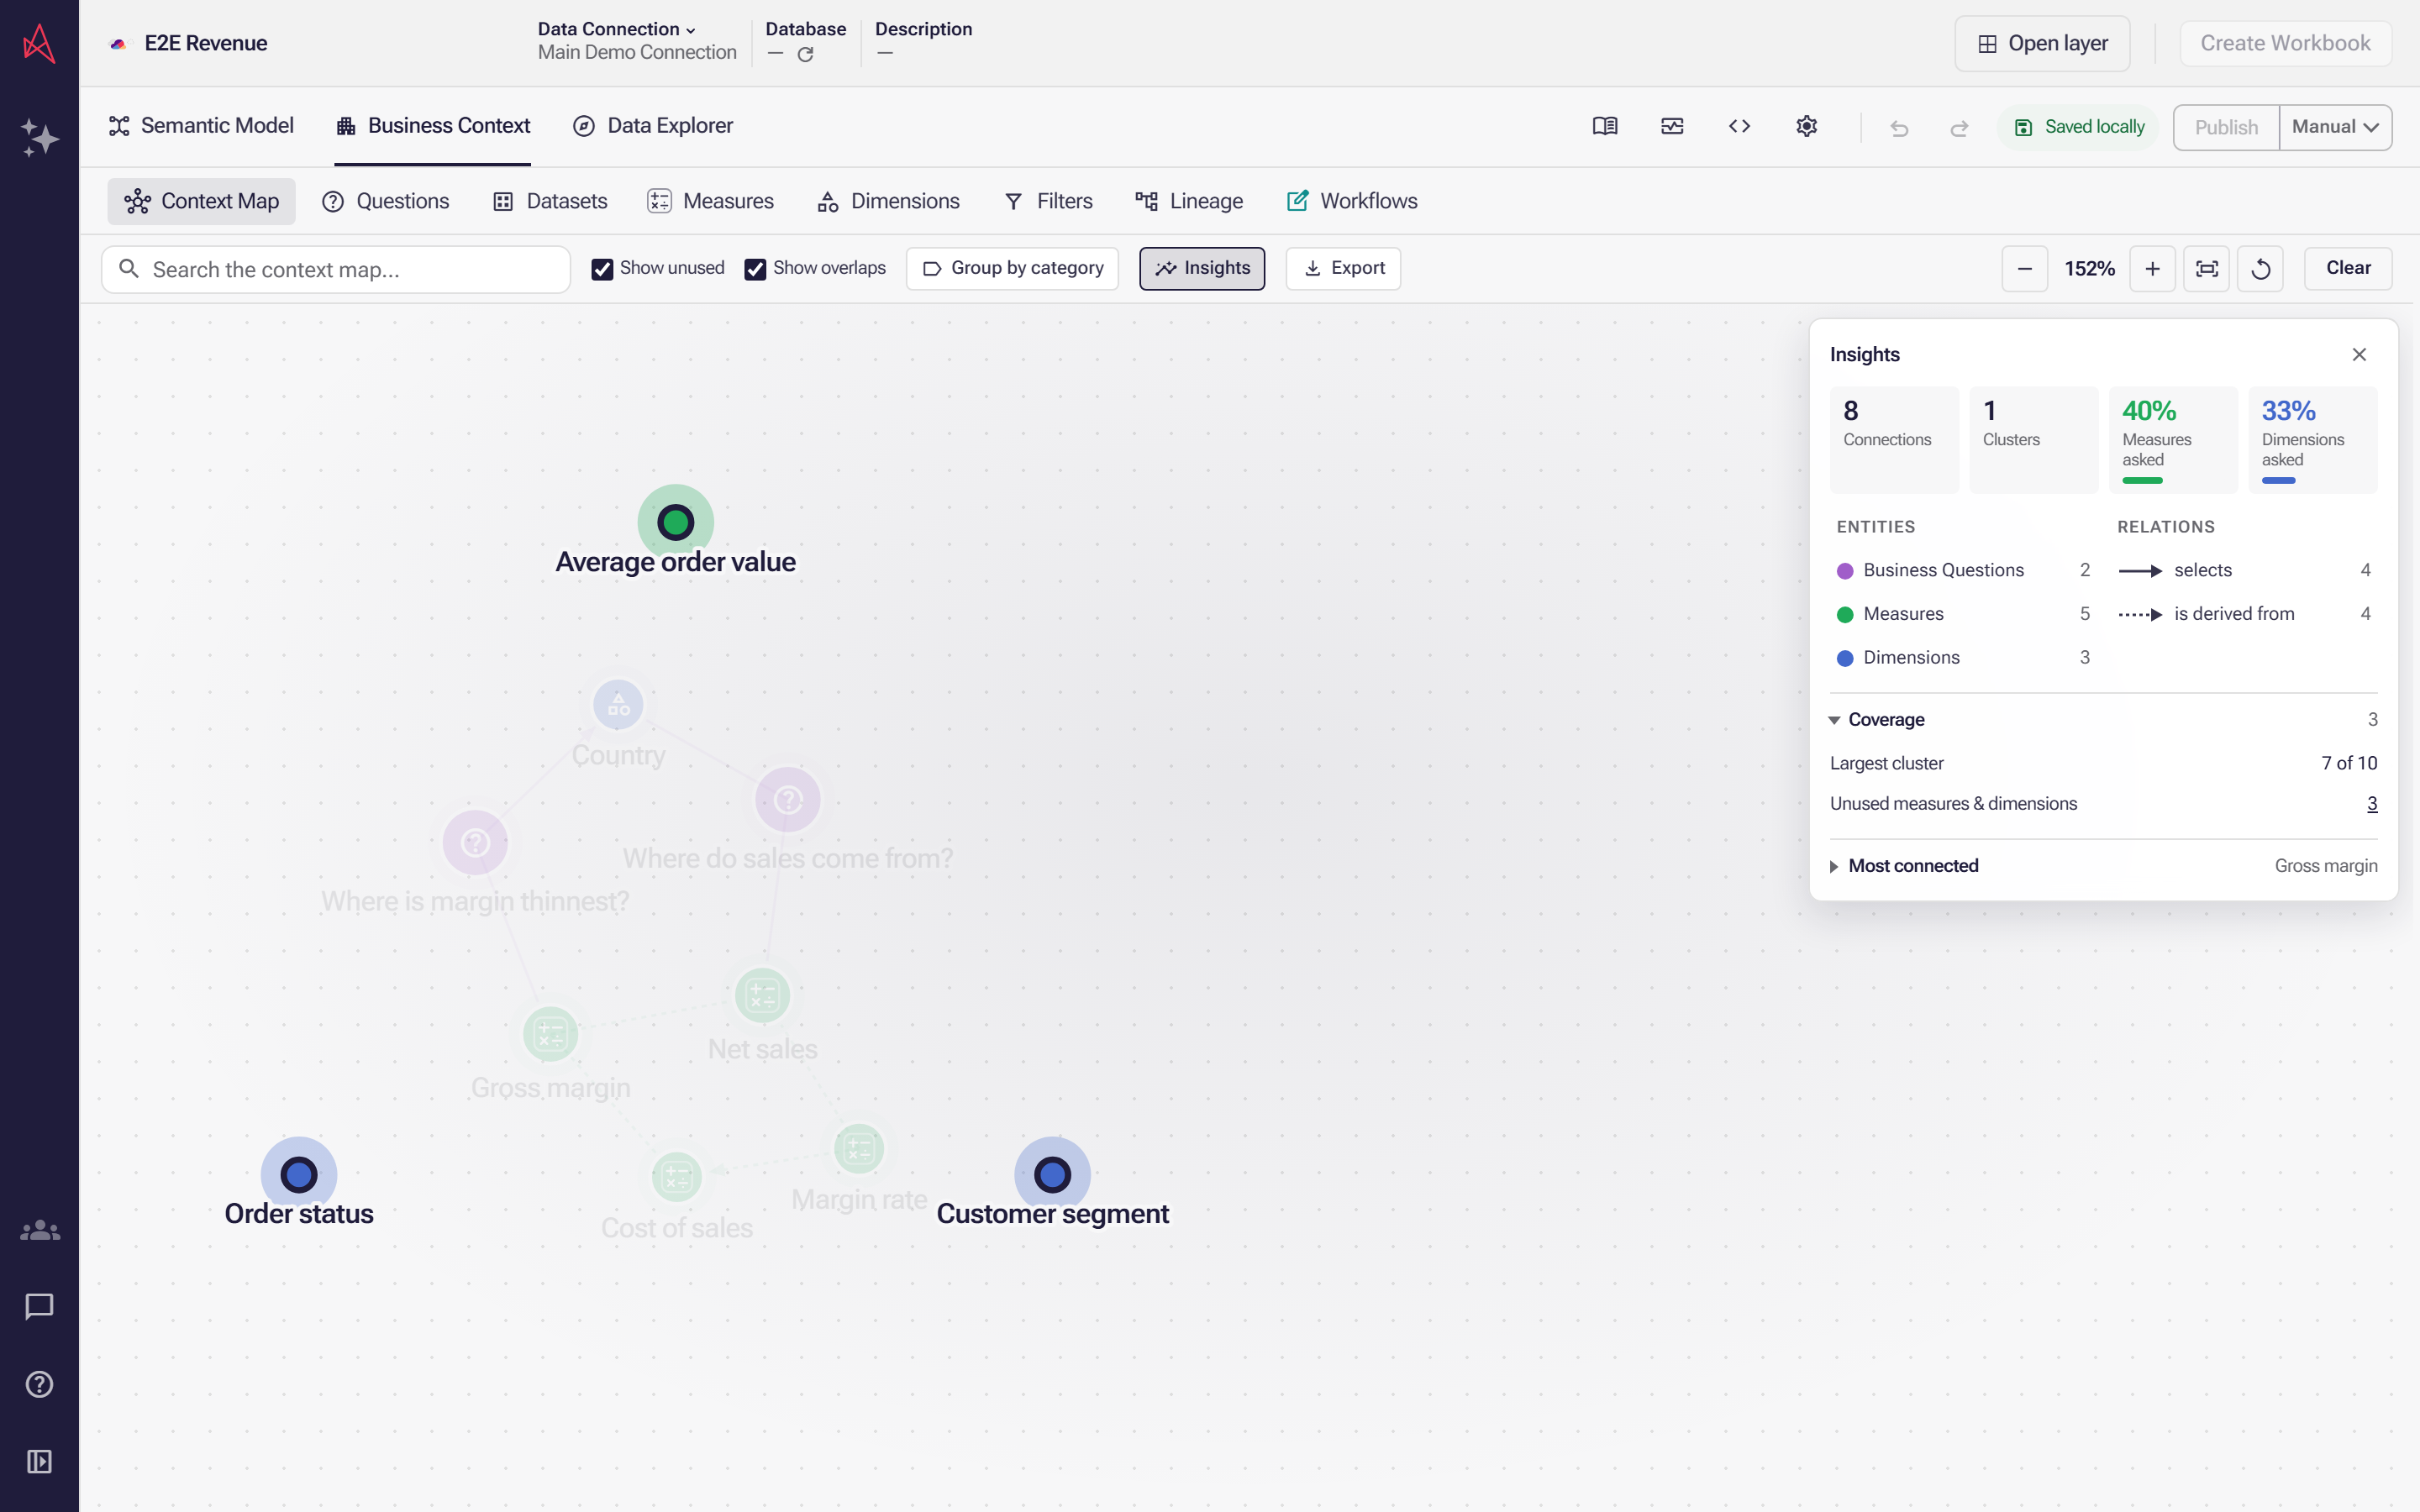
The map turns Show unused on and lights exactly those three, so what nothing reaches for is all that stands out. Cost of sales is not among them: another measure derives from it, which connects it without any question asking for it.
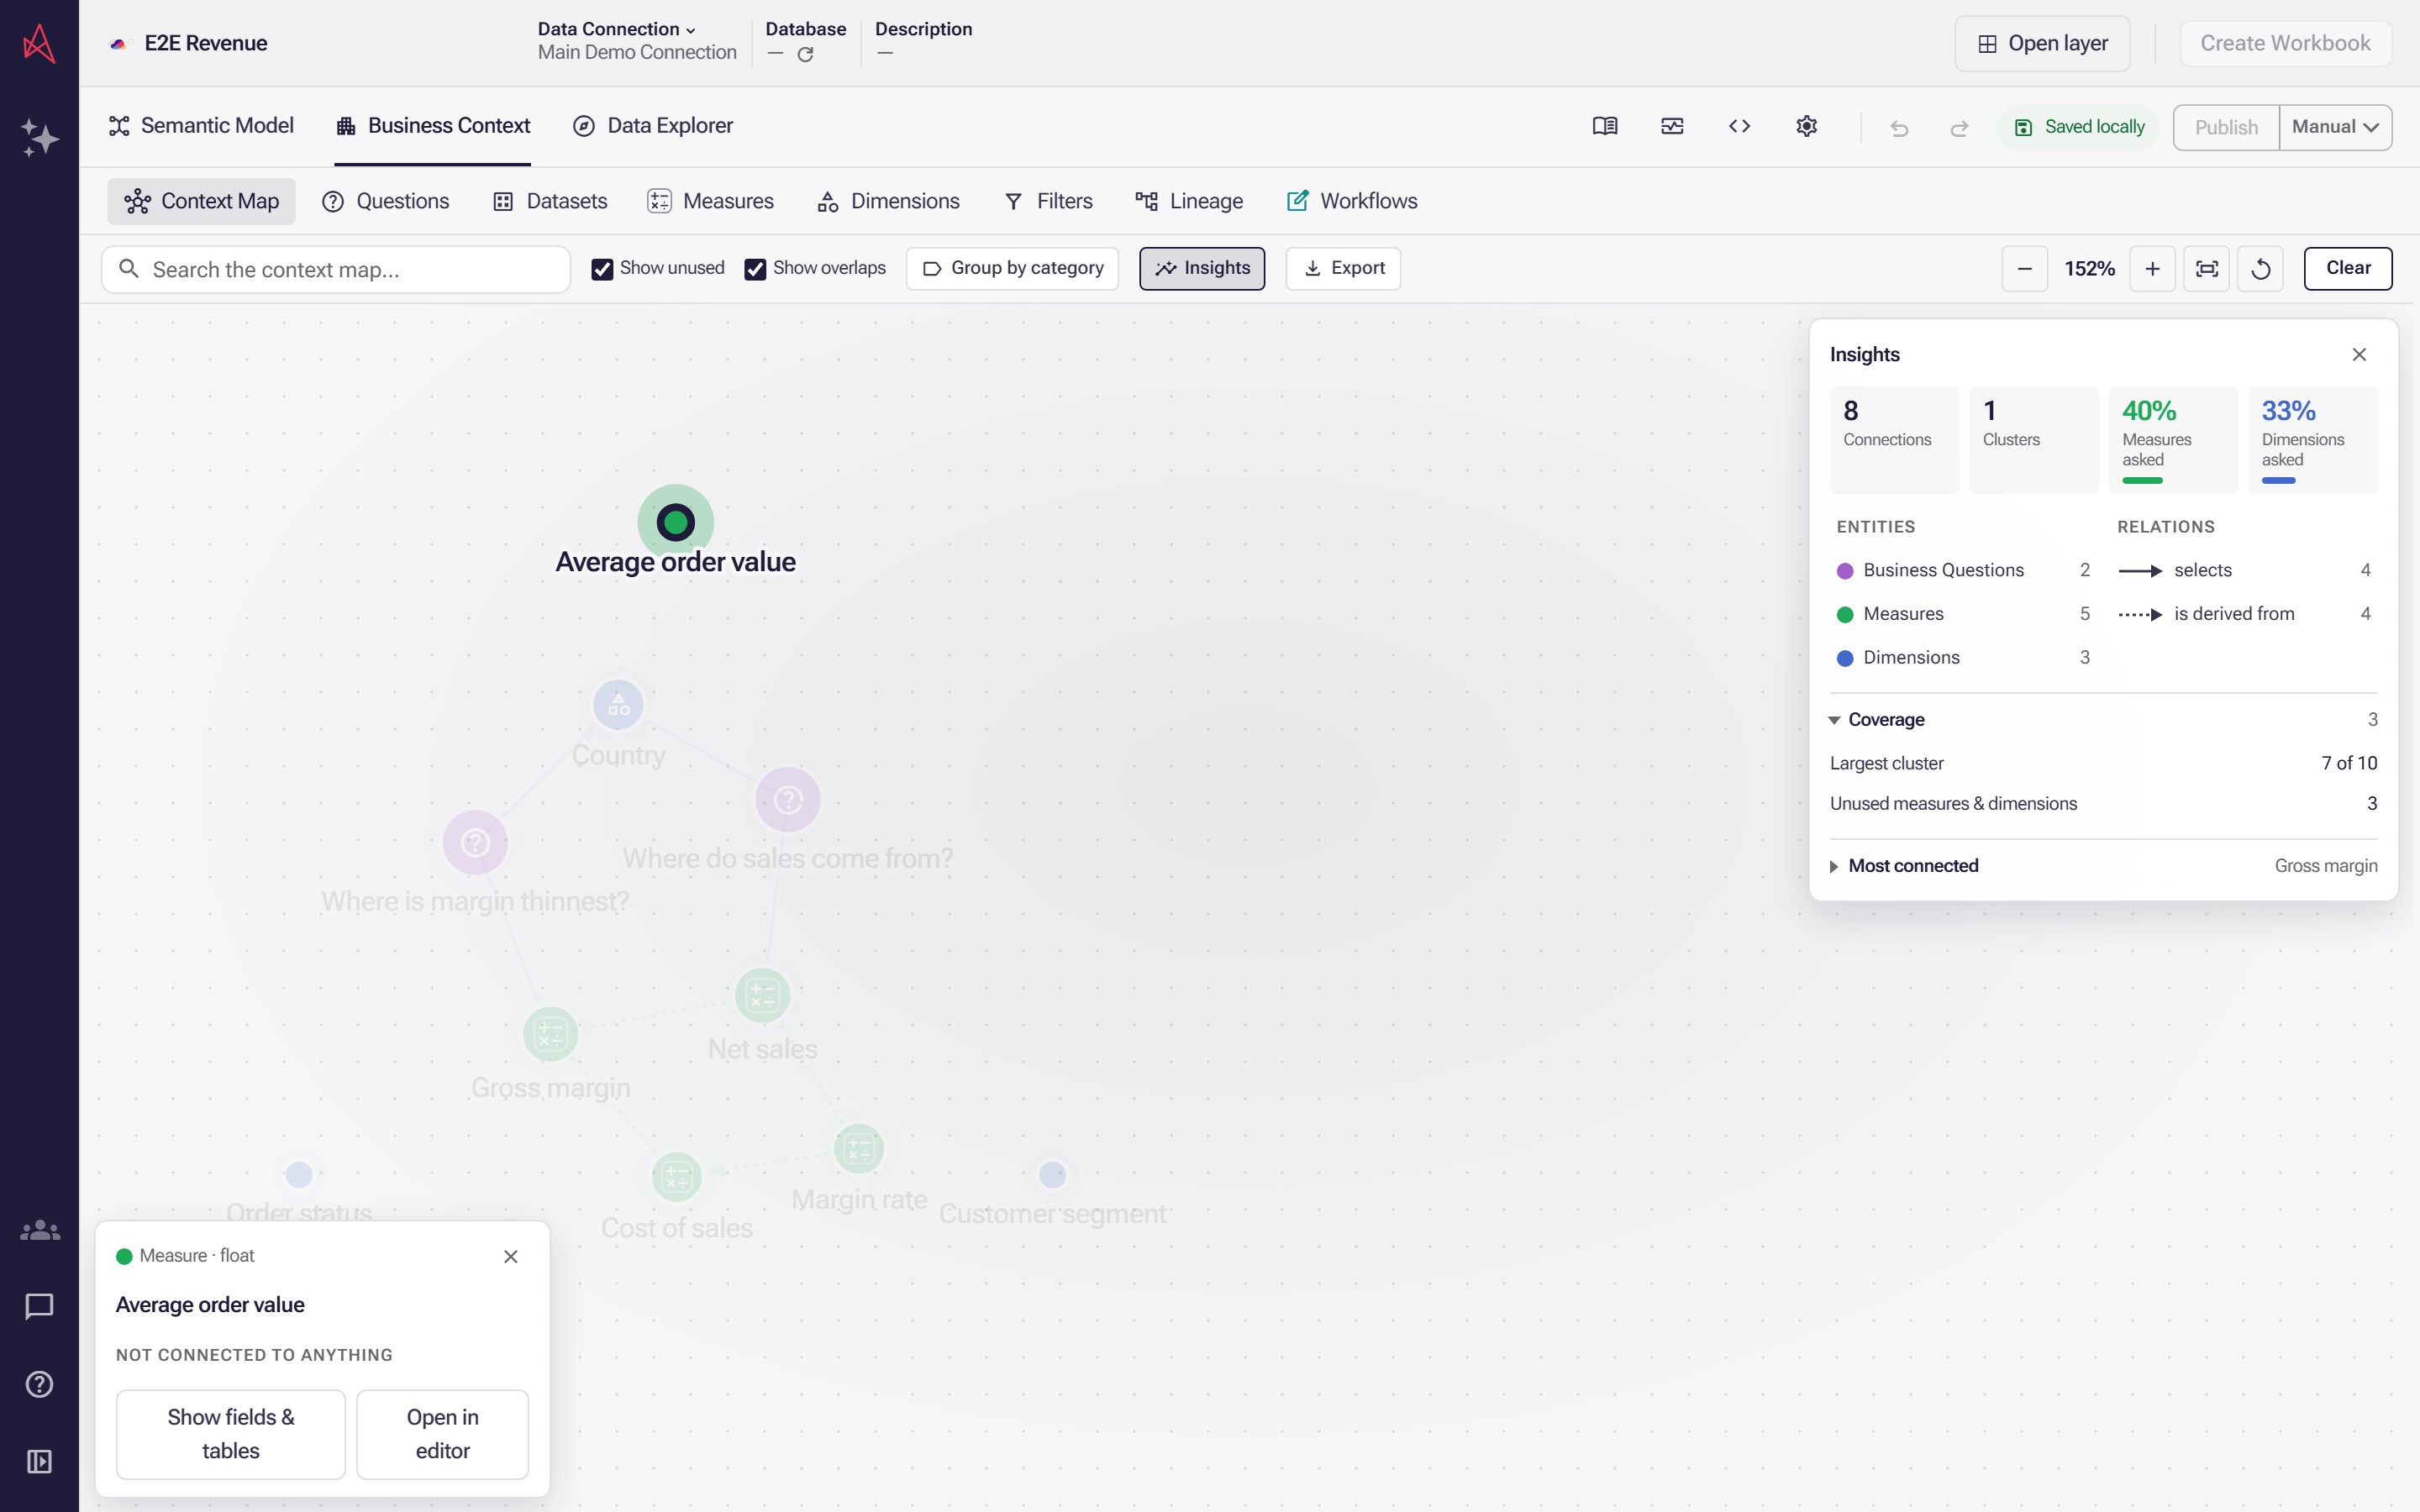
Select one of them for the card that says why it is on your list: not connected to anything. Open in editor goes to the definition, to retire it or to write the question that was missing.
Step 1: Open Insights if the card is not already showing — it starts open.
Step 2: Read Measures asked and Dimensions asked. A low figure means you are governing definitions nobody has written a question for.
Step 3: Under Coverage, select the count beside Unused measures & dimensions. The map turns Show unused on and selects exactly those entities.
Step 4: Work through them with Open in editor: retire each one, or write the question that was missing.
Unused and unasked are not the same thing. A measure another measure derives from is connected, so it never appears under Unused measures & dimensions — but no question need ask for it, and that is what Measures asked counts.
Export the map
Section titled “Export the map”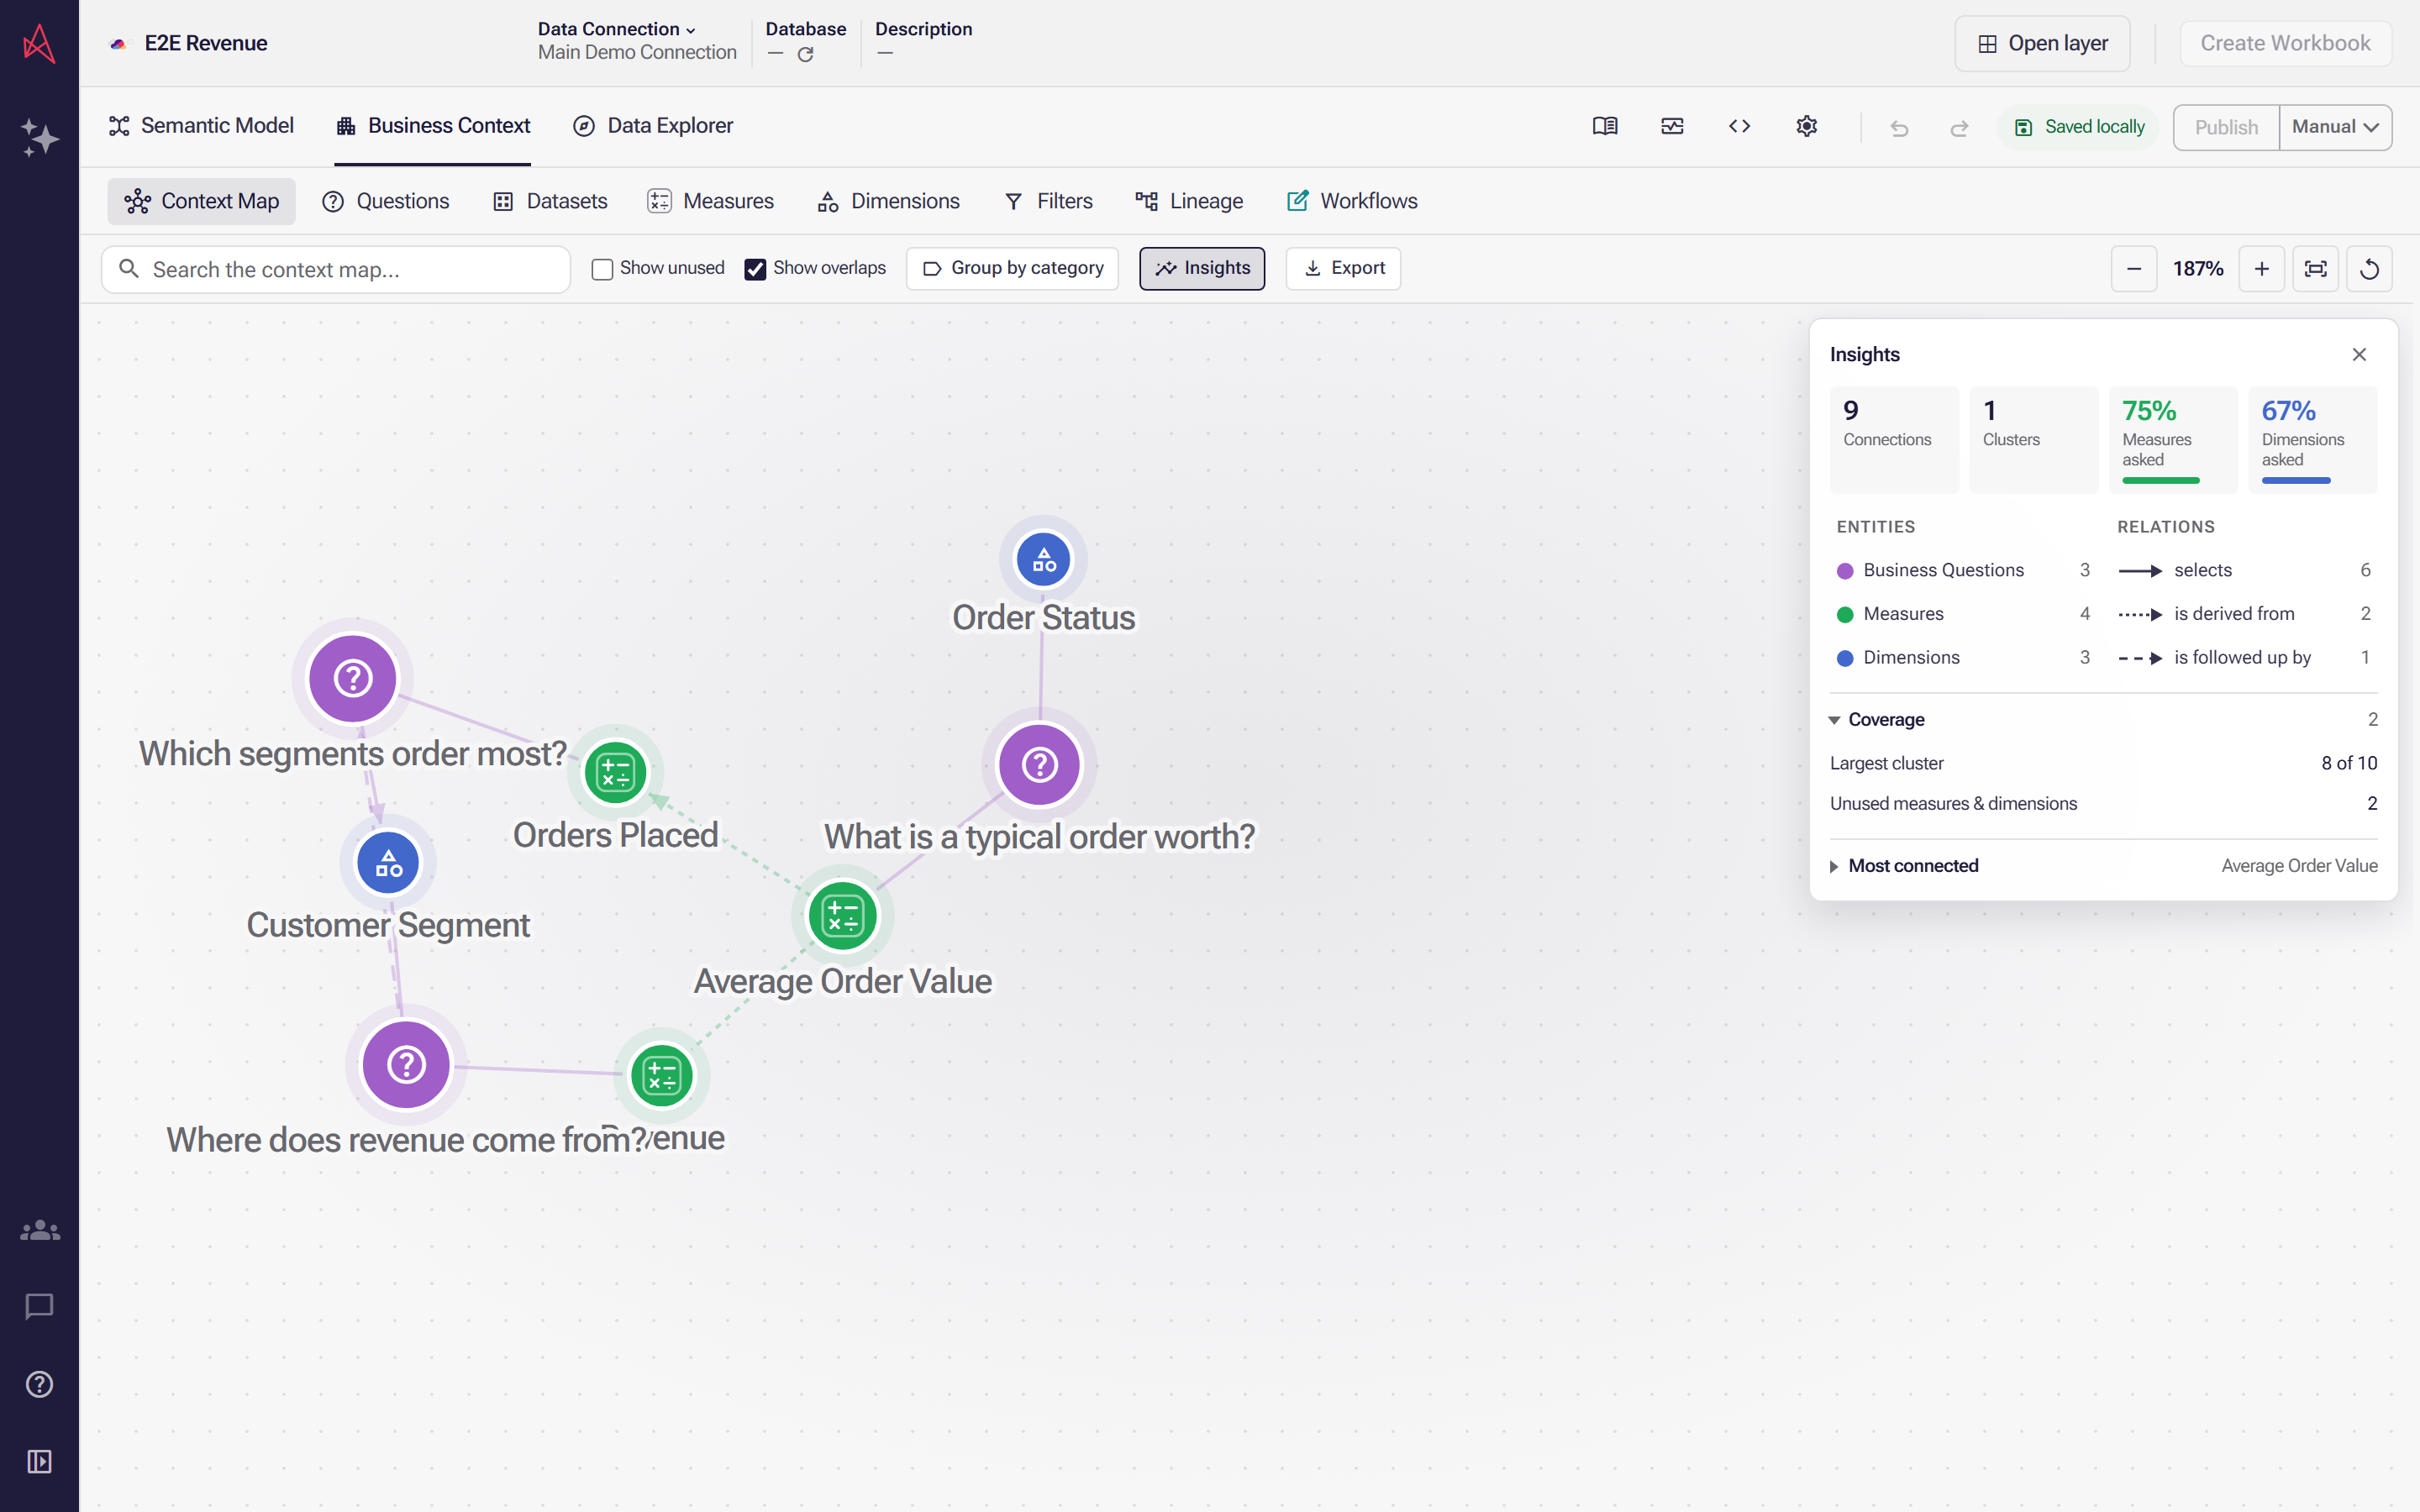
The Context Map draws the whole of your business context: every question, measure and dimension, with a line wherever one reaches for another. Export, at the end of the toolbar, hands you that graph as a file.
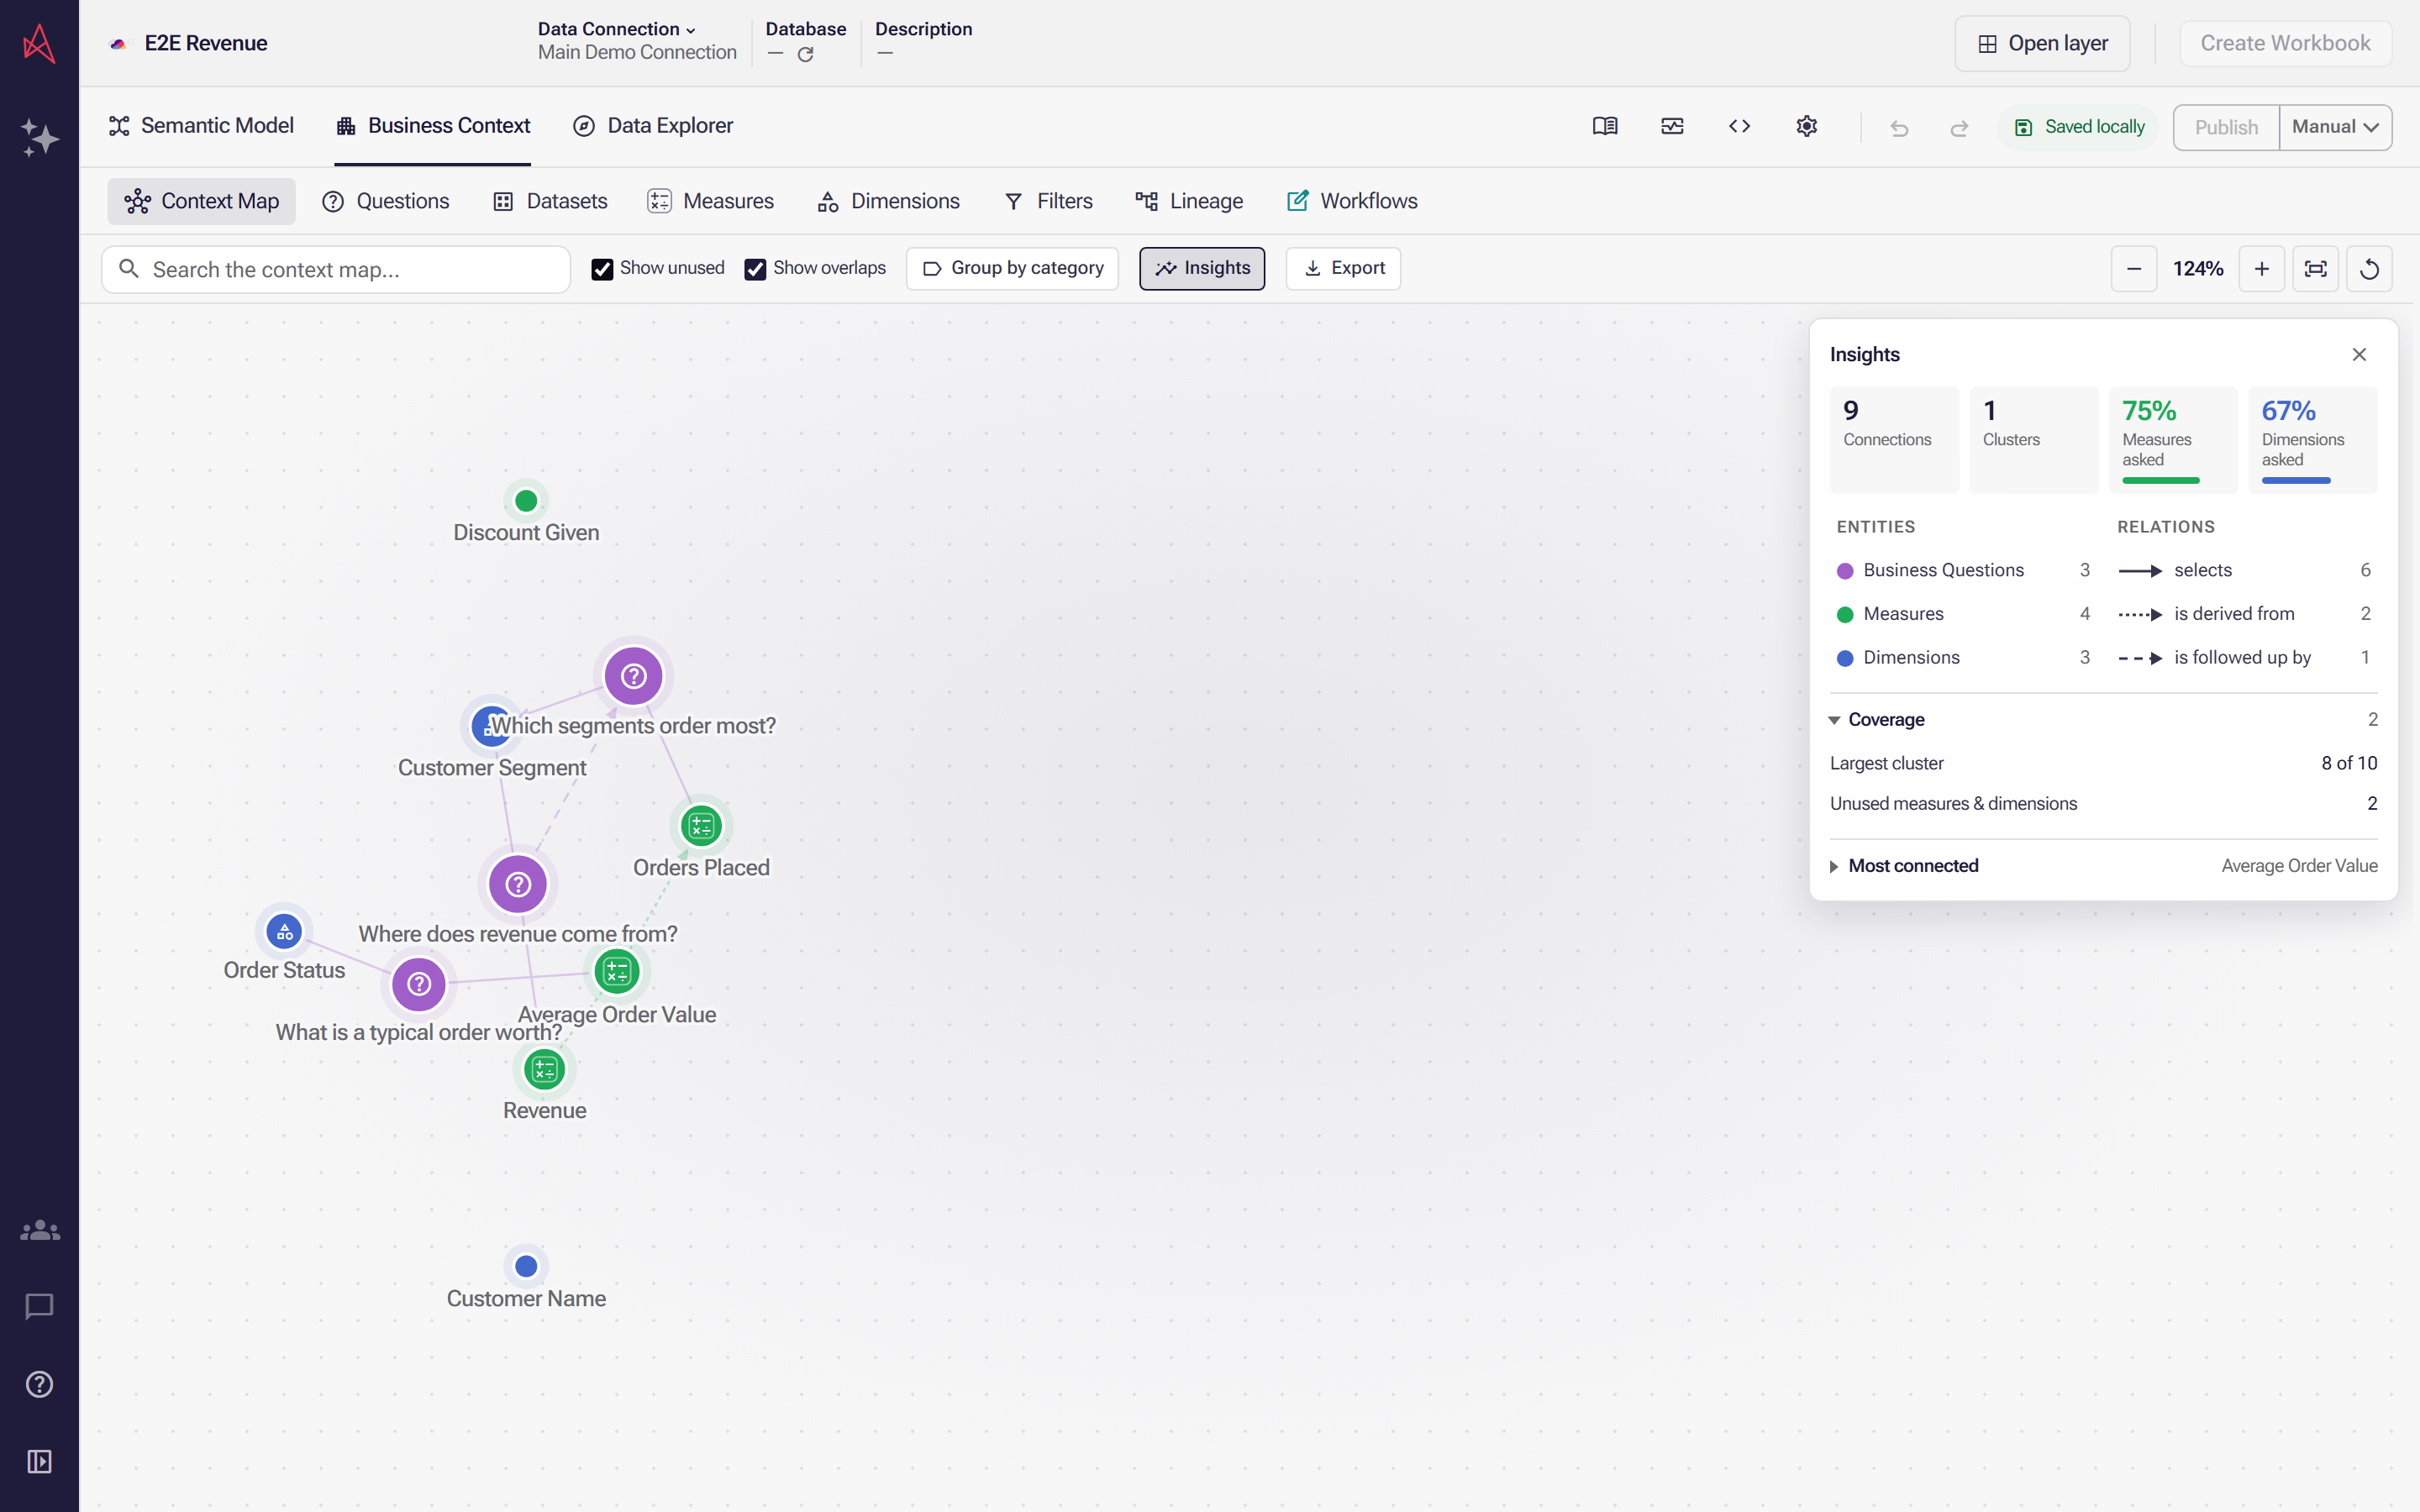
What leaves the editor is what is on screen, so set the picture up first. Show unused brings in the measures and dimensions no question asks about, which the file otherwise leaves out.
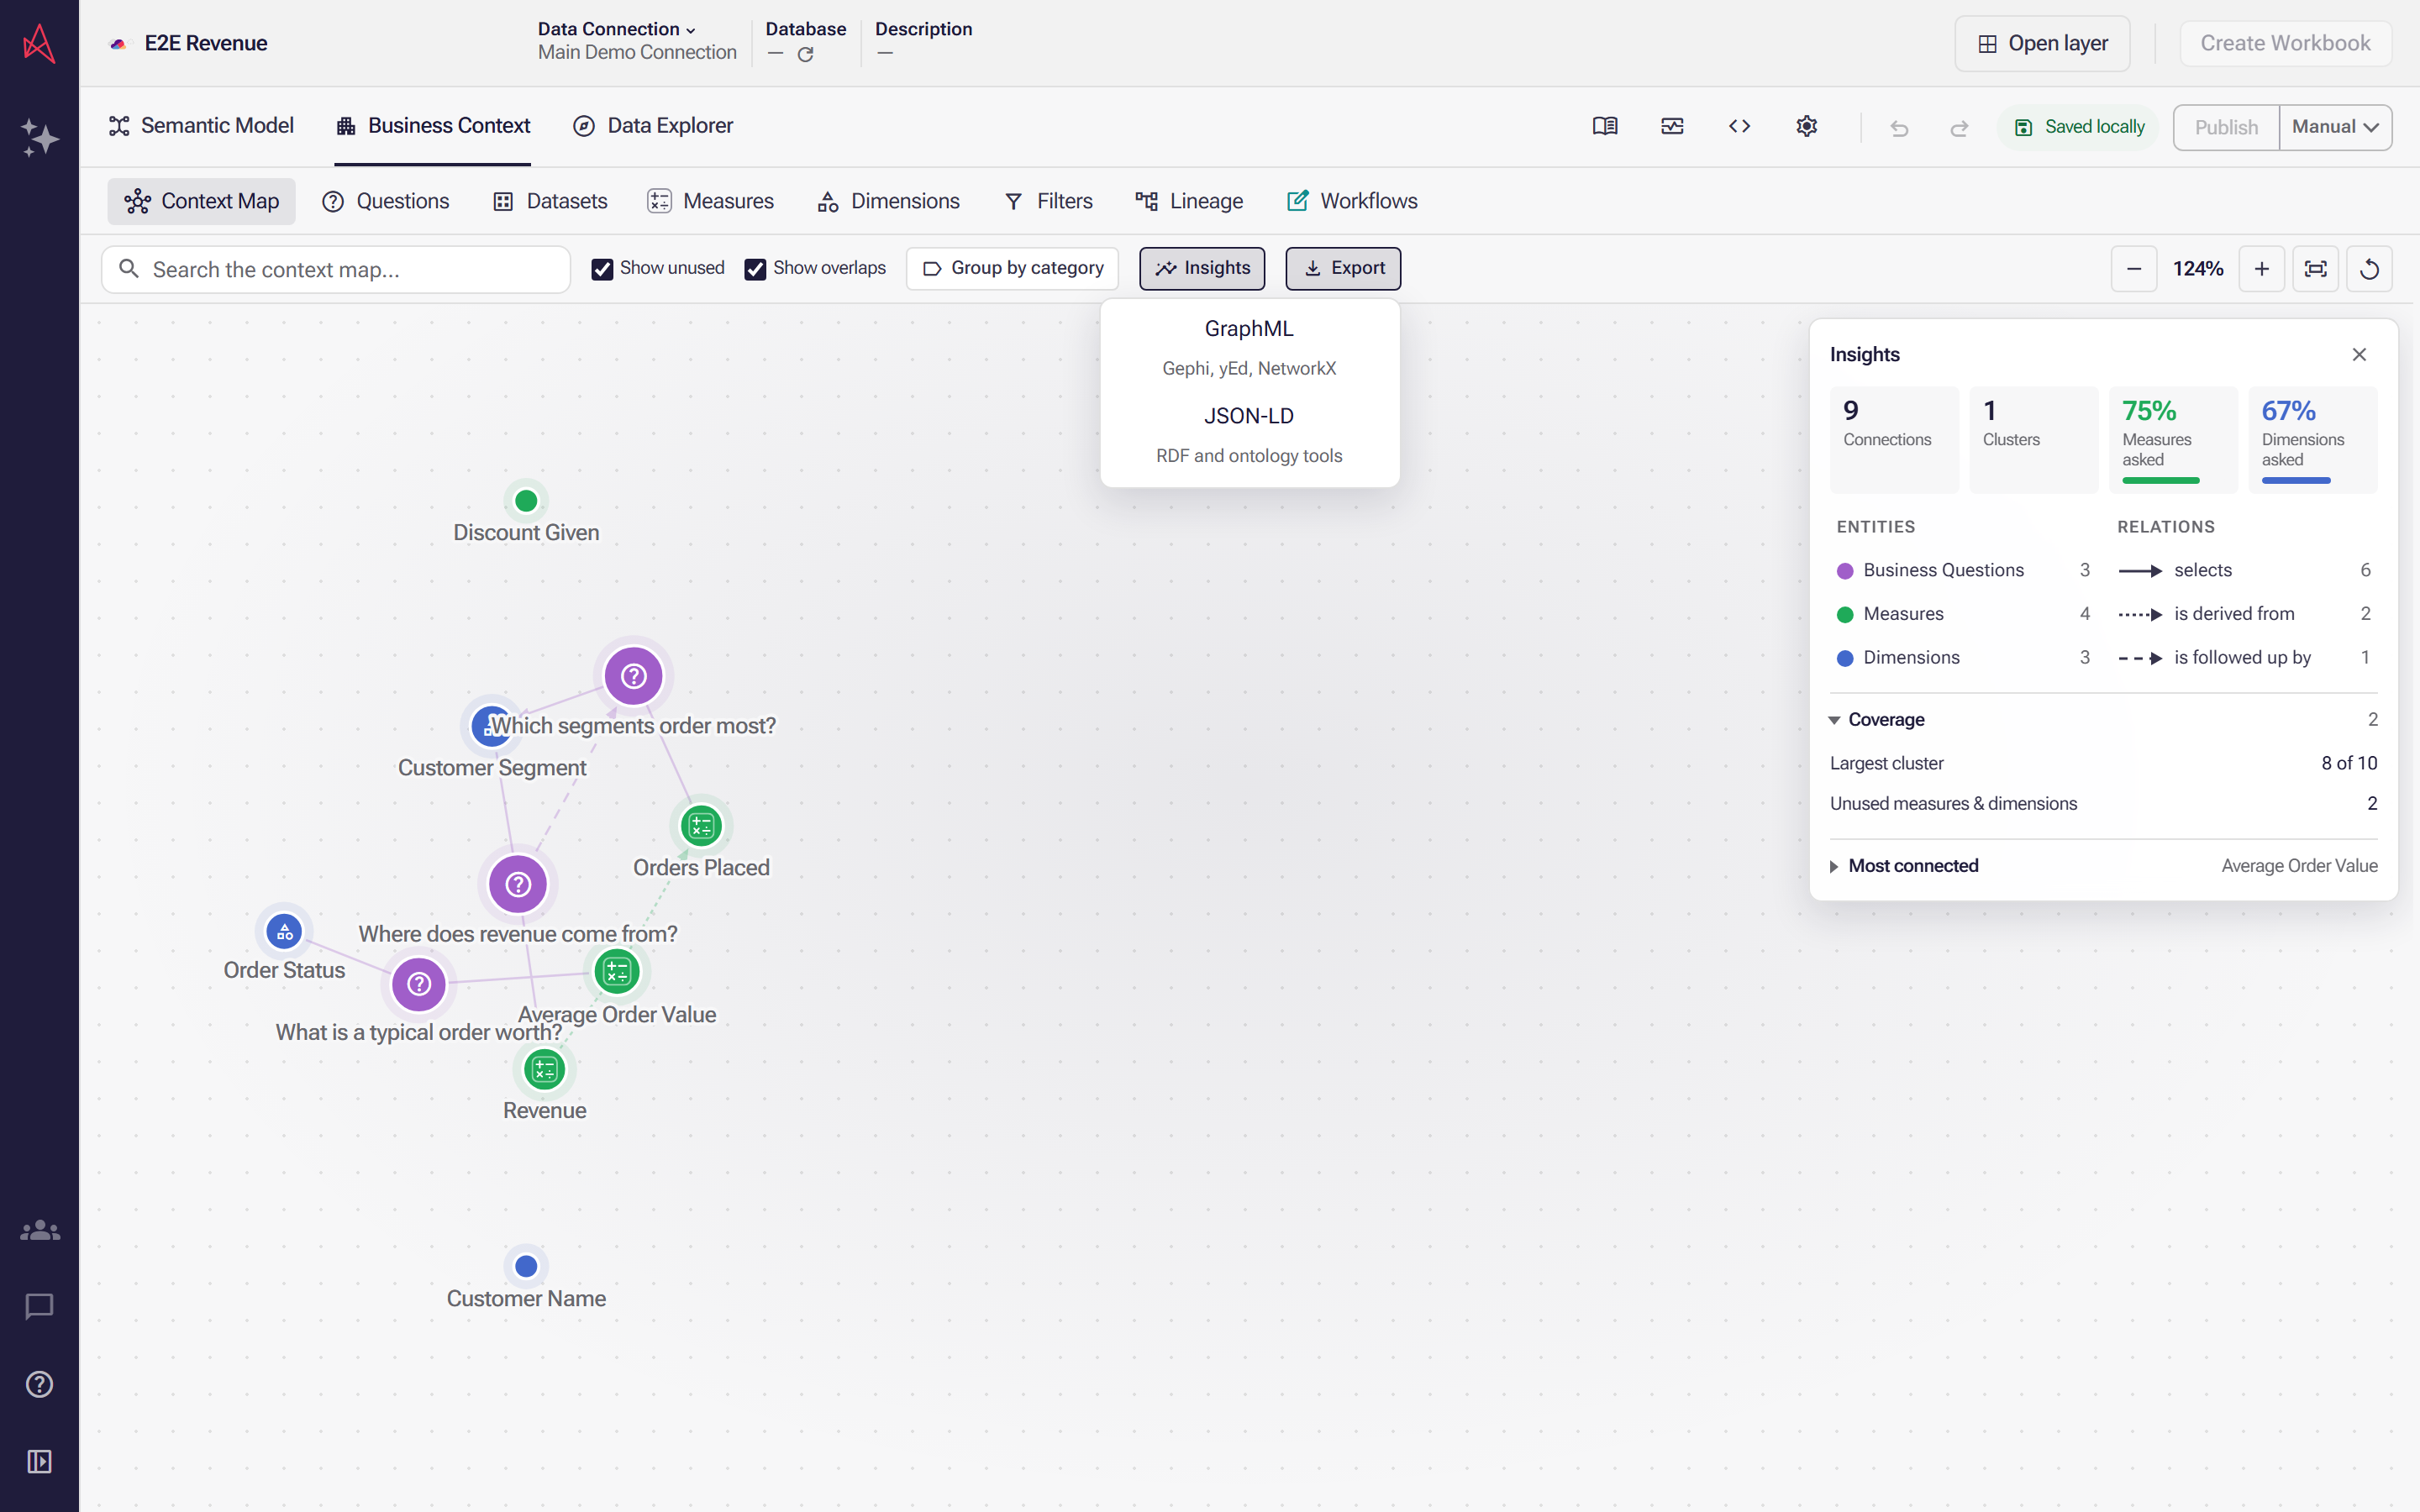
Each format is named for where it is read: GraphML for Gephi, yEd and NetworkX, and JSON-LD for RDF and ontology tools. Both carry the entities and the typed relations themselves rather than a picture of them.
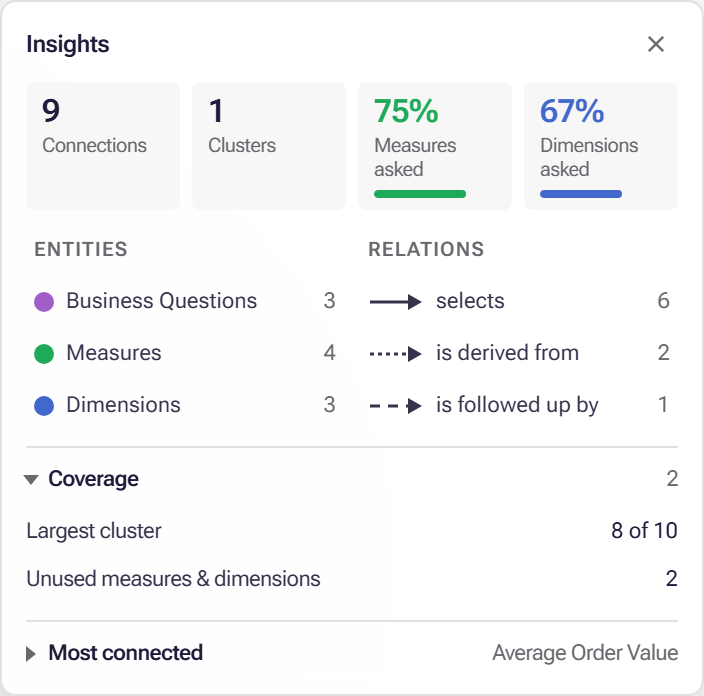
What travels into the file is the model rather than a picture of it: every entity and every typed relation these legends count. Choosing a format saves it straight away, named after your semantic layer, and nothing on the map itself changes.
Step 1: Select Export.
Step 2: Choose GraphML, for Gephi, yEd and NetworkX, or JSON-LD, for RDF and ontology tools.
The file is named after the semantic layer, with -context-map and the format’s extension on the end. Both carry the same entities and typed, directed relations the canvas draws, each with its kind, name, categories and connection count — the model rather than a picture of it.
The file is what is on screen. A hidden entity kind, a hidden relation and — with Show unused off — the unused measures and dimensions all stay out of the export. Set the picture up the way you want it read before you export it.
Next: Define a measure in Business Context, or the Business questions guide for the questions that ask for them.