

Getting Started with Astrato & Supabase
This guide walks through connecting Supabase to Astrato and building a dashboard from scratch using live query.
By the end of this guide, you’ll be able to produce an interactive dashboard that delivers a self-serve analytics experience.
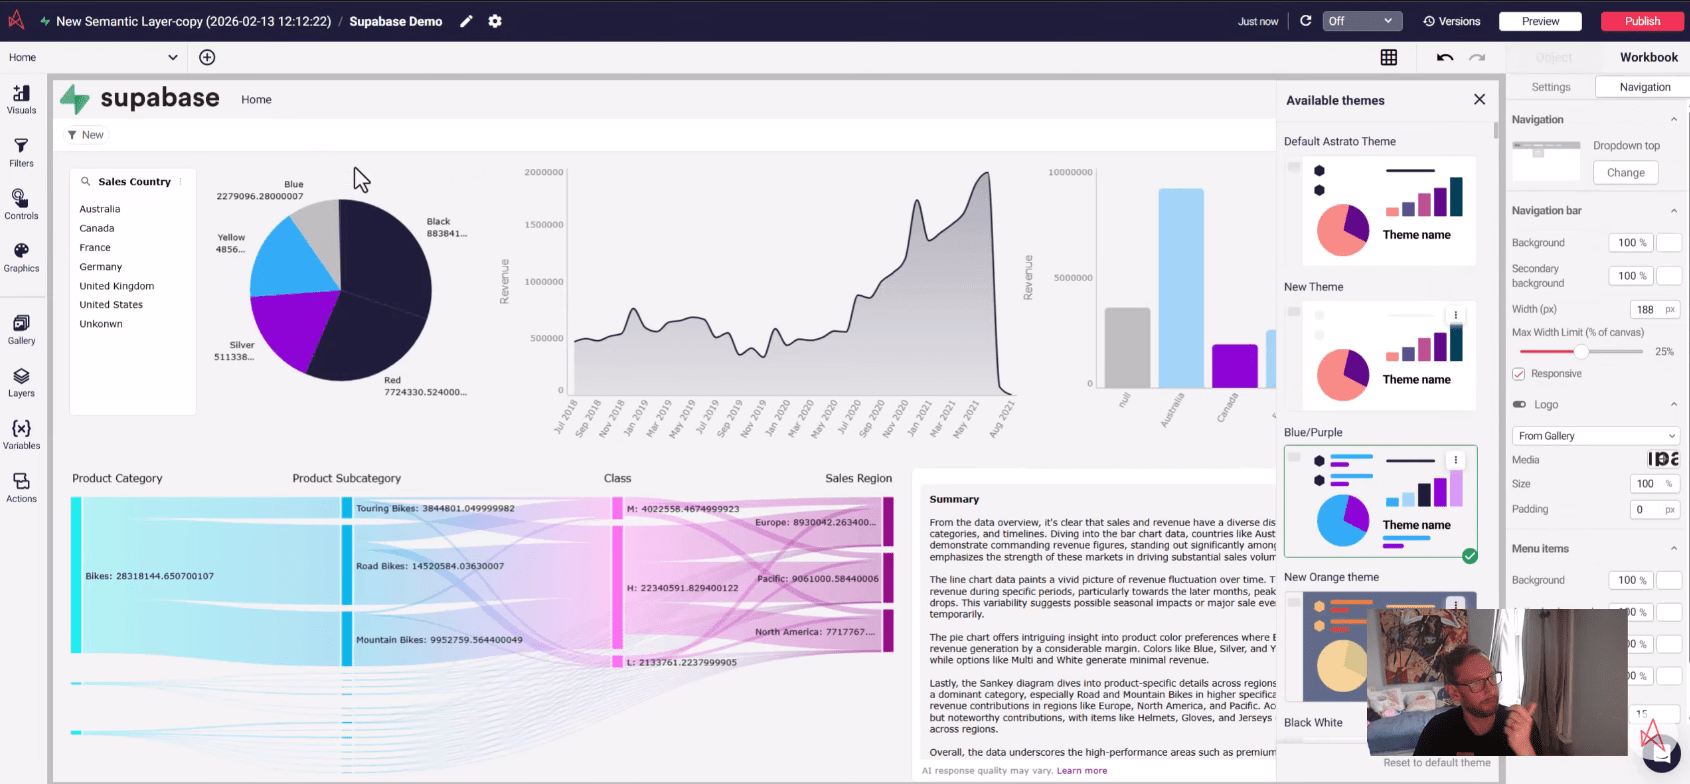
1. Prerequisites
Section titled “1. Prerequisites”Before starting, make sure you have:
-
An Astrato account
-
A Supabase project
-
A database with accessible tables (example used:
bike_sales)
2. Identify the Data You Want to Analyse
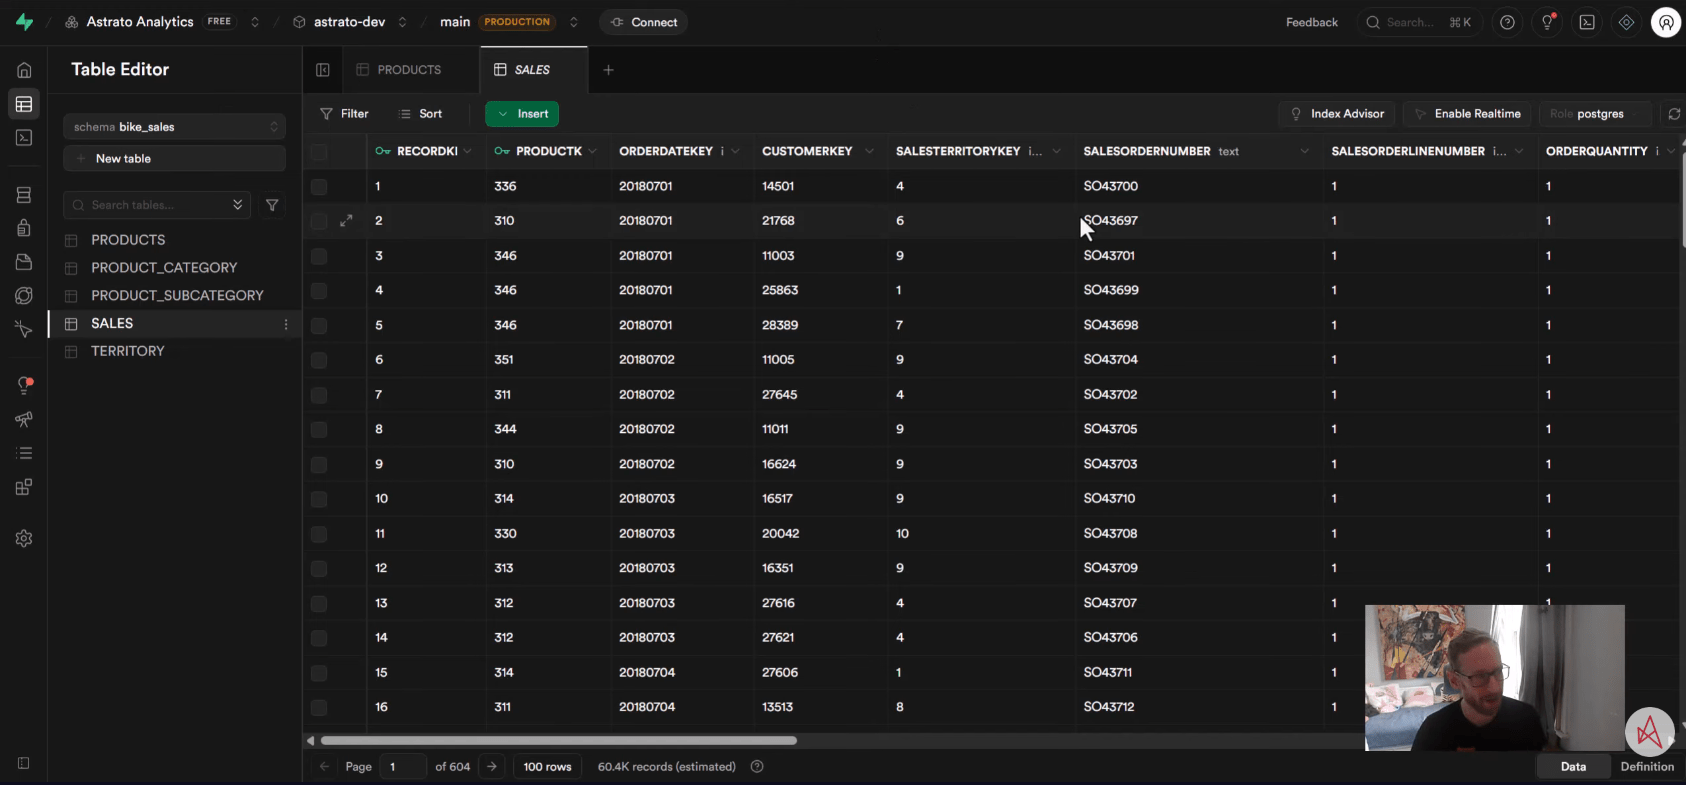
Section titled “2. Identify the Data You Want to Analyse”In Supabase:
-
Open your project
-
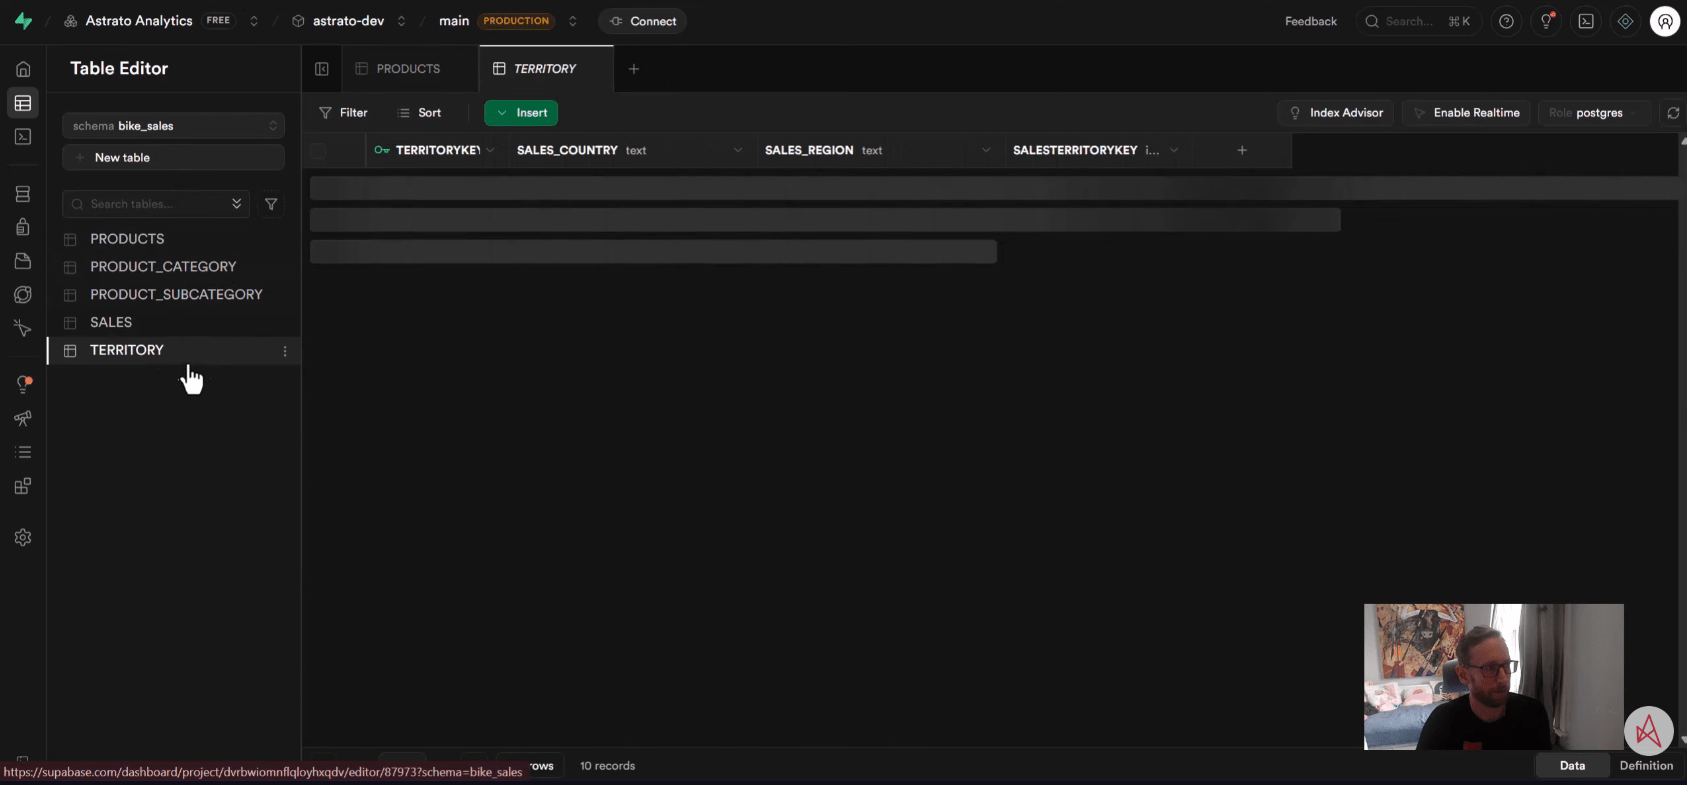
Locate the schema and tables you want to use
-
Confirm the dataset structure
This tutorial uses a simple sales dataset to build the first dashboard.
3. Create a New Data Source in Astrato
Section titled “3. Create a New Data Source in Astrato”In Astrato:
-
Go to Data Sources
-
Click New Data Source
-
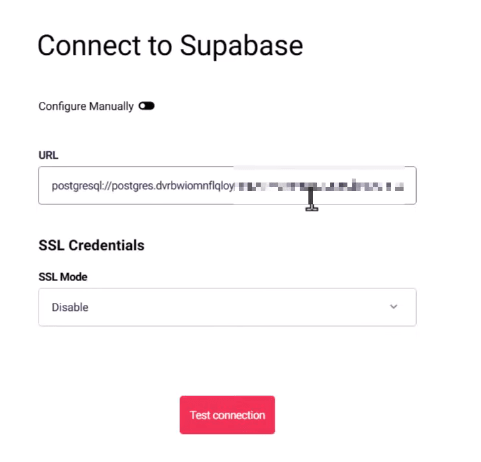
Choose PostgreSQL / Supabase
-
Enter:
-
Host
-
Database
-
Username
-
Password
-
Port
-
SSL mode (if required)
-
4. Test & Save the Connection
Section titled “4. Test & Save the Connection”-
Click Test connection
-
Save when successful
This establishes the live query link between Astrato and Supabase.
5. Create a Semantic Layer
Section titled “5. Create a Semantic Layer”After connecting:
-
Select the tables
-
Define:
-
Measures
-
Dimensions
-
Relationships (if multiple tables)
-
This step prepares the data for self-service analytics.
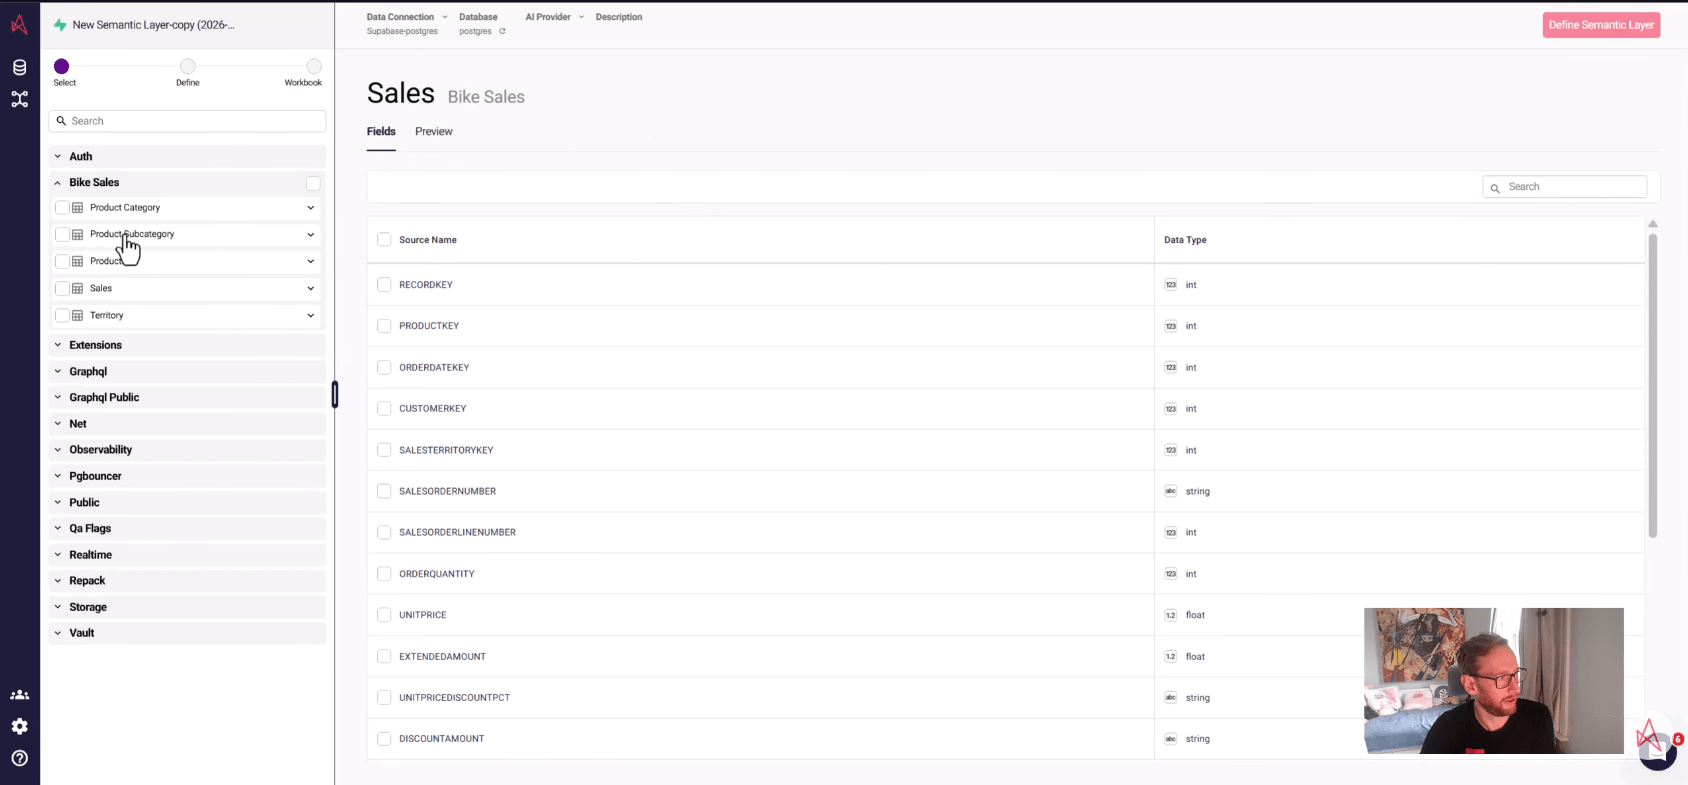
6. Build a Workbook
Section titled “6. Build a Workbook”-
Create a New Workbook
-
Add charts and KPIs
-
Use the semantic layer fields
The example builds a fully interactive dashboard from zero.
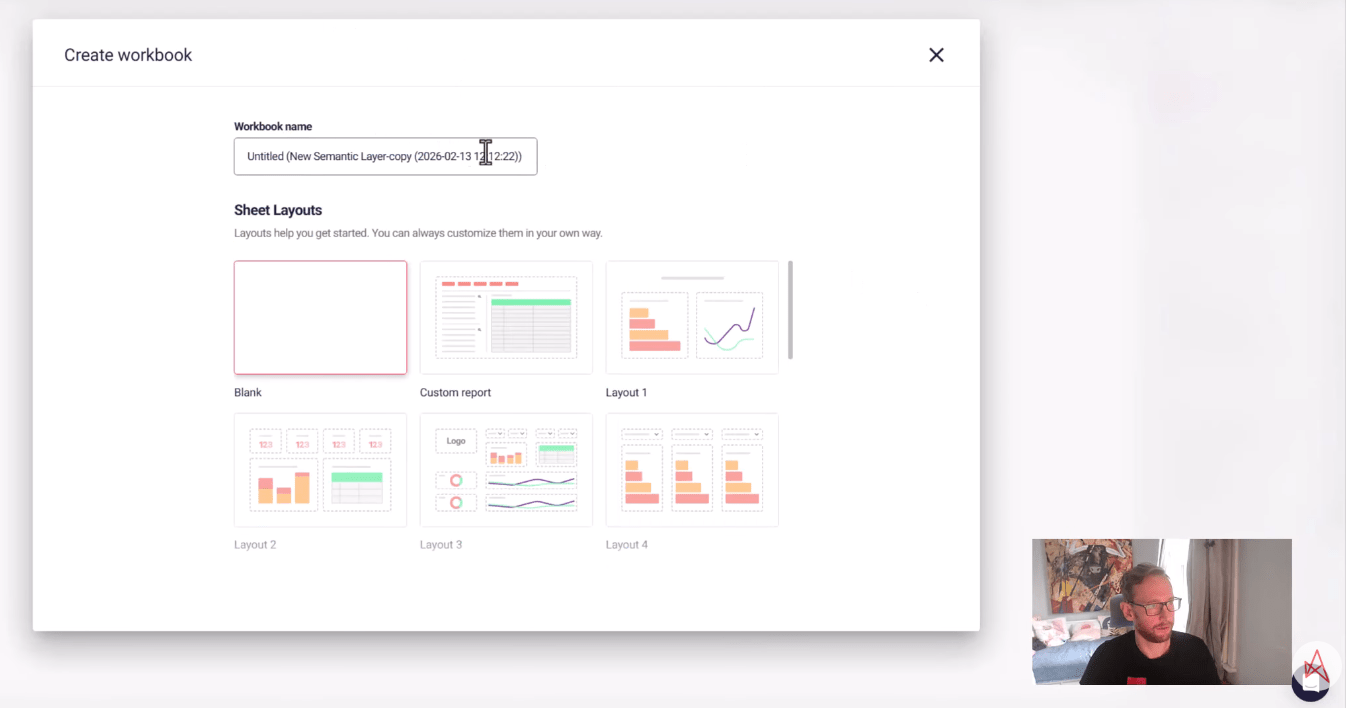
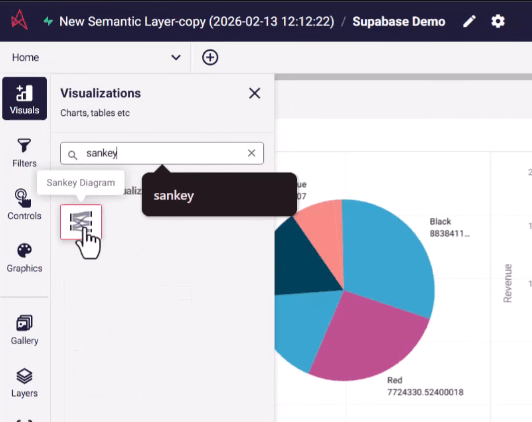
7. Add Visualisations
Section titled “7. Add Visualisations”Typical first visuals:
-
KPI cards
-
Time-series chart
-
Breakdown by category
All queries run live on Supabase.
For extra value, why not add the Custom Report to enable self-serve analytics for users.
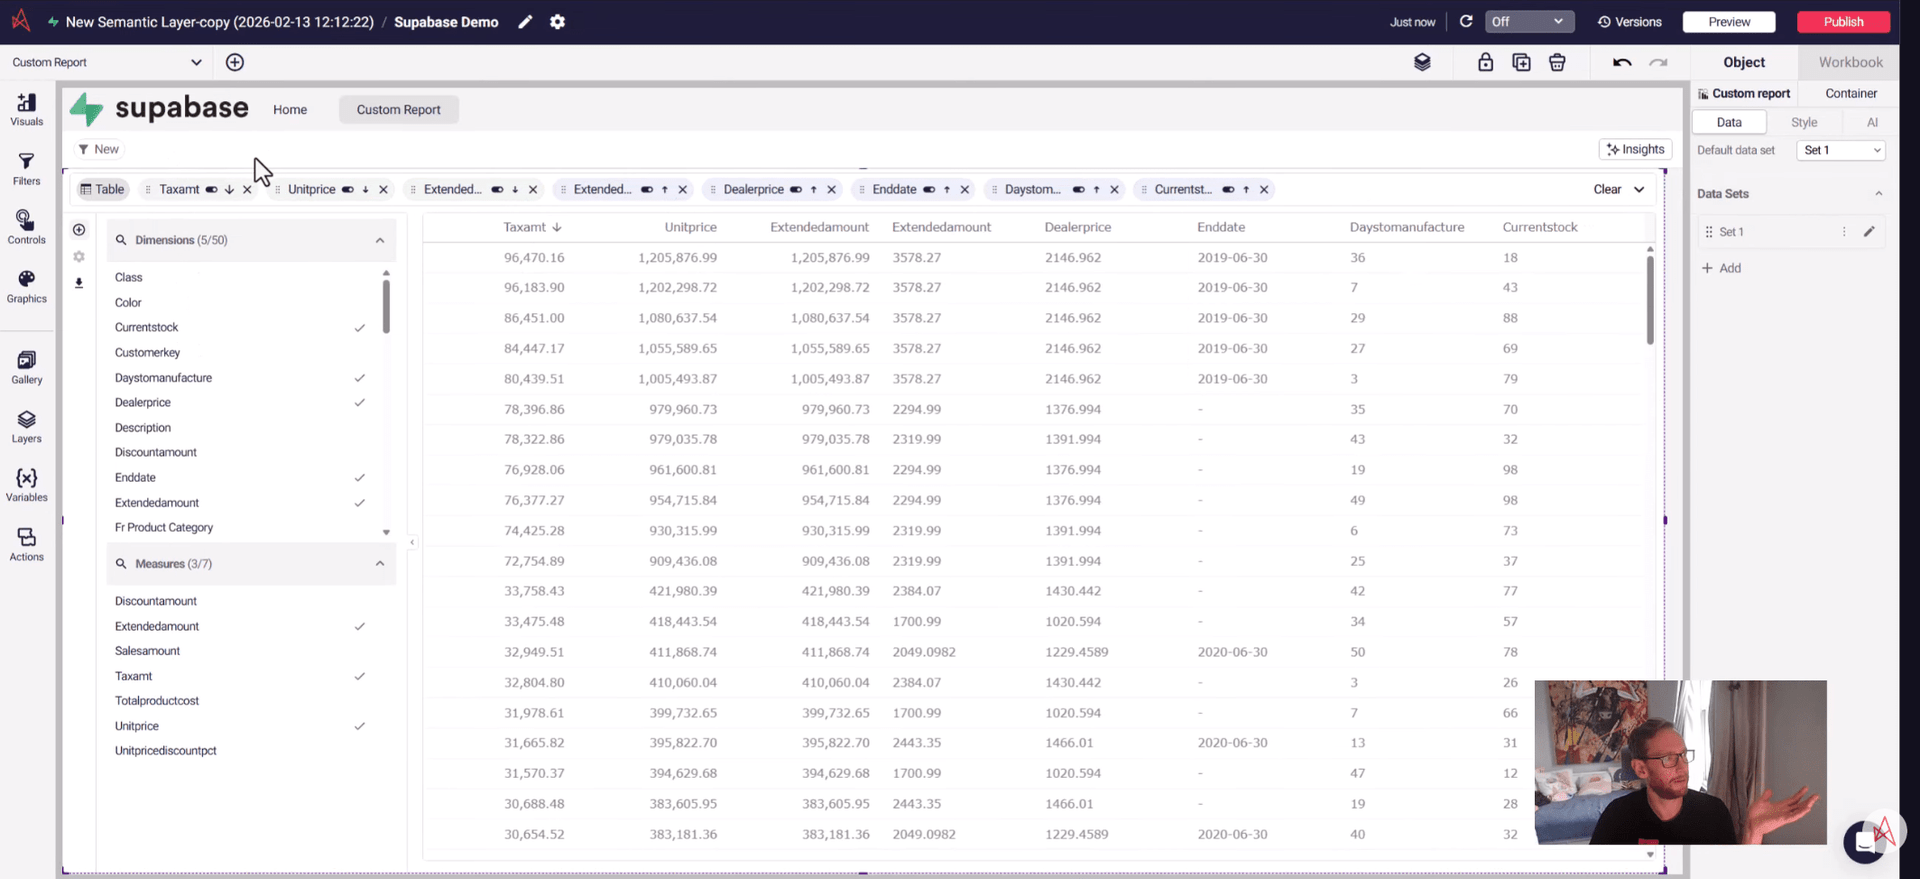
8. Interact With the Dashboard
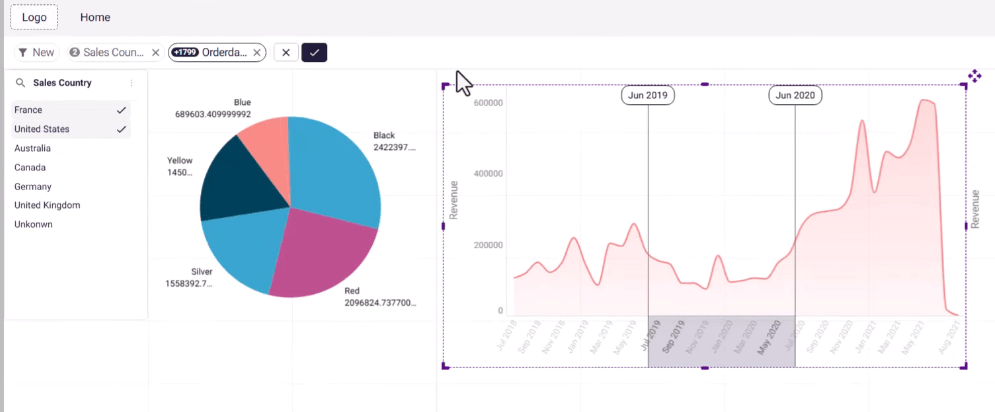
Section titled “8. Interact With the Dashboard”In preview mode, just like published view, you can:
-
Filter
-
Drill
-
Cross-highlight values on charts (brushing)
This works without extracts because of live query.
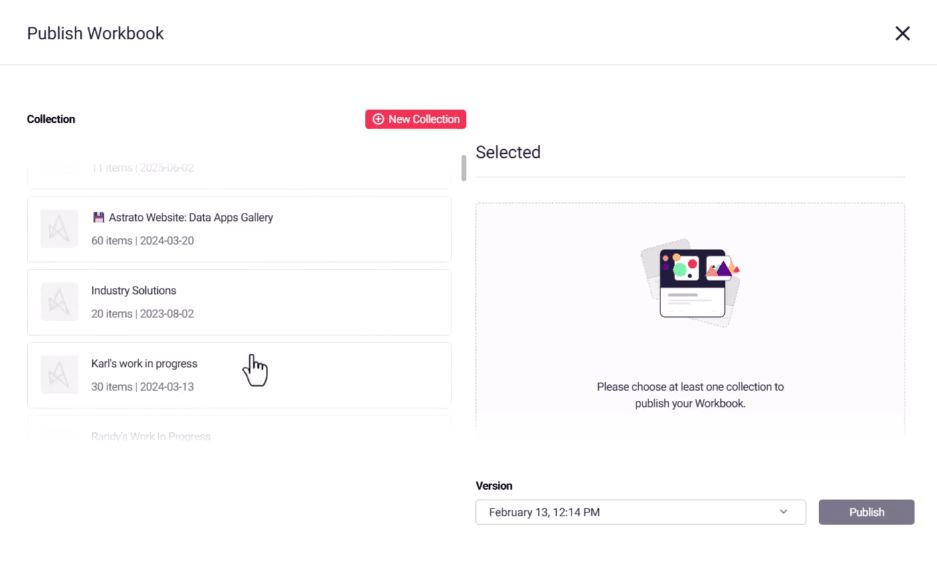
9. Publish dashboard
Section titled “9. Publish dashboard”Once you’re happy with your dashboard, to let other users see it, publish the dashboard.
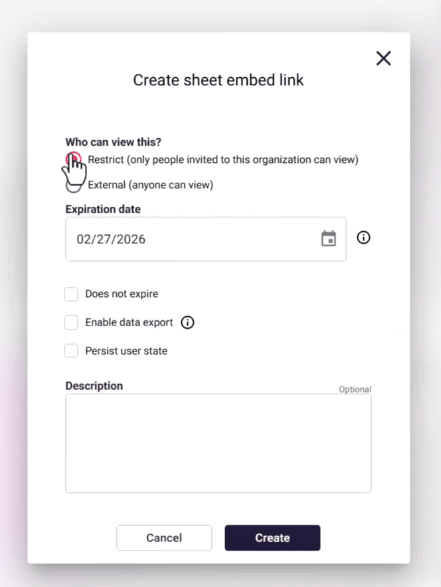
10. Embed Dashboard
Section titled “10. Embed Dashboard”Embed your dashboard into your own product/portal, for customer facing or even public analytics.
You did it 🥳
Section titled “You did it 🥳”You now have:
-
A live connection to Supabase
-
A reusable semantic layer
-
A fully interactive Astrato dashboard