

Top-down funnel layout
A top-down funnel page goes one level deeper with each row: KPIs, then the charts that break them down, then a table of the records behind them. Reflow rules, grid traps and the shared tokens are in Layout and responsiveness.
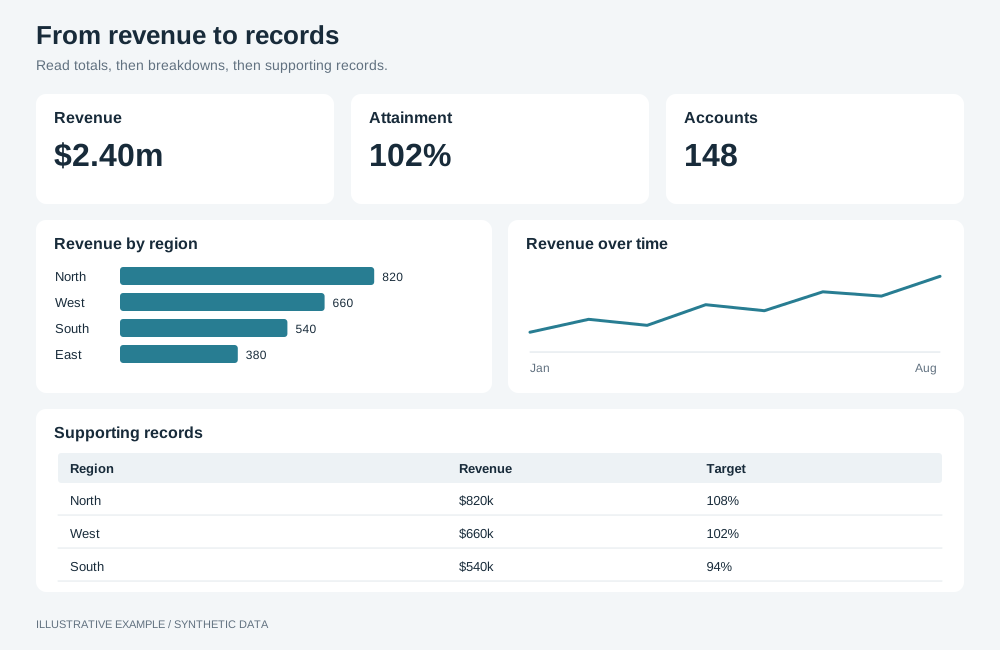
Illustrative example with synthetic data. Read totals, then breakdowns, then supporting records.
When to use a top-down funnel layout
Section titled “When to use a top-down funnel layout”Use it when readers start from totals and end at the records, such as shelter intake to outcomes to individual animals.
| The page is mainly | Use instead |
|---|---|
| Headline numbers and charts, with no records | KPI-led |
| One item at a time, picked from a list | Master–detail |
| Rows of records, with charts only as context | Table-first |
Choose a variant
Section titled “Choose a variant”- Do readers read more than about eight table rows at once, or is there a row below the table? Use scrolling.
- Otherwise, use fixed height.
| Variant | Layout | Use cases |
|---|---|---|
| Fixed height | KPIs, three breakdown charts and the table fit the window | Help desk: open tickets and breaches, then by priority, team and week, then the ticket list |
| Scrolling | KPIs and charts in the first window, the table a full window below | Recruitment: applicants and offers, then by role, source and stage, then the candidate table |
Shared structure
Section titled “Shared structure”- Order the rows from general to specific, with every chart that narrows the table above it.
- Put every object in the page’s one selection group; see Filters and selections. An applied selection filters every connected object, including the rows above the one the reader selected in.
- Above the table, show the applied selections in one line, for example
Showing: Dog · Adopted · 2024, orShowing all records. Build it from the same applied state as the apply bar, and truncate it at a fixed height.
<section class="table-panel" aria-labelledby="table-title"> <h2 id="table-title">Animals</h2> <p class="drill-path">Showing: Dog · Adopted · 2024</p> <div class="table-host"><!-- table object --></div></section>:root { --path-h: 24px; /* Title and padding, drill path, 40px header row, 36px rows. */ /* 8 rows: 52 + 24 + 40 + 8 × 36 = 404 */ --table-min: 404px; /* 20 rows: 52 + 24 + 40 + 20 × 36 = 836 */ --table-floor: 836px;}
.board { display: grid; gap: var(--gap);}.band { display: grid; gap: var(--gap); min-height: 0;}.band--kpis { grid-template-columns: repeat(4, minmax(0, 1fr));}.band--three { grid-template-columns: repeat(3, minmax(0, 1fr));}.table-panel { display: grid; grid-template-rows: auto var(--path-h) minmax(0, 1fr); min-height: 0;}.drill-path { margin: 0; overflow: hidden; white-space: nowrap; text-overflow: ellipsis;}
/* Three 320px charts, 15 for a classic scrollbar: 2 × 16 + 3 × 320 + 2 × 16 + 15 = 1039 */@media (width < 1039px) { .band--three { grid-template-columns: repeat(2, minmax(0, 1fr)); grid-auto-rows: minmax(var(--chart-min), auto); } /* Three charts in two columns: the first spans the row, so no row is incomplete. */ .band--three > :first-child { grid-column: 1 / -1; }}@media (width < 700px) { .band--kpis { grid-template-columns: repeat(2, minmax(0, 1fr)); } .band--three { grid-template-columns: minmax(0, 1fr); }}Fixed height
Section titled “Fixed height”┌───────┬───────┬───────┬───────┐│ KPI │ KPI │ KPI │ KPI │├───────┴──┬────┴─────┬─┴───────┤│ Chart A │ Chart B │ Chart C │├──────────┴──────────┴─────────┤│ Showing: Dog · Adopted ││ Table │└───────────────────────────────┘.board takes its fixed height from Bands above the board.
.board--funnel {  /* Charts and table share the height 2 : 3, and neither goes below its floor. */  grid-template-rows: auto minmax(var(--chart-min), 2fr) minmax(var(--table-min), 3fr);}
/* 64 + 2 × 16 + 96 + 16 + 252 + 16 + 404 = 880 */@media (width < 1039px), (height < 880px) { .board--funnel { height: auto; grid-template-rows: none; } .board--funnel .band--three { grid-auto-rows: minmax(var(--chart-min), auto); } .board--funnel .table-panel { min-height: var(--table-floor); }}| Width | KPIs | Charts | Table | Height |
|---|---|---|---|---|
| 1039px and wider | 4 across | 3 across | At least 8 rows | Fits the window from 880px tall |
| 700–1038px | 4 across | 2 across; the first spans the row | At least 20 rows | Scrolls |
| Under 700px | 2 across | 1 across | At least 20 rows | Scrolls |
Scrolling
Section titled “Scrolling”┌───────┬───────┬───────┬───────┐│ KPI │ KPI │ KPI │ KPI │├───────┴──┬────┴─────┬─┴───────┤│ Chart A │ Chart B │ Chart C │├──────────┴──────────┴─────────┤ ← window bottom│ Showing: Dog · Adopted ││ Table, one window tall │└───────────────────────────────┘The table is at least one window tall, so once the reader scrolls to it, it fills the window and its rows scroll inside it. A row below the table, such as permissions for the selected item, takes its own floor and stays in the same selection group.
.board--funnel-scroll {  height: auto;  /* At 900px tall the table starts at 64 + 16 + 96 + 16 + 324 + 16 = 532, in the first window. */  grid-template-rows: auto minmax(var(--chart-min), 36svh) auto;}.board--funnel-scroll .table-panel {  min-height: max(var(--table-floor), calc(100svh - var(--header-h) - var(--above-board, 0px) - 2 * var(--gap)));}
@media (width < 1039px) { .board--funnel-scroll { grid-template-rows: none; }}| Width | Charts | Table |
|---|---|---|
| 1039px and wider | 3 across, 36% of the window tall, at least 252px | One window tall, at least 20 rows |
| 700–1038px | 2 across; the first spans the row | As above |
| Under 700px | 1 across | As above |