
Advanced Analytics - Forecasting
Forecasting is a technique that uses historical data to determine the direction of future trends. Exponential and Linear forecasting continue existing trend lines to project future forecast values. Scenario forecasting offers forecasting based on a specified growth amount, within a defined period.
Contents
Section titled “Contents”Trend-driven forecasting
Section titled “Trend-driven forecasting”The properties panel includes settings which affect the forecast output, for example:
-
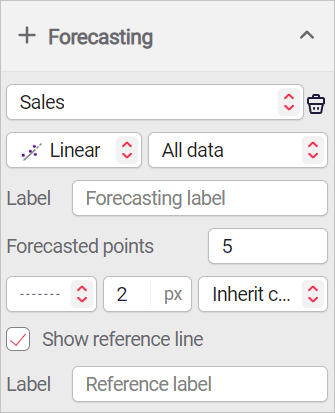
All data / custom range
-
All data draws the linear regression forecast using all data
-
Custom range draws the linear regression forecast, using a limited number of points in the data. This is best used when only the recent data points are relevant
-
-
Forecasted points
- Sets how many points are included in the forecast. This number is related to the range of training/reference data available.
Linear regression
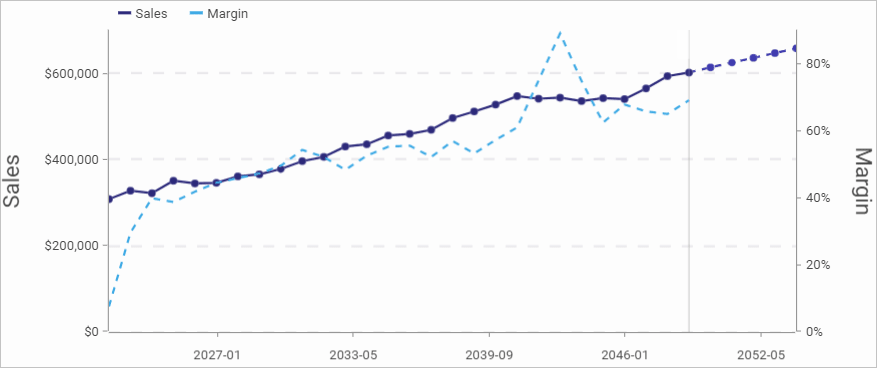
Section titled “Linear regression”The Linear Regression forecast type looks at the relationship between two variables by plotting a line through the observed data, and works best when there is a relationship between the two variables (e.g. age and height, sales and advertising). For the forecast, you extend the line and continue the points that follow the regression line.
Exponential forecasting
Section titled “Exponential forecasting”The exponential forecast option draws a curved line and continues the exponential trend line values. This is best used for
⚠ You cannot create an exponential trendline if your data contains zero or negative values
Scenario Forecasting
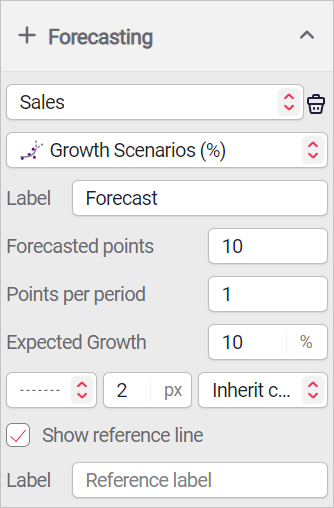
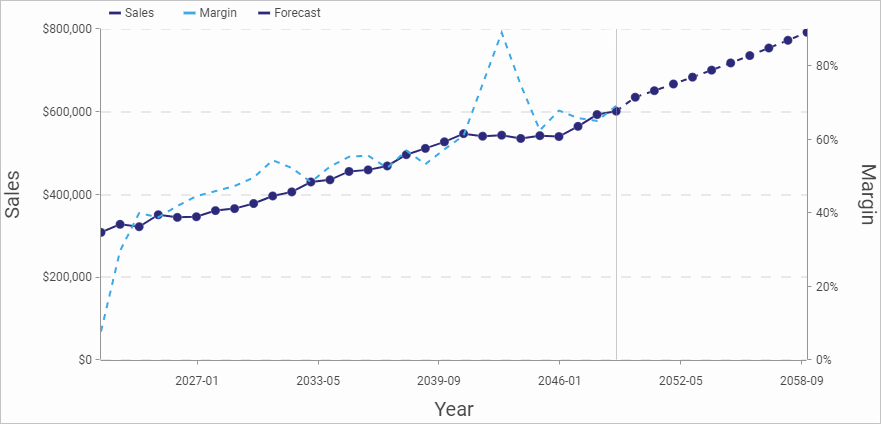
Section titled “Scenario Forecasting”Scenario forecasting visualizes where growth is expected to be accumulated / compounded, allowing you to visualize month-on-month or year-on-year growth, typically for financial forecasts.
Growth is set per period and accumulates over time, for example, after 3 years at 10% interest year-on-year, $10,000 generates interest of $13,310.
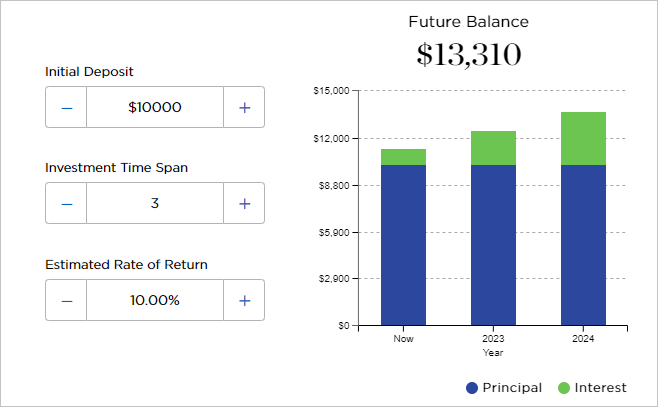
Periods should be defined based on the level of data points, refer to the table below for examples.
Each data point represents | Points per period |
1 day | 7 = 1 week 30 = 1 month 365 = 1 year |
1 Month | 12 = 1 year 3 = 1 quarter |