

Stephen Few
Stephen Few’s approach is monitoring grounded in visual perception: standard chart types, one screen, and emphasis reserved for what needs attention. Books: Show Me the Numbers (2004), Information Dashboard Design (2006) and Now You See It (2009).
Use it for operational dashboards, status pages and scorecards read at a glance. For other pages, see Choose an expert.
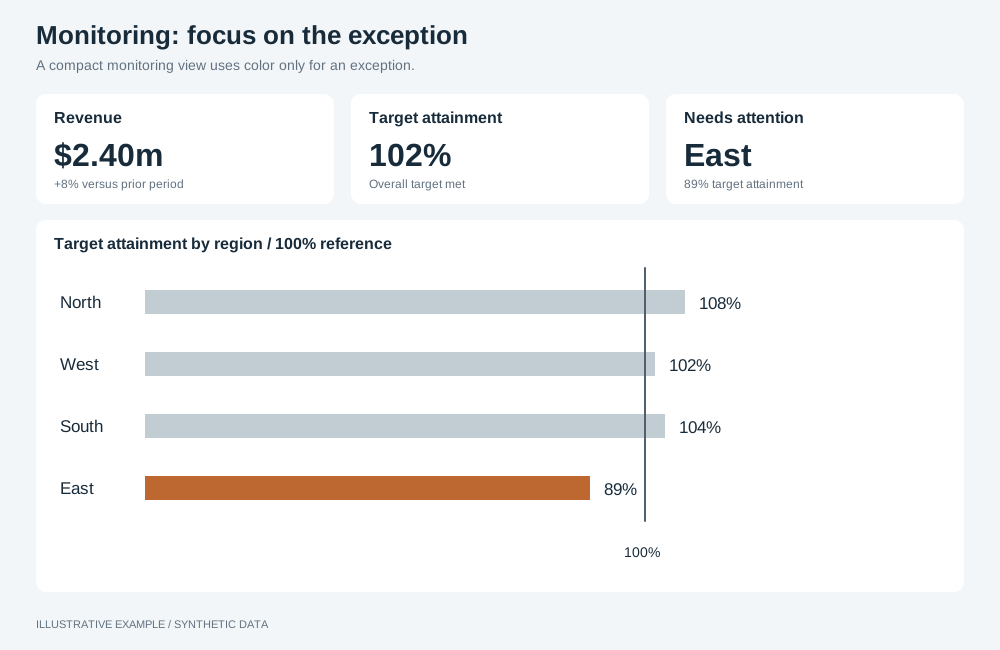
Illustrative example with synthetic data. A compact monitoring view uses color only for an exception.
Fit the judgement on one screen
Section titled “Fit the judgement on one screen”- Use a KPI-led layout and keep the page within its non-scrolling tier; calculate the threshold as in Tokens and thresholds.
- Move detail that the judgement does not need to a detail page.
- Do not put anything the judgement needs behind a tab, popover or hover. Tabs can hold further views; the first view answers the page’s question on its own.
Highlight exceptions only
Section titled “Highlight exceptions only”Mute everything else so that colour, weight and position mark only the values that need attention.
| Check | Operation |
|---|---|
| Context in one muted colour | setColoringType single with setColoringColor |
| The measure that matters in a highlight colour | setMeasureGraphColor (bar, line) |
| The line that matters drawn thicker | setMeasureLineSize (line) |
| Table cells flagged against thresholds | setColumnRepresentation indicator, then addColumnIndicatorSegment, setColumnIndicatorSegmentValue and setColumnIndicatorSegmentColor (table) |
| A KPI’s change beside its value | A measure added with role number-comparison; see KPI card |
| Rank carried by position | setSortingEnabled, setSortingDirection (bar) |
Give every delta a sign or arrow as well as a colour; see Deltas and indicators.
Show a measure against its target
Section titled “Show a measure against its target”gaugewith one dimension takes a second measure as the target;setGaugeBarModetruedraws bars instead of arcs.- A
tablecolumn withsetColumnRepresentationprogressandsetColumnProgressTargetValueshows each row against one target.
No type draws a bullet graph; see App limitations.
Chart choices
Section titled “Chart choices”| Prefer | For |
|---|---|
Sorted bar, horizontal when labels are long |
Comparing and ranking categories |
line |
Change over time |
table with indicator columns |
Precise values, many measures per item |
number with a comparison |
A KPI and its change |
scatter |
Two measures against each other |
| Avoid | Because |
|---|---|
Radial gauge and distribution-gauge |
Large area for one value; hard to compare |
pie and radar |
Angles and radial axes compare less accurately than lengths on one axis |
sankey and word-cloud |
Slower to read than a bar or table of the same values |
Pairs with KPI-led, table-first and card grid layouts, and the storytelling with data and Economist styles. Avoid scrolling layouts such as long-form.
Not available
Section titled “Not available”Bullet graphs and a colour for one named category are not available; see App limitations. Use fixed axis ranges when charts need the same scale.