

Long-form layout
A long-form page stacks sections that the reader takes in order, top to bottom. The page always scrolls, so chart rows have minimum heights instead of shares of the window. Reflow rules, grid traps and the shared tokens are in Layout and responsiveness.
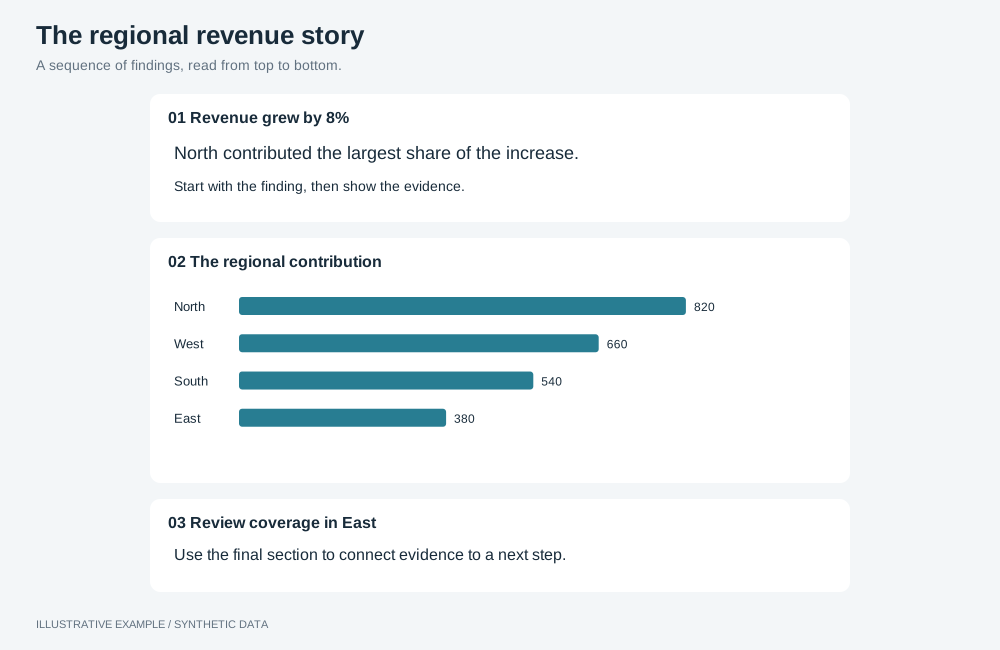
Illustrative example with synthetic data. A sequence of findings, read from top to bottom.
When to use a long-form layout
Section titled “When to use a long-form layout”Use it when the page makes an argument or tells a sequence: period reviews, reports, survey results and data stories.
| The page is mainly | Use instead |
|---|---|
| Headline numbers and their charts on one screen | KPI-led |
| Stages that narrow to records | Top-down funnel |
| Rows of records to read, sort or export | Table-first |
| Links to other pages | Hub |
Choose a variant
Section titled “Choose a variant”- Does a choice in an early part decide what later parts show? Use numbered steps.
- Do several paragraphs explain one chart, each in a different state? Use sticky chart with steps.
- Does each chart need a paragraph beside it? Use alternating text and charts.
- Is the page long and read once, so sections the reader never reaches should cost no query? Use reveal on scroll.
- Otherwise, use sections.
| Variant | Layout | Use cases | Choose another variant when |
|---|---|---|---|
| Sections | A heading, one line of text and 1–3 charts, repeated | Annual report: one section each for revenue, margin and headcount | A choice early on drives the rest |
| Numbered steps | 01 Select, 02 Analyse, 03 Act | Product analysis: pick a product, read its sales, then its reorder list | Sections do not depend on each other |
| Sticky chart with steps | One pinned chart beside text steps; each step changes the chart | Price history: one line, with a step per period | Readers compare states side by side, or the page must print every state |
| Alternating text and charts | Text beside each chart, switching sides each section | Churn explained by tenure, plan and support contacts | Sections carry more than one chart |
| Reveal on scroll | Sections; each chart mounts just before it is reached | A public data story read once | Readers jump between sections, or the page must print complete |
Shared structure
Section titled “Shared structure”- Do not set a height on the board. Give each chart row a floor of
--chart-min. - Keep each section’s heading, text and charts in one element, so visual, reading and keyboard order agree at every width.
- Every mounted object re-queries on each applied selection change, including sections scrolled out of view; see Hidden means unmounted.
- If the first section is taller than the window, see When the page scrolls, make it obvious.
.board {  display: grid;  gap: calc(3 * var(--gap));}.band {  display: grid;  gap: var(--gap);  min-height: 0;}.charts {  display: grid;  gap: var(--gap);  grid-auto-rows: minmax(var(--chart-min), auto);}.charts--2 {  grid-template-columns: repeat(2, minmax(0, 1fr));}.charts--3 {  grid-template-columns: repeat(3, minmax(0, 1fr));}
/* 320px charts, 15 for a classic scrollbar: 3 × 320 + 2 × 16 + 2 × 16 + 15 = 1039 */@media (width < 1039px) {  .charts--3 {    grid-template-columns: repeat(2, minmax(0, 1fr));  }  /* Three charts in two columns: the first spans the row, so no row is incomplete. */  .charts--3 > :first-child {    grid-column: 1 / -1;  }}/* 2 × 320 + 16 + 2 × 16 + 15 = 703 */@media (width < 703px) {  .charts--2,  .charts--3 {    grid-template-columns: minmax(0, 1fr);  }}
Sections
Section titled “Sections”┌───────────────────────────┐│ Heading ││ One line of text │├────────┬────────┬─────────┤│Chart A │Chart B │ Chart C │└────────┴────────┴─────────┘<div class="board"> <section class="band" aria-labelledby="revenue-title"> <header> <h2 id="revenue-title">Revenue</h2> <p>One line that states the finding.</p> </header> <div class="charts charts--3"><!-- three chart hosts --></div> </section> <!-- one section per topic --></div>The shared CSS is all this variant needs; use .charts alone for one full-width chart.
| Width | Three charts | Two charts |
|---|---|---|
| 1039px and wider | 3 across | 2 across |
| 703–1038px | First spans the row, 2 below | 2 across |
| Under 703px | 1 across | 1 across |
Numbered steps
Section titled “Numbered steps”┌───────────────────────────┐│ 01 Select │├────────┬────────┬─────────┤│Filter │Filter │ Filter │└────────┴────────┴─────────┘┌───────────────────────────┐│ 02 Analyse ││ For: <applied choice> │├─────────────┬─────────────┤│ Chart A │ Chart B │└─────────────┴─────────────┘- Put every object in one selection group, so the choice in step 1 filters the later steps; see Use one selection group.
- Put the apply bar at the end of step 1, so later steps re-query once per confirmed choice.
- For a what-if, step 1 sets values that later queries send as parameters.
- Repeat the applied choice in each later step’s line of text, or “All products” until one is applied.
Mark up the steps as an ordered list, and hide the visual number from assistive technology:
<ol class="board steps"> <li class="band" aria-labelledby="select-title"> <h2 id="select-title"><span class="step__num" aria-hidden="true">01</span>Select a product</h2> <div class="charts charts--3 charts--controls"><!-- filter hosts, then the apply bar --></div> </li> <!-- 02 Analyse, 03 Act --></ol>.steps { margin: 0; padding: 0; list-style: none;}.step__num { margin-right: 8px; font-variant-numeric: tabular-nums;}/* Filter hosts: a fixed height, not a floor; see Header and controls. */.charts--controls { grid-auto-rows: 72px;}Every row folds as in Sections.
Sticky chart with steps
Section titled “Sticky chart with steps”903px and wider Under 903px┌─────────┬─────────────────┐ ┌───────────────────────┐│ Step 1 │ │ │ ┌───────────────┐ │├─────────┤ Chart, pinned │ │ │ Step 2 (card) │ ││▌Step 2 │ under the │ │ └───────────────┘ │├─────────┤ header │ │ Chart, pinned behind ││ Step 3 │ │ │ the cards │└─────────┴─────────────────┘ └───────────────────────┘Put the chart before the steps in the DOM, and write each step’s finding in its text, so the page reads completely without the chart:
<section class="band" aria-labelledby="price-title"> <h2 id="price-title">Price rose in three steps</h2> <div class="scrolly"> <div class="scrolly__chart"><div class="chart-host" data-object-id="price-story"></div></div> <ol class="scrolly__steps"> <li class="step"> <div class="step__card"><p>Two or three sentences.</p></div> </li> <!-- one item per step --> </ol> </div></section>.scrolly { display: grid; grid-template-columns: minmax(0, 1fr) minmax(0, 2fr); grid-template-areas: 'steps chart'; gap: var(--gap);}/* The wrapper holds the height; the host is its only grid item and stretches to it. */.scrolly__chart { grid-area: chart; position: sticky; /* --header-h is the sticky header block, including a filter bar inside it. */ top: calc(var(--header-h) + var(--gap)); display: grid; /* Below 64 + 2 × 16 + 252 = 348px tall the chart keeps its floor and overflows the window. */ height: max(var(--chart-min), calc(100svh - var(--header-h) - 2 * var(--gap)));}.scrolly__steps { grid-area: steps; margin: 0; padding: 0; list-style: none;}/* At least 80% of the window, so one step crosses the middle at a time. */.step { display: grid; align-content: center; min-height: 80svh;}.step__card { padding: var(--gap); border-left: 4px solid transparent; background: var(--surface);}.step[data-active] .step__card { border-left-color: var(--accent);}@media (prefers-reduced-motion: no-preference) { .step__card { transition: border-color 200ms ease-out; }}
/* A 280px text column: 3 × 280 + 16 + 2 × 16 + 15 = 903 */@media (width < 903px) { .scrolly { grid-template-columns: minmax(0, 1fr); grid-template-areas: 'stack'; } .scrolly__chart, .scrolly__steps { grid-area: stack; } /* The steps scroll over the pinned chart; the gaps between cards pass the pointer to it. */ .scrolly__steps { position: relative; z-index: 1; pointer-events: none; } .step__card { width: min(100%, 36rem); margin-inline: auto; border: var(--panel-border); border-left-width: 4px; pointer-events: auto; }}position: sticky pins inside the nearest scrolling ancestor. An ancestor with overflow other
than visible or clip becomes that ancestor, and the chart scrolls away with the steps; keep the
page the scroll container.
Each step applies a selection, runs operations on the chart, or both. Compile the chart in the first step’s state.
import type { AstratoSelectionService } from '@astrato-io/sdk';import { applyRuntimeOperations } from '@astrato-io/visualizations/operations';
type ApplyArgs = Parameters<typeof applyRuntimeOperations>[0];
// From the app's setup; see Mounting objects and Object states.declare const runtime: ApplyArgs['runtime'];declare const availableFields: ApplyArgs['availableFields'];declare const selections: AstratoSelectionService;declare const stepFieldKey: string; // from the live metadatadeclare function checkResults(results: unknown): void; // as in Check operation resultsdeclare function markFailed(id: string, error: unknown): void;
const GROUP = 'story'; // the story chart's own group, in the default 'auto' modeconst CHART = 'price-story';
// The chart's complete state at each step, not the change from the step before.type StepState = { values: string[]; operationRequests: ApplyArgs['operationRequests'] };declare const stepStates: readonly StepState[]; // one per .step, in order
const applyStep = async ({ values, operationRequests }: StepState) => {  if (values.length > 0) {    selections.selectValues(GROUP, { field: { fieldKey: stepFieldKey }, operator: 'inList', values });  } else {    selections.removeSelection(GROUP, { fieldKey: stepFieldKey });  }  if (operationRequests.length > 0) {    const applied = await applyRuntimeOperations({ runtime, instanceId: CHART, availableFields, operationRequests });    checkResults(applied.results);  }};
let latest = 0;let chain: Promise<void> = Promise.resolve();
const enterStep = (index: number) => {  const state = stepStates[index];  if (!state) return;  const token = ++latest;  chain = chain.then(async () => {    if (token !== latest) return; // a later step was entered while this one waited    try {      await applyStep(state);    } catch (error) {      markFailed(CHART, error);    }  });};
const stepElements = [...document.querySelectorAll<HTMLElement>('.scrolly .step')];
let stepObserver: IntersectionObserver | undefined;let activeStep = -1;
const observeSteps = () => {  stepObserver?.disconnect();  // A 1px band at the viewport's midpoint. Percentage margins use width, even vertically.  const height = document.documentElement.clientHeight;  const top = Math.floor(height / 2);  const bottom = Math.max(0, height - top - 1);  stepObserver = new IntersectionObserver(    (entries) => {      for (const entry of entries) {        if (!entry.isIntersecting) continue;        const index = stepElements.indexOf(entry.target as HTMLElement);        if (index < 0 || index === activeStep) continue;        activeStep = index;        for (const step of stepElements) step.toggleAttribute('data-active', step === entry.target);        enterStep(index);      }    },    { rootMargin: `-${top}px 0px -${bottom}px 0px` },  );  for (const step of stepElements) stepObserver.observe(step);};
window.addEventListener('resize', observeSteps);observeSteps();- Recreate the observer on resize so the trigger stays at the midpoint. When removing the story
view, disconnect
stepObserverand remove theresizelistener. - Give every step the complete state. A fast scroll skips steps and scrolling back re-enters earlier ones, so each step sets every property any step changes, and a step with no values clears the selection.
- Skip superseded steps. One promise chain orders the updates, and a queued step is skipped when a later one has been entered. A step already applying is not cancelled: its state can show briefly before the latest step’s update replaces it.
- Give the story chart its own group. In
'auto'modeselectValuesapplies at once and replaces the selection on that field; see Driving selections from your own UI. Its own group keeps a step from re-querying other objects or replacing a reader’s filter; the page’s filters then do not reach the chart. - Look up operations per type; see Operation names are per type.
- Apply the reader’s reduced-motion preference through chart animation controls for types that expose them.
- Only the current state prints.
| Width | Chart | Steps |
|---|---|---|
| 903px and wider | Right two-thirds, pinned under the header | Left third |
| Under 903px | Full width, pinned behind the steps | Cards up to 36rem wide, scrolling over the chart |
Alternating text and charts
Section titled “Alternating text and charts”┌─────────┬─────────────────┐│ Text │ Chart 1 │├─────────┴───────┬─────────┤│ Chart 2 │ Text │└─────────────────┴─────────┘Put the text before the chart in every section’s DOM, and swap the grid areas rather than the elements, so reading and keyboard order are the same in every section:
<div class="board"> <section class="band pair" aria-labelledby="tenure-title"> <div class="pair__text"> <h2 id="tenure-title">Churn falls after the first year</h2> <p>Two or three sentences.</p> </div> <div class="pair__chart"><!-- chart host --></div> </section> <!-- next pair --></div>.pair { grid-template-columns: minmax(0, 1fr) minmax(0, 2fr); grid-template-areas: 'text chart'; /* The taller of --chart-min and the text; keep the text to a few sentences. */ grid-template-rows: minmax(var(--chart-min), auto);}/* Counts only pairs, so an introduction in the board does not shift the alternation. */.pair:nth-child(even of .pair) { grid-template-columns: minmax(0, 2fr) minmax(0, 1fr); grid-template-areas: 'chart text';}.pair__text { grid-area: text; align-self: center;}.pair__chart { grid-area: chart;}
/* 3 × 280 + 16 + 2 × 16 + 15 = 903 */@media (width < 903px) { .pair, .pair:nth-child(even of .pair) { grid-template-columns: minmax(0, 1fr); grid-template-areas: 'text' 'chart'; grid-template-rows: auto minmax(var(--chart-min), auto); }}| Width | Odd sections | Even sections |
|---|---|---|
| 903px and wider | Text left third, chart right two-thirds | Chart left two-thirds, text right third |
| Under 903px | Text above its chart | Text above its chart |
Reveal on scroll
Section titled “Reveal on scroll”Each chart mounts when its wrapper comes within one viewport height, and fades in when it is reached. A section the reader never approaches costs no query, and prints empty.
<div class="charts charts--2"> <div class="reveal"><div class="chart-host" data-object-id="revenue-by-week"></div></div> <div class="reveal"><div class="chart-host" data-object-id="revenue-by-channel"></div></div></div>/* The wrapper is the grid item, so the row floor gives its host a definite box before mounting. */.reveal { display: grid; min-width: 0; min-height: 0;}@media (prefers-reduced-motion: no-preference) { /* The transition is on the revealed state only, so marking a wrapper pending hides it at once. */ .reveal:not([data-reveal='pending']) { transition: opacity 400ms ease-out, transform 400ms ease-out; } .reveal[data-reveal='pending'] { opacity: 0; transform: translateY(24px); }}// The Panel class from Hidden means unmounted, one per object id.declare class Panel { show(container: HTMLElement): void;}declare function panelFor(objectId: string): Panel;
const hosts = new Map<Element, HTMLElement>();
// Mount one viewport height ahead, and keep the object mounted afterwards.const mountObserver = new IntersectionObserver( (entries, observer) => { for (const entry of entries) { if (!entry.isIntersecting) continue; observer.unobserve(entry.target); const host = hosts.get(entry.target); const id = host?.dataset.objectId; if (host && id) panelFor(id).show(host); } }, { rootMargin: '100% 0px' },);
// Reveal once the wrapper is above the bottom 10% of the viewport.const revealObserver = new IntersectionObserver( (entries, observer) => { for (const entry of entries) { if (!entry.isIntersecting) continue; observer.unobserve(entry.target); entry.target.removeAttribute('data-reveal'); } }, { rootMargin: '0px 0px -10% 0px' },);
for (const wrapper of document.querySelectorAll<HTMLElement>('.reveal')) { const host = wrapper.querySelector<HTMLElement>('.chart-host'); if (!host) continue; hosts.set(wrapper, host); wrapper.dataset.reveal = 'pending'; mountObserver.observe(wrapper); revealObserver.observe(wrapper);}- Keep it mounted. Never hide a panel on scroll-out. Handle
readyoutside the panel’s lifecycle, as Readiness shows. - Animate the wrapper, never the host; see CSS rules that fail silently.
- Change only
opacityandtransform.visibility: hiddenordisplay: nonewould remove the chart from the accessibility tree. Wrap only the chart, never headings or text. - With
prefers-reduced-motion: reduce, charts show at once and still mount one viewport ahead.