

Information is Beautiful style
This style shows one idea per chart, uses a vivid categorical palette on a flat light or dark page, and leaves wide space between charts. It picks a chart form, such as a treemap, sankey or bubble scatter, because the data suits it. It is modelled on the traits of the Information is Beautiful publication: little chrome, large condensed headings and short labels. It does not use that publication’s name, logo or fonts.
Set the arrangement with a layout; this page covers colour, type, chrome and chart settings.
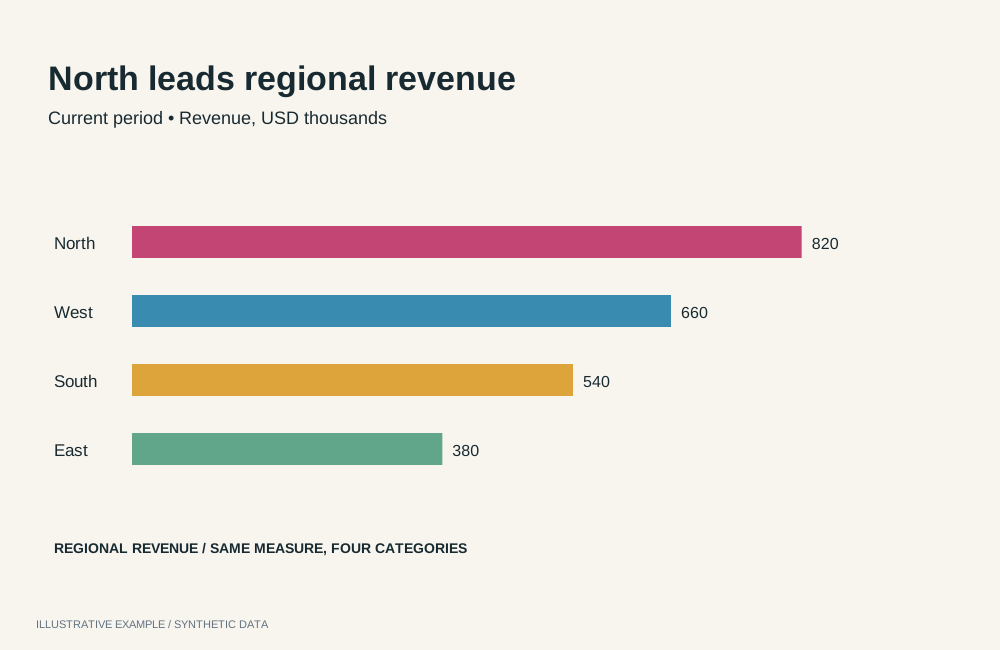
Illustrative example with synthetic data. Vivid categories and generous space make patterns visible.
When to use this style
Section titled “When to use this style”Use it for public-facing pages that show how the parts of a subject connect or compare, where readers browse rather than monitor.
| The page is mainly | Use instead |
|---|---|
| A story read in order, with charts that change as the reader scrolls | Visual essay |
| Charts for a business audience, one takeaway each | Storytelling with data |
| Dense, sourced analysis in standard chart forms | Economist or Financial Times |
| Indicators read beside prose | Explainer |
| A dashboard that looks like the tenant’s Workbooks | Astrato default |
Use cases
Section titled “Use cases”| Use case | Example | Chart forms |
|---|---|---|
| Connections in conceptual data | Which skills lead to which roles | Sankey, heat map with a size measure |
| Part-to-whole across a hierarchy | Where a budget goes, by department and programme | Treemap |
| Comparing items on several measures | Cities by cost and salary, sized by population | Bubble scatter, dot chart |
| Public-facing explainer | How a household spends a day, by activity and age group | Treemap, dot chart, word cloud |
| Portfolio or marketing page | A year of product usage as a few large, labelled charts | Number objects, donut, bubble scatter |
Tokens
Section titled “Tokens”Define every token on :root and redefine the colours under :root[data-theme='dark']; see
Define colour tokens. --surface equals --page, so charts sit
on the page without a panel. Spacing (--gap, --chart-min) comes from the layout.
:root {  --page: #f7f7f4;  --surface: var(--page);  --line: #bdbdb6;  --ink: #141414;  --muted: #595955;  --panel-border: 0;  --panel-shadow: none;  --radius: 0;
  --font-display: 'Barlow Condensed', 'Arial Narrow', sans-serif;  --font-body: 'Barlow', system-ui, sans-serif;
  --section-gap: 96px;  --measure: 60ch;}:root[data-theme='dark'] {  --page: #111114;  --line: #44444c;  --ink: #f2f2ee;  --muted: #a6a6ad;}
Barlow and Barlow Condensed are openly licensed and served by Google Fonts; see Load visualization fonts.
| Role | Font | Size and weight |
|---|---|---|
| Page title | --font-display |
clamp(40px, 6vw, 88px), 600 |
| Section title | --font-display |
32px, 600 |
| Kicker | --font-body |
13px, 600, uppercase, 0.12em tracking |
| Chart title | --font-body |
18px, 600 |
| Body and dek | --font-body |
17px and 20px, 400 |
| Chart note and source | --font-body |
14px and 13px, 400, --muted |
The palette’s dark variant is the vivid one; the light variant is deeper so each colour keeps 3:1 against the light page.
export const categorical = { light: ['#d42a3c', '#a96500', '#00798a', '#3f7f00', '#7440d8', '#b8196f', '#1d64b0', '#7a6b00'], dark: ['#ff5a60', '#ffb000', '#3cc5d8', '#8fd12a', '#b58cff', '#ff7ac8', '#5aa7ff', '#f2dc3c'],};Keep each chart’s palette in its own configuration and re-apply it when the theme changes; see Put the palette on the chart.
Page and card chrome
Section titled “Page and card chrome”No card fills, borders, shadows or radius. Whitespace separates charts; one hairline separates sections.
body {  margin: 0;  background: var(--page);  color: var(--ink);  font: 400 17px / 1.5 var(--font-body);}
.title {  margin: 0;  font: 600 clamp(40px, 6vw, 88px) / 0.95 var(--font-display);  letter-spacing: -0.01em;}.dek {  max-width: var(--measure);  margin: 12px 0 0;  color: var(--muted);  font-size: 20px;}.kicker {  margin: 0 0 8px;  color: var(--muted);  font: 600 13px / 1.2 var(--font-body);  letter-spacing: 0.12em;  text-transform: uppercase;}.section-title {  margin: 0;  font: 600 32px / 1.1 var(--font-display);}.chart-title {  font-family: var(--font-body);  font-weight: 600;  font-size: 18px;}.chart-note {  color: var(--muted);  font-size: 14px;}
.section + .section {  margin-top: var(--section-gap);  padding-top: var(--gap);  border-top: 1px solid var(--line);}
/* The Card's row tokens; --panel-border, --radius and --panel-shadow are set above.   See /app-components/object-frame/#css. 7 + 24 + 16 + 7 = 54px of card. */:root {  --frame-pad-x: 0px;  --frame-pad-y: 7px;  --frame-title-h: 24px;  --chart-min: 254px;}
.source {  margin-top: var(--gap);  color: var(--muted);  font-size: 13px;}
Charts
Section titled “Charts”Charts start in the built-in light theme; colour each with its own operations. On every chart that
has them, set axis and legend text to --muted and axis lines to --line with setAxisLabelColor,
setAxisTitleColor, setAxisLineColor, setAxisTickColor and setLegendItemLabelFill.
setCustomPaletteColors colours by category where the chart does. Treemap opens that way. Pie,
scatter, dot and word cloud open in one colour and refuse a palette until setColoringType is
categorical; see Colouring types. Radar accepts categorical
only with two dimensions; sankey accepts single or perEachDimension.
| Type | Use it for | Operations to set |
|---|---|---|
treemap |
Part-to-whole across levels | setColoringType categorical, setCustomPaletteColors; setTreemapLeafLabelShowMeasureValue; setTreemapLeafLabelDynamicFontSizeEnabled; setTreemapHeaderLabelsShow; setLegendEnabled false when leaves are labelled |
sankey |
Flows across ordered stages | setSankeyNodeLabelDisplayParts; setSankeyNodeLabelShowBackdrop with setSankeyNodeLabelBackdropColor --page; setSankeyColumnHeaderLabelsShow |
scatter |
Items on two measures, a third as bubble size (definition) | setColoringType categorical, setCustomPaletteColors; setShowDataLabels; setDataLabelDensity; setDataLabelTextColor |
dot |
One measure across two dimensions | setColoringType categorical, setCustomPaletteColors; setOrientation |
heatMap |
A matrix of two dimensions, coloured and optionally sized (definition) | setColoringType gradient, setCustomGradientColors; setShowAxisOnTop |
radar |
A profile across several measures | setLegendPosition; setLegendItemLabelFill |
word-cloud |
Terms weighted by one measure | setColoringType categorical with setCustomPaletteColors, or gradient with setCustomGradientColors |
pie |
A few parts of one whole | setColoringType categorical, setCustomPaletteColors; setPieChartType donut; setBorderEnabled, setBorderColor --page, setBorderWidth; setPieLabelColor; setPieLabelFormat |
line |
Change over time | setLineType curve; setMeasureLineSize; setLineChartType area for one series |
number |
One large figure | setNumberFontFamily Barlow Condensed; setNumberFontWeight; setNumberFontColor --ink |
// Call this on mount and again when the theme changes.async function applyBudgetPalette(): Promise<void> { const theme = document.documentElement.dataset.theme === 'dark' ? 'dark' : 'light'; const applied = await applyRuntimeOperations({ runtime, instanceId: 'budget-treemap', availableFields, operationRequests: [ { id: 'type', name: 'setColoringType', payload: 'categorical' }, { id: 'palette', name: 'setCustomPaletteColors', payload: { colors: categorical[theme] } }, ], }); // Check applied.results, as described below.}Check each result; see Check operation results. Colours are assigned by hash by default, so two categories can share a colour; see Styling and theming.
Titles, labels and annotation
Section titled “Titles, labels and annotation”- Title the subject, not the finding. A few words in the display face, with a one-line dek.
- Put titles and notes in the page, in the card’s first row. State units once, in the note.
- Label directly where the type can: treemap leaves, sankey nodes, scatter points. Then turn the legend off.
- End each section with its source, in
.source.
Contrast
Section titled “Contrast”WCAG ratios from Measure contrast, against --page. Text needs
4.5:1, series 3:1; the hairline is checked against the 1.4 guide.
| Pair | Light | Dark |
|---|---|---|
--line against --page |
1.76 | 1.95 |
--ink against --page |
17.16 | 16.79 |
--muted against --page |
6.55 | 7.79 |
Series 1 against --page |
4.66 | 6.18 |
Series 2 against --page |
4.30 | 10.29 |
Series 3 against --page |
4.77 | 9.13 |
Series 4 against --page |
4.61 | 10.16 |
Series 5 against --page |
5.64 | 7.32 |
Series 6 against --page |
5.74 | 7.96 |
Series 7 against --page |
5.59 | 7.55 |
Series 8 against --page |
4.98 | 13.53 |
Label text drawn on a coloured mark, such as a treemap leaf label, is not covered.
Not available
Section titled “Not available”See App limitations: no chord, network, circle-packing, radial bar, sunburst, beeswarm, pictogram or streamgraph type; chart text stays in Roboto; treemap and sankey labels take no text colour; radar spoke labels take no colour; word-cloud words take no font; no colour for a named category value; no notes on the plot or gridline styling.
Logarithmic measure axes are supported by bar, combo and line; see
axis ranges and scales.
Pairs well with
Section titled “Pairs well with”| Kind | Page | Why |
|---|---|---|
| Layout | Long-form sections | One idea per section, with space between them |
| Layout | Bento | A few large charts of different forms on one board |
| Layout | Card grid | One chart form repeated across items |
| Expert | Kirk | Choosing a chart form for the data and audience |
| Expert | Tufte | Removing chrome that carries no data |
Related
Section titled “Related”- Theming: tokens, chart palettes, fonts and contrast.
- Styling and theming: palette operations and persistent colours.
- Definitions: data roles per type.