

See what depends on what in Lineage
Every definition in a semantic layer rests on something else: a measure on a field, a field on a table. Before you rename a field, rewrite a formula or remove a dimension, the question worth asking is what else goes with it — and whose reports. Lineage draws those dependencies so you can read the answer instead of guessing at it.
Before you start: open a semantic layer and go to Business Context → Lineage.
How to read the graph
Section titled “How to read the graph”The graph is laid out in columns, reading left to right from your data towards the things built on it: Tables, then Fields, then Measures and Dimensions, then whatever consumes those. Each line runs from a definition to what it reads.
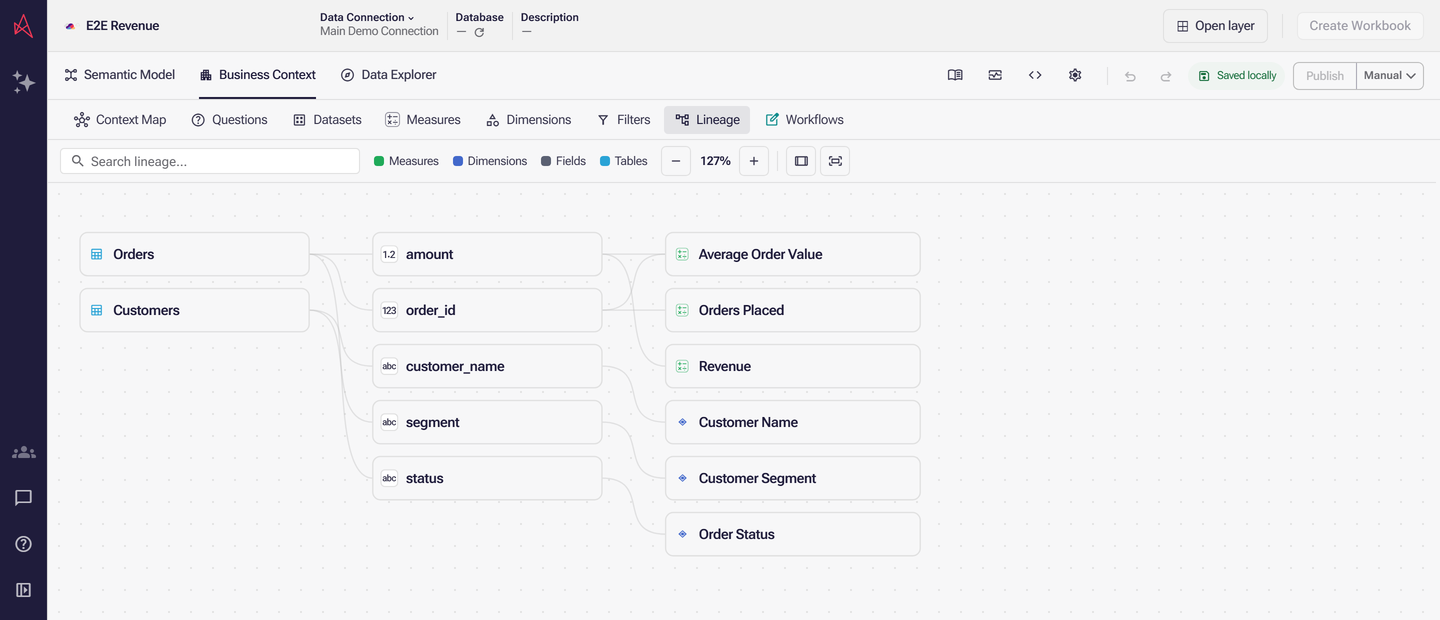
The legend names only the kinds of node this layer actually has, so a short legend is not a broken one. Business Questions and Datasets appear where Business Questions are enabled for your workspace, and Workflows and Stored procedures where Business Workflows are.
The graph is drawn from the draft, so a measure you added this morning is already in it, published or not.
Trace one item
Section titled “Trace one item”Select a node and the graph answers for that item: everything upstream and downstream of it stays lit and everything else dims. Lit nodes move to the top of their column too, so the lines you care about stay short instead of running the length of the graph.
Selecting a node toggles it in and out of the selection, so you can hold two measures up against each other. Selecting empty space, or Clear, puts the graph back.
You do not have to start here. On a measure or dimension row, the ⋮ menu offers Show in lineage, which opens this tab with that item already selected; so does the remove confirmation, and the table and field menus on Map View. Going the other way, hovering any node but a stored procedure shows a ⋮ button, Open in editor, which opens that item’s panel.
Find something in a large model
Section titled “Find something in a large model”Search lineage… matches a node’s name and the detail its tooltip carries — a field’s table, a measure’s result type. The box reports No results, or which match you are standing on — 3 of 18 — with Previous match and Next match to step through them. The view travels to each match; on a graph this tall, a count on its own shows you nothing. Searching clears your selection, and selecting clears your search.
The toolbar also has Zoom out, Zoom in, Fit width and Fit whole graph. When the graph runs past the edge of the view, a minimap appears in the corner: select or drag inside it to move, and drag the view rectangle’s corner to zoom.
What a fault affects
Section titled “What a fault affects”A node with a validation issue is outlined and carries a warning or error mark; hover it to read the message.
A missing source travels downstream; a broken formula does not. Where a table or column has gone missing underneath the model, or its type has changed, every definition that reads it is marked as well and the links along that path are dashed — that chain is what the change has broken. An issue in a definition’s own formula is marked on that definition alone. Semantic layer issues collects them all in one list.
A field a definition reads through a filter rather than through its formula carries a filter mark while it is lit: a dependency that narrows rows, rather than one that supplies values.
Who is using it
Section titled “Who is using it”Where you are an owner or administrator, Show usage adds how much each node is used: a node something uses carries a count of the workbooks and Data Apps using it. Business questions, workflows and stored procedures carry no count, as a workbook cannot use them.
Beneath the graph, Analytics reports on the node you selected last — how many times it is used, and where, under Workbooks, Sheets, Objects and Actions, or under Published Data Apps. A row says via another item when the workbook reaches this node through something else, a question or a measure rather than the field itself.
Data Apps are read for you. Workbooks are not: turn on Show workbooks, then Choose a workbook…. Each one is exported and parsed to see what it uses, so they are read one at a time and a large workbook takes several seconds.
No count is not proof that nothing uses it. Only the workbook you chose has been read, so a node with nothing against it may still be used by every other workbook on the layer. Analytics says as much when a read was incomplete.
A workflow’s own connections
Section titled “A workflow’s own connections”Selecting a workflow node opens Mapped workflow connections: each thing it touches and what it does to it — Calls, Read, Write, Row count check or Refers to. A workflow with none says No mapped connections. For a stored procedure only the signature is known, so what its body touches is not drawn.
An empty tab says No lineage to show yet: create a measure or dimension and its field lineage appears here.
Next: When your database schema changes covers what happens when a table or column moves underneath your model, and how to repair it.