What Business Context is for
The Semantic Model tab describes the shape of your data — which tables you’re using, how they join, what columns exist. Business Context is where you say what any of it means.
A column called Salesamount is a fact about your database. “Monthly Sales” is a fact about your business. Business Context is where the second one lives, so that everyone building workbooks reaches for the same definitions instead of inventing their own.

What it holds
Section titled “What it holds”Select Business Context in the editor’s tab bar and its sub-tabs appear in a second row beneath it. There are eight in all, ordered the way you would work through them — the whole picture, then the questions, then the parts those questions are made of.

| Sub-tab | What it is for |
|---|---|
| Context Map | The whole layer as one graph, with an Insights card reporting what no question asks about |
| Questions | The business questions your layer is meant to answer, stored so everyone gets the same answer |
| Datasets | A named, categorised bundle of measures and dimensions, so a reader is handed a subject rather than a list |
| Measures | The numbers |
| Dimensions | The ways you slice them |
| Reusable Filters | Stored filters, set and regular, reusable in questions and as a table’s Filter source |
| Lineage | Where a number comes from |
| Workflows | Named table writes and procedures, authored in the layer; adding one does not run it |
The row shortens two names. Questions is the Business Questions tab and Workflows is Business Workflows; hover either to see the full name. The rest of the documentation uses the full names.
You may see fewer than eight. Measures, Dimensions and Lineage are always there. Context Map, Business Questions, Datasets and Reusable Filters appear where Business Questions are enabled for your workspace, and Business Workflows where Business Workflows are. A sub-tab you have read about and cannot find is switched off for your workspace rather than gone from the product; if you need it, ask your Astrato administrator or Astrato contact.
Measures — the numbers
Section titled “Measures — the numbers”A measure is something you count or add up: revenue, orders, average deal size. Other tools call it a metric or a KPI. Each one carries a formula, and it can carry a plain-English description so a reader knows what it’s for. Define it once, publish the layer, and every workbook, Data App and Nash answer on the layer uses the same number.
Add offers four kinds, in this order: Standard measure aggregates one field, Calculated measure builds from other measures or an expression, Time intelligence measure compares or accumulates a measure across periods, and Conditional measure behaves differently in different cases.
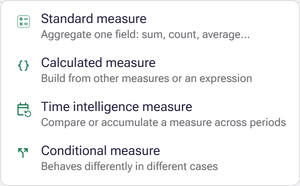
Time intelligence measure appears only where period-over-period analysis is enabled for your workspace; with that off the menu offers the other three. It also needs something to measure against, a time intelligence axis. See Period axes.
To create your first one, such as total revenue, follow the steps in Define a measure in Business Context.
Dimensions — the ways you slice them
Section titled “Dimensions — the ways you slice them”A dimension is what you break a number down by: product, region, month, customer.
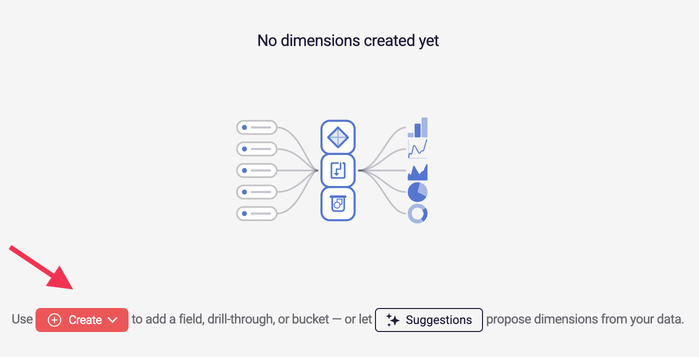
Six kinds here, in this order: Field dimension is one field as it is, Drill-through a path to step down such as Region › Nation › Customer, Bucket bands from a number, Custom groups your own groups of a field’s values, Time intelligence axis periods for period-over-period measures, and Sets values built from stored set filters.
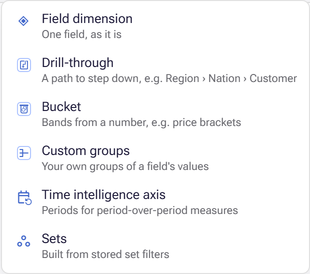
The last two depend on a capability: Time intelligence axis appears where period-over-period analysis is enabled for your workspace, Sets where Business Questions are, because a sets dimension is built from stored set filters.
Selecting a kind opens a panel titled after it, prefixed New until you save: Bucket opens New bucket dimension, and afterwards the panel reads Bucket dimension. Drill-through, Custom groups and Sets pick up the word dimension the same way; Field dimension and Time intelligence axis keep the menu’s own wording.
See Create a dimension in Business Context.
Lineage — where a number comes from
Section titled “Lineage — where a number comes from”Lineage draws your model as a chain, reading left to right from the tables you are using, through their fields, to the measures and dimensions built on top and whatever consumes those. It answers the question people actually ask about a number on a dashboard — where does this come from?
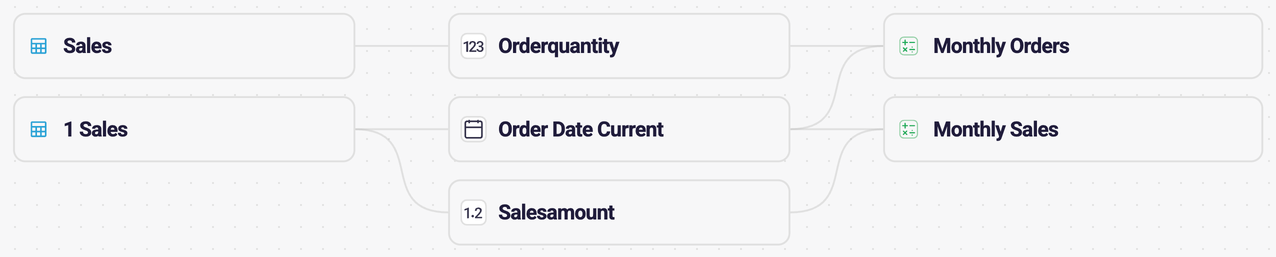
The toolbar carries search, a colour key for the node kinds and zoom controls.

See what depends on what in Lineage covers reading the graph, tracing one item, what a validation fault affects, and which workbooks and Data Apps use a node.
Next: Choose Define a measure in Business Context, Create a dimension, or Get suggestions from your data if you’d rather Astrato propose some to start from.