

Andy Kirk
Andy Kirk’s approach is a design process rather than fixed rules: each decision follows from the brief. Book: Data Visualisation: A Handbook for Data Driven Design (2016; third edition 2024).
Use it when the brief is new or unclear: a new or mixed audience, unfamiliar data, or a page whose purpose must be decided before its charts. For other pages, see Choose an expert.
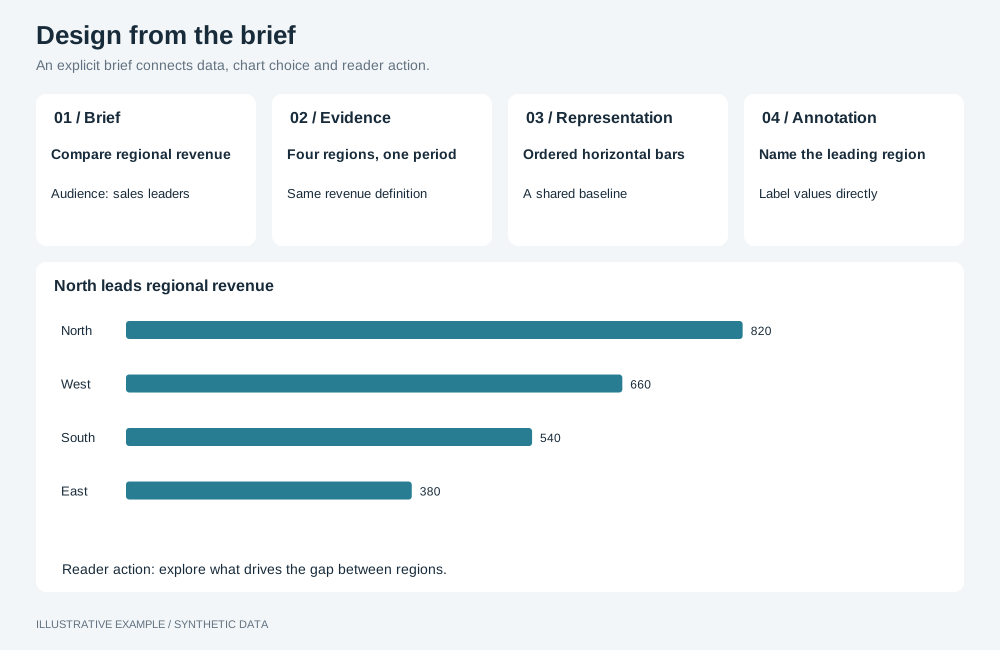
Illustrative example with synthetic data. An explicit brief connects data, chart choice and reader action.
Work through the decisions in order
Section titled “Work through the decisions in order”Record each answer before moving on.
| Decide | In an App |
|---|---|
| Brief: who reads the page, what they need to do, how often, on which screens | Choose the layout and style from this |
| Data: what the fields mean, their gaps, zeros and grain | Keep gaps visible; group dates with setDimensionTemporalGrouping (Charts) |
| Editorial: what to show, for which items and period, with what emphasis | Filters, Top N, sorting and colour |
| Representation: which type shows the relationship | Chart choices |
| Interactivity: what readers can change or reveal | Tooltips, filters, drill-through |
| Annotation: titles, labels, captions | Axis titles, data labels, text beside the chart |
| Colour: what colour encodes, in both themes | Colour visualizations with operations |
| Composition: placement, size and order | The layout page and Layout and responsiveness |
Balance trustworthy, accessible and elegant
Section titled “Balance trustworthy, accessible and elegant”Resolve conflicts in this order.
- Trustworthy. Bars start at zero (check the rendered axis; where it does not, use a
dotchart, which encodes position, not length); stack only measures with the same unit; format values with their unit; group items that Top N hides; keep real zeros visible. - Accessible. Measure contrast in both themes (Measure contrast), do not rely on colour alone, label directly, and caption unfamiliar types.
- Elegant. Use the same type, colours and labels for the same question across pages, and remove chrome that does not help the reader.
Chart choices
Section titled “Chart choices”A standard type is the default. Choose a less familiar one when it shows the relationship more directly and the audience can learn to read it. Check its operations page before promising a styling choice; each type publishes its own operations.
| Relationship | Standard | Alternative |
|---|---|---|
| Comparing categories | bar |
dot; heatMap for two dimensions; radar for a profile |
| Change over time | line |
combo for two related measures; heatMap for hour by weekday |
| Part of a whole | Stacked bar |
pie for few parts; waterfall for contributions to a total |
| Hierarchy | table |
treemap, tree |
| Flow between stages | bar per stage |
sankey |
| Two measures against each other | scatter |
scatter with a size measure |
| Distribution | histogram |
— |
| Single value | number |
gauge against a target |
| Frequency of terms | table or bar |
word-cloud when the gist matters more than exact values |
The brief decides the layout and style; Compose a dashboard page maps briefs to both.
Not available
Section titled “Not available”Chord diagrams, maps and annotations on a single data point are not available; see App limitations. Use fixed axis ranges to keep comparisons on the same scale.