

Master–detail layout
A master–detail page lists items on one side; picking one fills the rest of the page with that item’s detail. Reflow rules, grid traps and the shared tokens are in Layout and responsiveness.
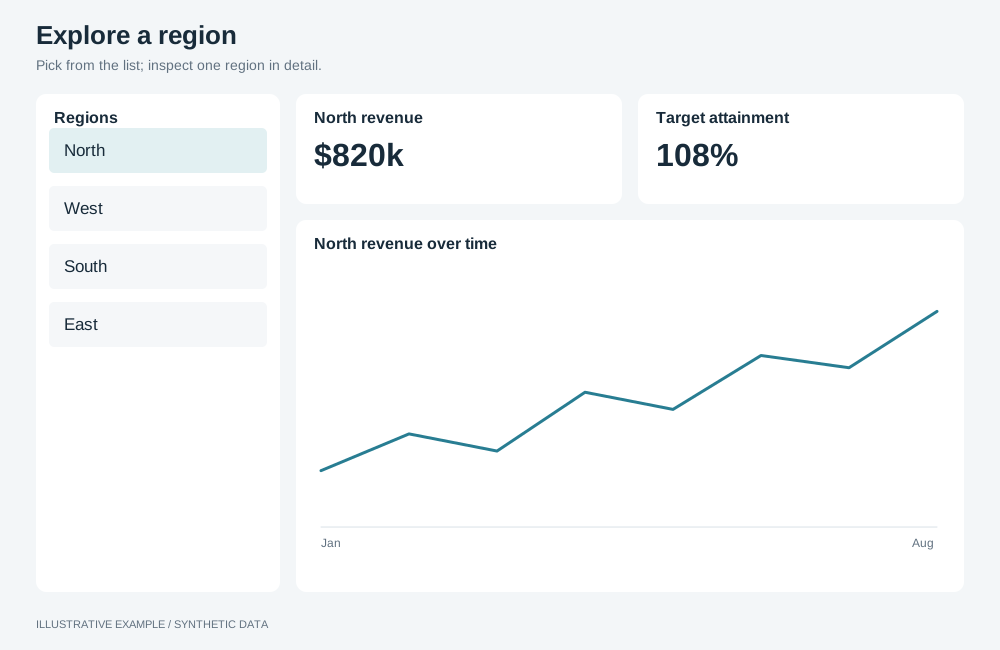
Illustrative example with synthetic data. Pick from the list; inspect one region in detail.
When to use a master–detail layout
Section titled “When to use a master–detail layout”Use it when readers compare items by opening them one at a time: an agent, a turbine, a product or a student. The same item opened from another page, without the list, is a detail page.
| The page is mainly | Use instead |
|---|---|
| Headline numbers, then the charts that explain them | KPI-led |
| Many items side by side, each as a card | Card grid |
| Rows of records to read, sort or export | Table-first |
| One item with its artwork, picked from picture tiles | Showcase |
Choose a variant
Section titled “Choose a variant”- Do readers need figures for all items while one item is open? Use summary band.
- Otherwise, use list and detail.
| Variant | Layout | Use cases |
|---|---|---|
| List and detail | List on the left, the selected item’s KPIs and charts on the right | Sales agents: revenue, deals won and win rate, with revenue by month |
| Summary band | KPIs for all items on top, then the list and the selected item’s charts | Wind-turbine fleet: fleet output on top, then one turbine’s output by day |
Shared structure
Section titled “Shared structure”- Write the pick as a selection on the item’s field in the page’s selection group with
selectValues; a new pick replaces the previous one. In manual mode it waits for Apply like any other selection. See Driving selections from your own UI. - Build the list from your own query, and leave the list’s own field out of its filters, or a pick filters the list down to one item; see Re-query your own objects only on applied changes.
- Keep the detail objects mounted; they re-query when the applied selections change.
- With nothing selected, the detail shows every item combined, and a reload loses the selection. Select a default item on load.
- Name the selected item in the detail heading, at a fixed height with truncation.
- Render each item as a button and mark the selected one with
aria-current="true".
<section class="md-list" aria-label="Agents"> <ul> <li><button type="button" aria-current="true">Agent A</button></li> <li><button type="button">Agent B</button></li> </ul></section>:root { /* Between 240px and 320px, for your item names. */ --list-w: 280px; --detail-heading-h: 32px;}
.board { display: grid; gap: var(--gap);}.band { display: grid; gap: var(--gap); min-height: 0;}.band--kpis { grid-template-columns: repeat(4, minmax(0, 1fr));}.band--two { grid-template-columns: repeat(2, minmax(0, 1fr));}
.md { display: grid; grid-template-columns: var(--list-w) minmax(0, 1fr); gap: var(--gap); min-height: 0;}.md-list { /* The detail sizes the row; the list scrolls inside it. */ contain: size; min-height: 0; overflow-y: auto;}.md-list ul { display: grid; gap: 4px; margin: 0; padding: 0; list-style: none;}.md-detail { display: grid; gap: var(--gap); min-height: 0;}.md-detail > h2 { height: var(--detail-heading-h); margin: 0; overflow: hidden; white-space: nowrap; text-overflow: ellipsis;}
/* Two 320px detail charts, 15 for a classic scrollbar: 2 × 16 + 280 + 16 + (2 × 320 + 16) + 15 = 999 */@media (width < 999px) { .md { grid-template-columns: minmax(0, 1fr); } /* The list becomes a strip above the detail and scrolls sideways. */ .md-list { contain: none; overflow-x: auto; overflow-y: hidden; } .md-list ul { grid-auto-flow: column; grid-auto-columns: max-content; }}@media (width < 700px) { .band--kpis { grid-template-columns: repeat(2, minmax(0, 1fr)); } .band--two { grid-template-columns: minmax(0, 1fr); }}.board takes its fixed height from Bands above the board.
Past a few dozen items a strip is slow to scan; use a <select> above the detail instead.
List and detail
Section titled “List and detail”┌────────┬──────────────────────────┐│ Item 1 │ Item 1 ││ Item 2 ├──────┬──────┬──────┬─────┤│ Item 3 │ KPI │ KPI │ KPI │ KPI ││ Item 4 ├──────┴──────┼──────┴─────┤│ Item 5 │ Chart A │ Chart B ││ … ├─────────────┼────────────┤│ │ Chart C │ Chart D │└────────┴─────────────┴────────────┘<div class="board md md--list"> <section class="md-list" aria-label="Agents"><!-- buttons --></section> <section class="md-detail" aria-labelledby="detail-title"> <h2 id="detail-title">Agent A</h2> <div class="band band--kpis"><!-- 4 KPIs --></div> <div class="band band--two"><!-- 2 charts --></div> <div class="band band--two"><!-- 2 charts --></div> </section></div>.md--list .md-detail { grid-template-rows: auto auto minmax(0, 1fr) minmax(0, 1fr);}
/* 64 + 2 × 16 + 32 + 16 + 96 + 16 + 252 + 16 + 252 = 776 */@media (width < 999px), (height < 776px) { .md--list { height: auto; } .md--list .md-detail { grid-template-rows: none; } .md--list .band--two { grid-auto-rows: minmax(var(--chart-min), auto); }}| Width | List | Detail | Height |
|---|---|---|---|
| 999px and wider | Left column | KPIs 4 across, charts 2 across | Fits the window from 776px tall |
| 700–998px | Strip above the detail | KPIs 4 across, charts 2 across | Scrolls |
| Under 700px | Strip above the detail | KPIs 2 across, charts 1 across | Scrolls |
Summary band with list and detail
Section titled “Summary band with list and detail”┌───────┬───────┬───────┬───────────┐│ KPI │ KPI │ KPI │ KPI │├───────┴┬──────┴───────┴───────────┤│ Item 1 │ Item 1 ││ Item 2 ├─────────────┬────────────┤│ Item 3 │ Chart A │ Chart B ││ … ├─────────────┼────────────┤│ │ Chart C │ Chart D │└────────┴─────────────┴────────────┘The summary KPIs show all items, so build them from your own queries and leave the list’s field out of their filters, as for the list. A chart object in the group would follow the pick.
<div class="board board--summary"> <div class="band band--kpis"><!-- 4 KPIs for all items --></div> <div class="md"> <section class="md-list" aria-label="Turbines"><!-- buttons --></section> <section class="md-detail" aria-labelledby="detail-title"> <h2 id="detail-title">Turbine 07</h2> <div class="band band--two"><!-- 2 charts --></div> <div class="band band--two"><!-- 2 charts --></div> </section> </div></div>.board--summary { grid-template-rows: auto minmax(0, 1fr);}.board--summary .md-detail { grid-template-rows: auto minmax(0, 1fr) minmax(0, 1fr);}
/* 64 + 2 × 16 + 96 + 16 + 32 + 16 + 252 + 16 + 252 = 776 */@media (width < 999px), (height < 776px) { .board--summary { height: auto; grid-template-rows: none; } .board--summary .md-detail { grid-template-rows: none; } .board--summary .band--two { grid-auto-rows: minmax(var(--chart-min), auto); }}| Width | Summary | List | Detail | Height |
|---|---|---|---|---|
| 999px and wider | 4 across | Left column | Charts 2 across | Fits the window from 776px tall |
| 700–998px | 4 across | Strip below the summary | Charts 2 across | Scrolls |
| Under 700px | 2 across | Strip below the summary | Charts 1 across | Scrolls |