

Economist style
This style follows the observable traits of The Economist’s charts: a short red rule above a bold title that states the finding, a lighter subtitle with the unit, a plain white ground, few lines, a blue palette with red and teal accents, and a small source line. It does not use the publication’s logo or proprietary fonts.
Titles, subtitles and source lines are host HTML; the chart is styled with operations. See Colour visualizations with operations.
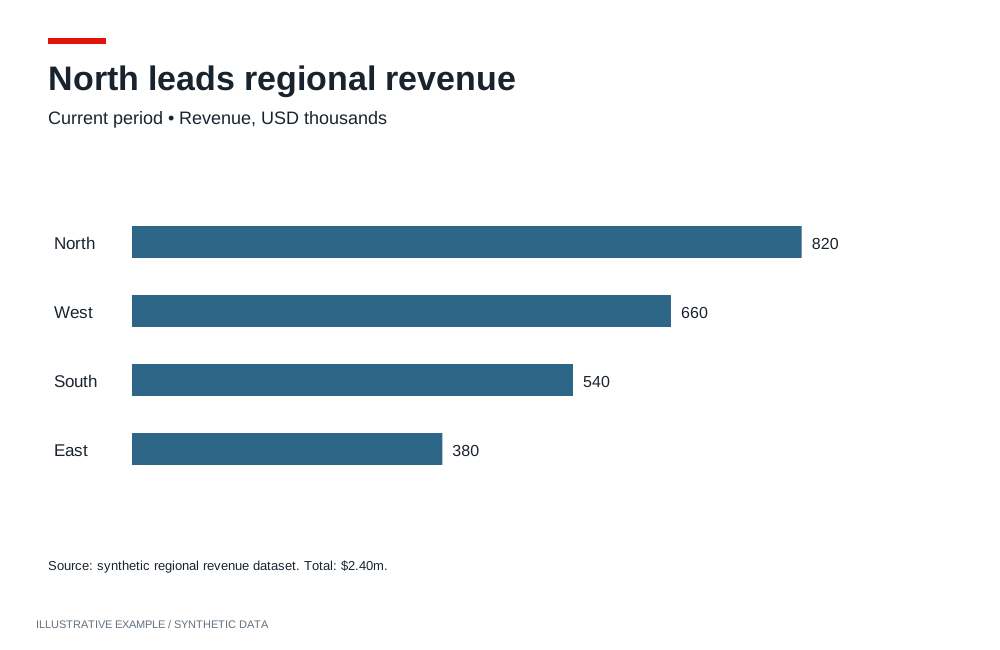
Illustrative example with synthetic data. A short red rule and compact editorial hierarchy.
When to use the Economist style
Section titled “When to use the Economist style”Use it when each chart makes one point that a reader gets from the title alone: briefings, market and economic commentary, and reports that are printed or pasted into slides.
| The page is mainly | Use instead |
|---|---|
| The same finding-as-title charts on a salmon ground | Financial Times |
| A presentation that leads to one decision | Storytelling with data |
| Indicators read beside prose | Explainer |
| Many items compared at a glance, colour carrying categories | Information is Beautiful |
| A long narrative read by scrolling | Visual essay |
| A dashboard that looks like the tenant’s Workbooks | Astrato default |
Use cases
Section titled “Use cases”| Use case | What the page shows |
|---|---|
| Monthly economic briefing | Inflation, unemployment and rates as small line charts, each titled with its finding |
| Market commentary | An index against a benchmark, the benchmark in the lighter blue |
| Country or region comparison | Horizontal bars sorted by value |
| Board or investor report | A few charts per page, each with a source line so it can be lifted out |
Tokens
Section titled “Tokens”Define the tokens once and redefine them for dark; see Define colour tokens.
Open in light, whatever the system preference: the style is drawn on a white ground. Offer dark through the theme toggle, and let only the reader’s saved choice override the default.
:root {  --page: #ffffff;  --surface: #ffffff;  --ink: #121212;  --muted: #5c5c5c;  --line: #cfd6db;  --rule: #d7141a;
  /* Series, in order of use. */  --series-1: #0f5c91;  --series-2: #2f8fc4;  --accent-red: #d7141a;  --accent-teal: #17857a;
  --font-title: 'Fira Sans Condensed', 'Arial Narrow', sans-serif;  --font-body: 'Fira Sans', Arial, sans-serif;
  --space-1: 4px;  --space-2: 8px;  --space-3: 16px;  --space-4: 24px;}:root[data-theme='dark'] {  --page: #14181c;  --surface: #14181c;  --ink: #eef1f3;  --muted: #a3adb6;  --line: #39424a;  --rule: #ff4a42;
--series-1: #4ea6e0; --series-2: #8ccbef; --accent-red: #ff5c54; --accent-teal: #3cc2b3;}- Fonts. Fira Sans and Fira Sans Condensed are openly licensed and served by Google Fonts; see Load visualization fonts.
- Series order.
--series-1for the main measure,--series-2for a comparison,--accent-redfor the measure the title is about,--accent-tealfor a third. - Figures. Use
font-variant-numeric: tabular-numswherever figures stack in a column.
Page and card chrome
Section titled “Page and card chrome”No card borders, fills or shadows; space separates charts. Each chart carries a red tag, a title,
a subtitle, the chart and a source line. The Card supplies
structure; load this CSS after the Card’s, because .chart replaces its top padding and background
to draw the tag.
<figure class="chart"> <figcaption> <h2 class="chart-title">Inflation has fallen below target</h2> <p class="chart-subtitle">Consumer prices, % change on a year earlier</p> </figcaption> <div class="chart-host"></div> <p class="chart-note">Source: national statistics office</p></figure>:root { /* The Card's tokens; see /app-components/object-frame/#css. */ --panel-border: 0; --radius: 0; --panel-shadow: none; --frame-pad-x: 0px; /* 1px more than the Card's 6px, because there is no border. */ --frame-pad-y: 7px; --frame-title-h: 24px; --frame-subtitle-h: 18px; --frame-note-h: 16px; /* The 6px tag and 8px below it. */ --tag-h: 14px; /* 7 + 14 + 24 + 18 + 7 = 70px of card around a 200px plot. */ --chart-min: 270px;}
body { background: var(--page); color: var(--ink); font-family: var(--font-body);}.chart { padding-top: calc(var(--frame-pad-y) + var(--tag-h)); background: linear-gradient(var(--rule), var(--rule)) left var(--frame-pad-y) / 40px 6px no-repeat, var(--surface);}.chart-title { font-family: var(--font-title); font-weight: 700; font-size: clamp(15px, 3.6cqi, 20px);}.chart-subtitle { font-family: var(--font-body); font-size: clamp(13px, 3cqi, 16px);}.chart-note { font-family: var(--font-body); font-size: 12px;}- Set font longhands only; a
fontshorthand resetsline-heightand moves the text out of its row. --chart-minis 18px more than the Card’s default and the source line adds 16px: 286px per card. Add the difference per chart row to the scrolling threshold; see Calculate a scrolling threshold.
Charts
Section titled “Charts”Read token values from script, pass them as payloads, and re-apply them when the theme changes; see Switch themes in place.
Axes, bar and line
Section titled “Axes, bar and line”The axis operations take an axisName; bar and line use dimension and primaryMeasure. Other
axis types publish the same operations with their own axis names; check the type’s operations page.
| Setting | Operation | Value |
|---|---|---|
| No line or ticks on the value axis | setShowAxisLine, setShowAxisTicks |
primaryMeasure: false |
| A baseline on the category axis | setShowAxisLine, setAxisLineColor |
dimension: true, --ink |
| Axis labels | setAxisLabelColor |
Each axis: --muted |
| No axis titles; the subtitle states the unit | setShowAxisTitle |
Each axis: false |
const token = (name: string) => getComputedStyle(document.documentElement).getPropertyValue(name).trim();
const axisOperations = [  { name: 'setShowAxisLine', payload: { axisName: 'primaryMeasure', showAxisLine: false } },  { name: 'setShowAxisTicks', payload: { axisName: 'primaryMeasure', showAxisTicks: false } },  { name: 'setShowAxisLine', payload: { axisName: 'dimension', showAxisLine: true } },  { name: 'setAxisLineColor', payload: { axisName: 'dimension', lineColor: token('--ink') } },  ...(['dimension', 'primaryMeasure'] as const).flatMap((axisName) => [    { name: 'setAxisLabelColor', payload: { axisName, labelColor: token('--muted') } },    { name: 'setShowAxisTitle', payload: { axisName, showAxisName: false } },  ]),];
Check each result; see Check operation results.
Bar and line
Section titled “Bar and line”| Type | Setting | Operation | Value |
|---|---|---|---|
| Bar | Horizontal bars for ranked categories | setBarChartOrientation |
horizontal |
| Bar | Square bar ends | setBarChartBarRadius |
0 |
| Bar | One measure’s colour | setColoringColor |
--series-1 |
| Bar | Values on the bars instead of a value axis | setMeasureDataLabelsShow, setShowAxisLabels |
true; primaryMeasure: false |
| Bar | Sort by value | setSortingDirection |
descending on the measure |
| Bar, line | Colour per measure | setMeasureGraphColor |
The series tokens in order |
| Line | Straight segments | setLineType |
straight |
| Line | Line weight | setMeasureLineSize |
strokeWidth: 2 for the main measure, 1.5 for comparisons |
| Line | Fewer value labels, in the series colour | setMeasureDataLabelsShow, setMeasureDataLabelDensity, setMeasureDataLabelIsColored |
true, low, true |
A line split by a second dimension colours by category from the palette:
setCustomPaletteColors with the series
tokens. Colours follow domain order or a hash, not the category value; see
Styling and theming.
Legend, number and table
Section titled “Legend, number and table”| Setting | Operation | Value |
|---|---|---|
| No legend when the subtitle names the series | setLegendEnabled |
false |
| Legend above the plot, otherwise | setLegendPosition, setLegendItemLabelFill |
top, --ink |
| Number figure | setNumberFontFamily, setNumberFontWeight, setNumberFontColor |
Fira Sans Condensed, 700, --ink |
| Table: horizontal dividers only, no outer border | setTableColumnBorders, setTableBorderEnabled |
showHorizontal, false |
| Table: divider colour | setTableColumnBorderColor |
--line |
| Table: fonts and bold header | setTableHeaderFontFamily, setTableBodyFontFamily, setTableHeaderFontStyle |
Fira Sans; { "bold": true } |
Titles, labels and annotation
Section titled “Titles, labels and annotation”- Title. State the finding: “Inflation has fallen below target”, not “Inflation, 2020–2025”.
- Subtitle. Measure, unit and scope: “Consumer prices, % change on a year earlier”.
- Source. One line at the bottom left in
--muted, starting “Source:”. - Series names. With the legend off, name each measure in the subtitle in its token colour:
<span style="color: var(--series-1)">Euro area</span>.
Contrast
Section titled “Contrast”WCAG ratios against --surface, from Measure contrast. Text
needs 4.5:1, series 3:1; --line is checked against the 1.4 surface guide.
| Token | Light | Ratio | Dark | Ratio |
|---|---|---|---|---|
--ink |
#121212 |
18.73 | #eef1f3 |
15.73 |
--muted |
#5c5c5c |
6.69 | #a3adb6 |
7.82 |
--line |
#cfd6db |
1.47 | #39424a |
1.74 |
--rule |
#d7141a |
5.24 | #ff4a42 |
5.36 |
--series-1 |
#0f5c91 |
7.09 | #4ea6e0 |
6.67 |
--series-2 |
#2f8fc4 |
3.59 | #8ccbef |
10.11 |
--accent-red |
#d7141a |
5.24 | #ff5c54 |
5.87 |
--accent-teal |
#17857a |
4.49 | #3cc2b3 |
8.12 |
In light, --series-2 and --accent-teal pass for graphics but not text; label them in --ink.
Not available
Section titled “Not available”See App limitations: no colour for a named category value, so the one country a title is about cannot be picked out in red; no gridline styling; the value axis cannot move; chart text stays in Roboto; no annotations or reference lines in the plot.
Use line-end labels on vertical, unstacked line charts.
Pairs well with
Section titled “Pairs well with”Related
Section titled “Related”- Theming: tokens, dark theme, fonts and chart palettes.
- Visualization operations: every operation per chart type.
- Size type against the object.