

What's new in Astrato
Next release
Section titled “Next release”Improvements
Section titled “Improvements”Publish a Data App straight into a collection
Section titled “Publish a Data App straight into a collection”Before: a published Data App had to be added to a collection afterwards from the Apps page.
Now: choose a collection when you publish in App Builder, or pass --collection to astrato publish. You need edit access to the collection. If the add is refused, the app still publishes and you are told to add it from the Apps page.
Business question suggestions open on their own and create what they need
Section titled “Business question suggestions open on their own and create what they need”Before: a semantic layer with no business questions showed an empty page until you opened Suggestions. You used suggestions one at a time, added each measure a suggestion needed yourself, and saw few period-over-period comparisons.
Now: on a layer with no business questions, the Questions tab opens the Suggestions panel on its own, as the Measures and Dimensions tabs do. Suggestions include period-over-period comparisons. Check the ones you want and click Create selected: each question is created with the measures and dimensions it needs, in the editor and through MCP.
Get suggestions from your data
Choose where Nash takes your app request
Section titled “Choose where Nash takes your app request”Before: when Nash had an app request ready, it showed a plain Open Builder button, and in some cases moved you to Builder without asking.
Now: Nash shows a Continue in Astrato Data App Builder card. It carries on into Builder in the same tab after five seconds unless you choose first: Stay in chat to keep talking to Nash, Continue in Builder (or Enter) to go now, or the new-tab button to open Builder beside the chat. Hovering over the card or pressing a key stops the countdown, and only a request that has just arrived ever counts down.
Nash checks what an app says, not only how it looks
Section titled “Nash checks what an app says, not only how it looks”Before: a comparison could appear under a figure it did not describe, a page could show 0% where there was no earlier period to compare with, and a caption could claim something the page did not do. A chart Nash added could also dim when clicked, with no way to clear it.
Now: when Builder can capture the preview, Nash reads each label and sentence against what the page shows; when it can’t, Nash reports that check as pending. It checks a comparison on the view the page opens on and on periods with missing or partial earlier data, and the app leaves the comparison out or says why when there is no complete earlier period. A chart Nash adds comes with a visible way to clear a click.
Apps built with Nash are fuller and look designed
Section titled “Apps built with Nash are fuller and look designed”Before: a short request could produce a thin dashboard, and apps built in App Builder tended to share one generic look: a heading, a row of KPI cards and charts in default colours.
Now: Nash works out what your data can answer and covers it, even from a short request, and builds straight away. Name exactly what you want and it builds that, then suggests what else the data could show. On a very large semantic layer, it tells you what the dashboard leaves out. It designs each app around the decision it serves, with its own layout, palette and type, and checks the result in the preview, or tells you that check is still pending when no screenshot is available. When the semantic layer has no business questions for a dashboard’s analyses, Nash saves a few to the draft alongside the app and names them, ready to reuse once you publish. Publishing stays with you.
Nash finishes its App Builder work with an answer
Section titled “Nash finishes its App Builder work with an answer”Before: In a This device only chat without browser-private recovery, Nash could keep checking and polishing an app until its connection ended, so a request it had already done could stop at Connection lost with no summary. In any chat, a summary could also appear and then disappear while Nash made a last check.
Now: Nash checks the result while there is still time to fix what it finds. In a This device only chat without browser-private recovery, when time runs short it stops starting new work and tells you what it finished, what it checked and what is left. In every chat, a summary stays on screen until the updated one replaces it. Nash also works on the desktop layout unless you ask for tablet or phone widths.
The Library remembers your status tab and sorting
Section titled “The Library remembers your status tab and sorting”Choose Published, Drafts or another status tab in the Library, and it opens again when you reload the page. Your chosen sort order is also restored. Supported choices from the earlier lobby are kept; an unsupported sort shows Newest first until you choose a new sort.
Nash checks more of your app before it reports
Section titled “Nash checks more of your app before it reports”Before: Nash checked only the page on screen and could not click a chart, so a broken page or a blank drill result could go unnoticed.
Now: after a change that reaches several pages, Nash opens each affected page once before it reports, and says which pages it did not get to. It can also click a chart mark to test a drill it built.
Nash finds a saved question by its name
Section titled “Nash finds a saved question by its name”Before: when you asked Nash for a saved business question, it read through every question on the semantic layer first, which was slow on layers with many questions.
Now: type the name of a saved business question, or something close to it, and Nash finds it straight away. Case, punctuation, a missing question mark and a small typo do not stop it finding the question. When the name clearly matches one question and you ask for nothing more, Nash runs it at once. If you add something, such as another breakdown or a different period, Nash checks the question first. Connected AI assistants can search questions the same way.
28 October 2026
Section titled “28 October 2026”Turn recurring questions into reusable analysis
Section titled “Turn recurring questions into reusable analysis”Some questions come back every week: which products tie up the most stock, how revenue changed year over year, which customers matter most. The measures may already be defined, but someone still has to choose the population, the calculation, the ranking, the groups and the period to compare.
This release lets you keep that work in the semantic layer, so the next time a question comes up you start from the analysis you already defined.
In this release
- New: Business Questions, Set Filters, Custom groups dimensions, Time intelligence
- Improved: Advanced calculations and Top N ranking now work inside business questions
New capabilities
Section titled “New capabilities”Business Questions
Section titled “Business Questions”Save the questions your business asks again and again, with the answer built in. Anyone who opens the question, and Nash when someone asks it, gets the same numbers worked out the same way.
Where: open a semantic layer, then Business Context → Questions, and select Add.
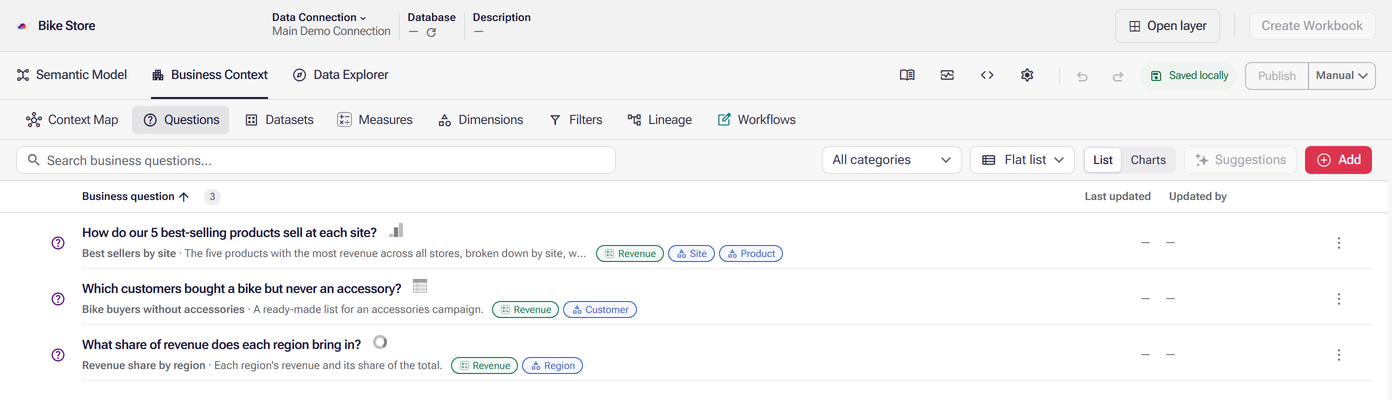
- Define the answer once. Give the question a name, write it the way people would ask it, then pick the measures, the breakdown, the sorting and the chart that shows it best.
- Or start from Nash. Ask Nash a question in the semantic layer editor. If the answer is one you’ll need again, select Save as business question under it. It keeps everything Nash used to answer, including its measures, breakdown and filters.
- Open it any time. Select Explore on a question to open it in Data Explorer with live data, drawn as the chart you chose, with the question as its title.
- Build on it. After you create a question, Astrato can suggest related follow-up questions, and every change is kept in the question’s history.
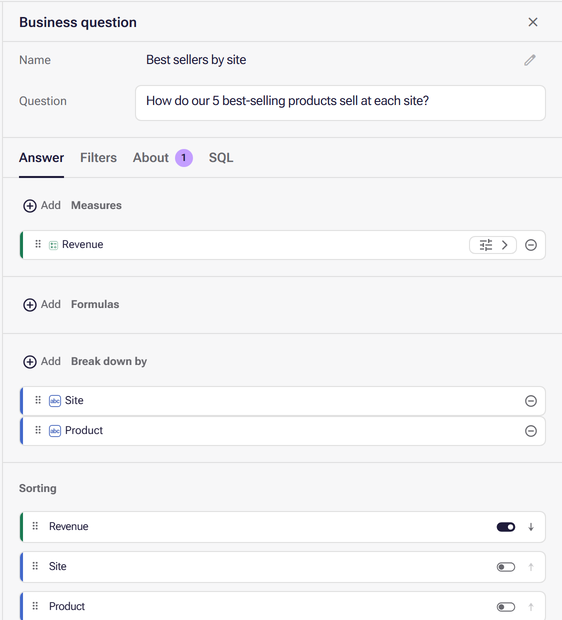
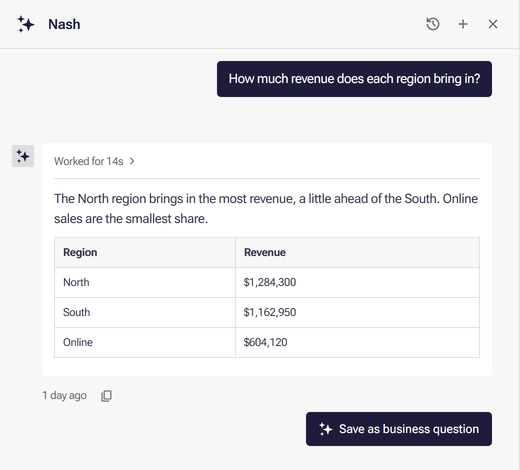
Saving and publishing are separate: a question is saved with the layer’s draft, and is available to others once you publish the layer.
Set Filters
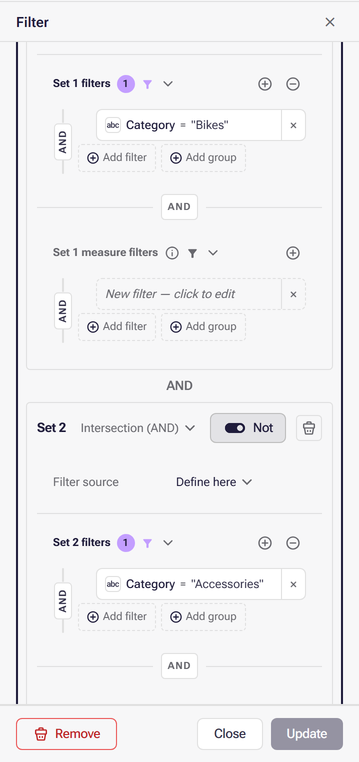
Section titled “Set Filters”Define the exact group of things a question is about, such as customers who bought Bikes but never Accessories, and reuse it by name.
How it differs from a regular filter: a regular filter keeps rows, such as sales in EMEA. A set filter keeps a set of values, such as the customers whose lifetime sales are over 3,000, by looking at their related records. You build it from one or more sets of conditions, combined with Intersection (AND) or Union (OR). Not keeps everything that does not match.
Where: Business Context → Filters, then Add → Set filter. Store it once, then use it in any question that needs it.
Custom groups dimensions
Section titled “Custom groups dimensions”Break your numbers down by the groups your business actually uses. A custom groups dimension turns the values of a field into named groups, such as order sizes into “One unit”, “Two units” and “3–4 units”, or sites into regions. Rules are read from the top down, and anything that matches no rule falls into a fallback group. Every question can then break down by the same groups.
Select Show distribution to preview how many rows fall into each group before you save, so you can see straight away whether a rule catches too much or too little.
Where: Business Context → Dimensions, then Add → Custom groups.
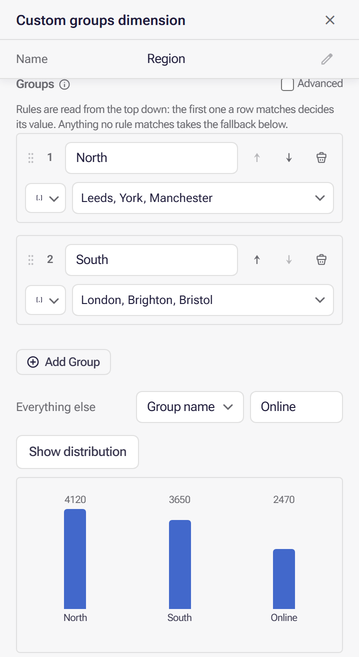
Create a dimension in Business Context
Time intelligence
Section titled “Time intelligence”Build period comparisons into a measure, so every question compares time the same way.
A time intelligence measure takes an existing measure and a date field, then lets you choose:
- Which period: follow the date field’s own period, and count from the latest date in your data.
- What to compare against: the previous period, or a period you set with an offset.
- How to show it: the value for the current period, the value for the prior period, the difference, the ratio, or growth as a percentage.
- How to line dates up: for example, by the same calendar date.
Where: Business Context → Measures, then Add → Time intelligence measure, or turn on Time Intelligence in an existing measure. To define a reporting window once, such as year to date by month, and reuse it across questions, add a Time intelligence axis under Business Context → Dimensions → Add.
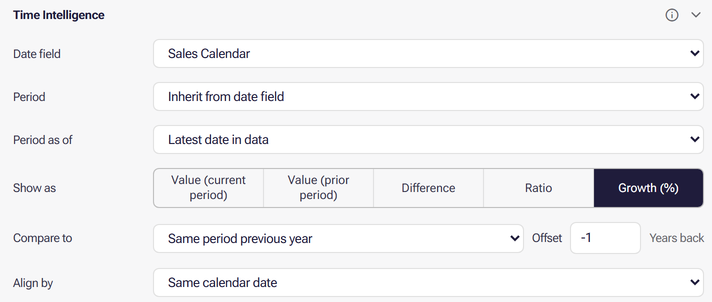
For example, Revenue YoY Growth shows revenue growth against the same period last year. Any question that uses it, whether a person asks it, Nash answers it or a connected AI assistant runs it, gets the same comparison.
It follows your selection. With Period as of set to Latest date in data, the period is anchored on the latest date in what is currently selected, not on today. Select a date in the previous year and Revenue YoY Growth compares that year with the year before it, and so on for any year you pick. You don’t need a separate measure for each year.
Improvements
Section titled “Improvements”Advanced calculations, saved with the question
Section titled “Advanced calculations, saved with the question”Before: moving calculations, running totals, ranks and comparisons to the total were set on each chart in a workbook. To reuse one, you set it up again.
Now: each measure in a business question can carry the calculation itself: a moving calculation, a running total or running rate, a rank, a total, or Compare to total, for example each region’s share of revenue. You can also work a measure out at a finer level first with Nested dimensions, for example revenue per customer averaged by region, and combine answers under Formulas.
Where: in a business question, select Advanced calculation settings, the button beside a measure.
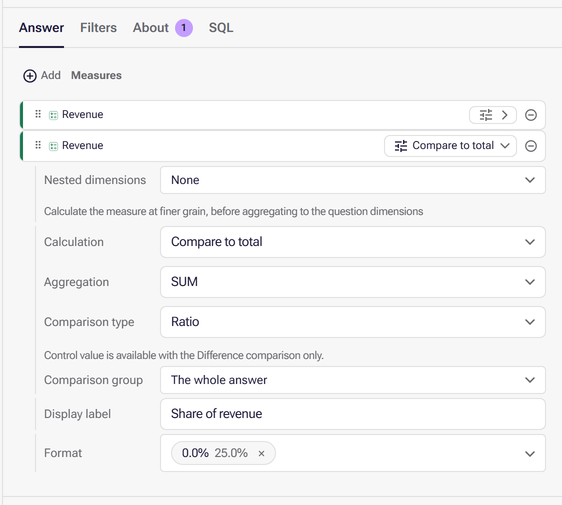
The calculation is saved with the question, so it comes back every time the question is opened, whether by a person, by Nash or by a connected AI assistant.
Top N ranking in business questions
Section titled “Top N ranking in business questions”Before: Top N ranking was available on workbook charts.
Now: you can also rank inside a business question, so the ranking is saved with the question. Turn on Show Top N dimension values, choose the Rank measure and whether to Keep the Highest or Lowest values.
Where: in a business question, Answer → Limiting.
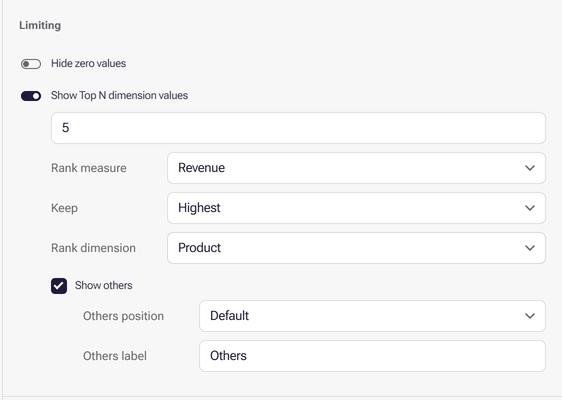
With more than one dimension, Rank dimension decides what is ranked:
- Within all other dimensions keeps the top values in each group, for example the top 5 products at each site.
- A dimension you choose keeps its top values across everything else, for example the 5 best-selling products overall, shown at every site.
- Rank each dimension individually ranks each dimension on its own.
Select Show others to add a row for everything outside the top N. Values that tie at the cutoff are all kept.
4.22 - 26 October 2026
Section titled “4.22 - 26 October 2026”See and revoke the apps connected to your account
Section titled “See and revoke the apps connected to your account”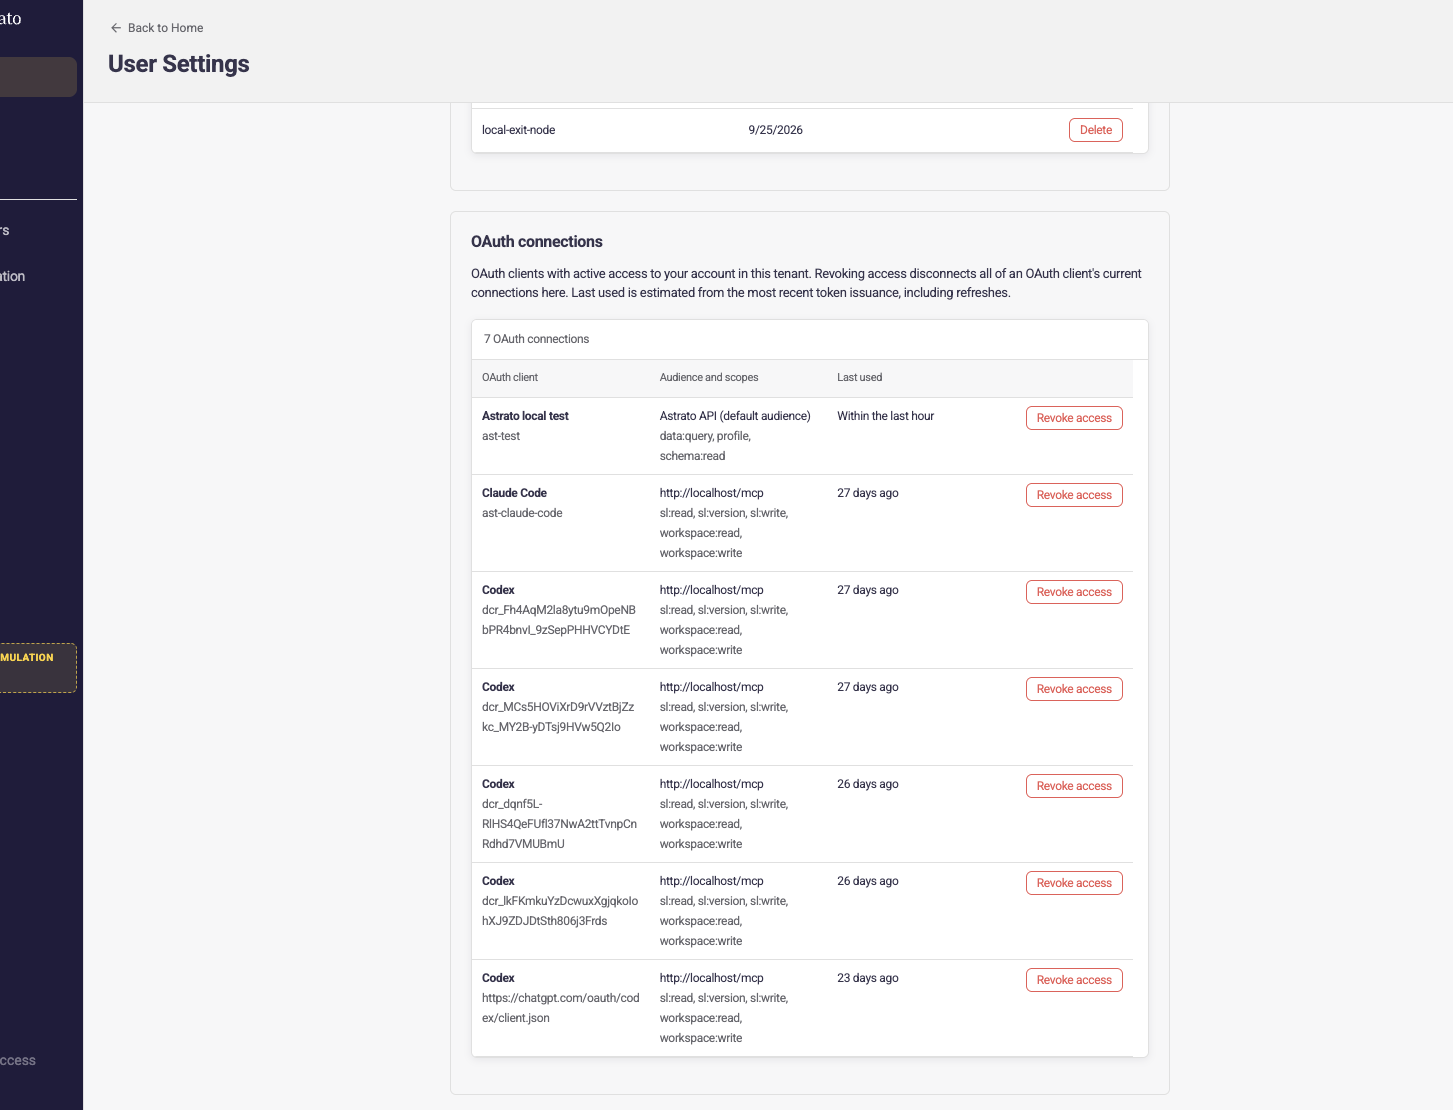
A new OAuth connections section in User Settings lists every app or tool that currently has access to your Astrato account in this workspace, for example an AI assistant you connected to Astrato, or the Astrato command-line tool.
For each one you can see its name, what it has been allowed to access, and roughly when it last used that access. Revoke disconnects it from this workspace. To use it again, connect it again.
This gives you a simple way to review and tidy up which tools can act on your behalf.
Where: open your account menu and choose User Settings → OAuth connections. The section appears once at least one app is connected.
Faster queries on the semantic layer
Section titled “Faster queries on the semantic layer”Every query to the semantic layer used to repeat the same setup work before it was sent to your warehouse, such as unlocking the connection’s credentials and rebuilding the model’s metadata. That work never changes between queries, so Astrato now keeps it ready instead of redoing it each time.
This removes a fixed delay from every query, which is most noticeable when your warehouse answers quickly, for example from its own cache. Charts, workbooks and AI answers built on the semantic layer return faster as a result.
Faster lobby loading with cached cover images
Section titled “Faster lobby loading with cached cover images”Cover images for workbooks and collections were downloaded in full on every visit to the lobby, which could mean hundreds of images and several megabytes each time.
In busy workspaces, reloading a few times could also hit a request limit and show “Workbooks unavailable”.
Your browser now keeps these images and only downloads one again when it has actually changed, so the lobby loads faster and that error is much less likely to appear.
4.21.2 - 22 October 2026
Section titled “4.21.2 - 22 October 2026”The new Lobby
Section titled “The new Lobby”A new home for your work. Nash from the very first click.
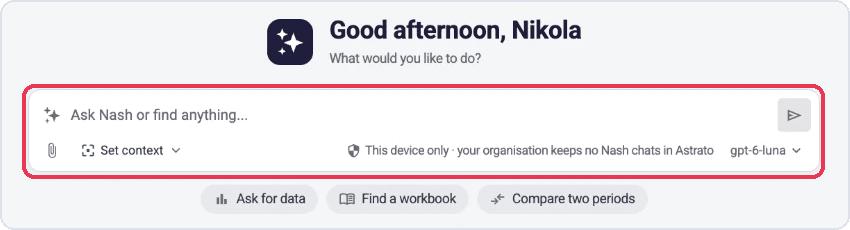
The new Lobby is the new home of your Astrato workspace. If you already use Astrato, it puts everything you work on in one place. If you’re new, Nash is the first thing you see when you sign in.
Start from one box
Section titled “Start from one box”- Search for anything or ask Nash from the same box at the top of Home.
-
See where the answer lives. Results are grouped into Analytics, Business data and Chats.
-
Pick up where you left off, with what you were building, recent chats, recently published work and upcoming scheduled Nash tasks.
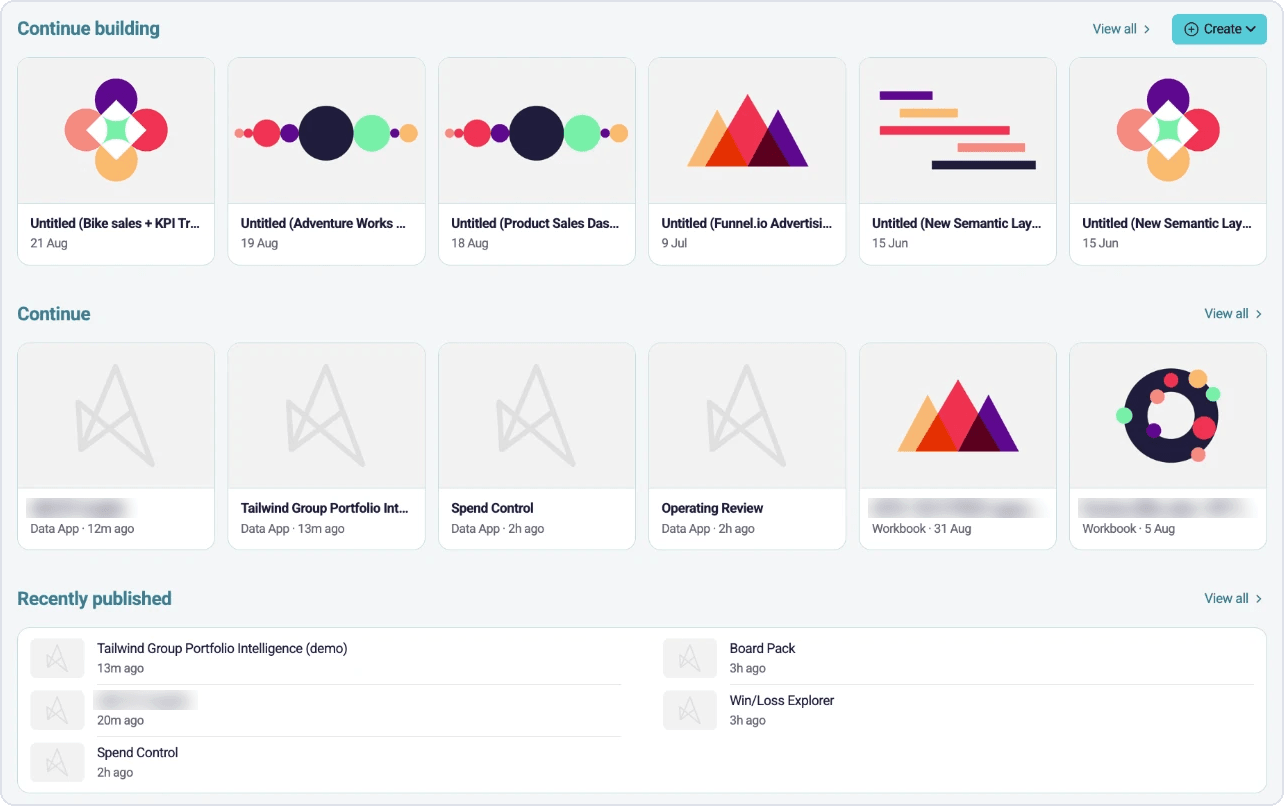
- Set up new workspaces faster. Owners and administrators get a Set up your workspace checklist on Home.
Keep Nash with you
Section titled “Keep Nash with you”- Nash sits at the top right of every page, and its panel stays open as you move around.
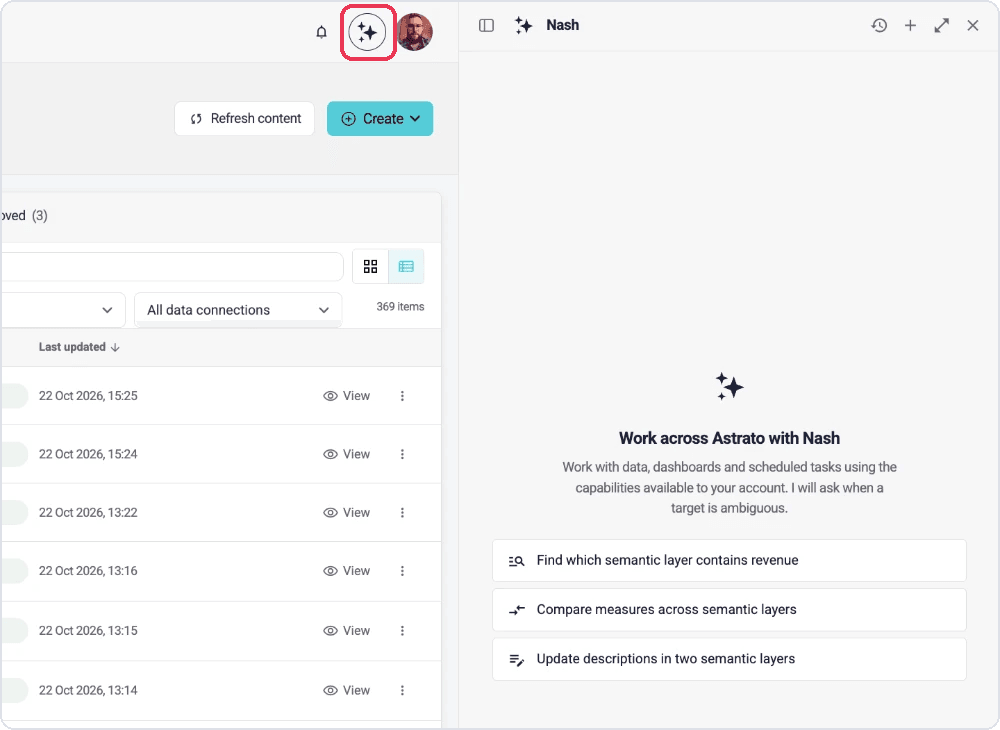
- Open full Nash to move the conversation onto Home when you want more room.
One home for your work
Section titled “One home for your work”- One Analytics section for your workbooks, with List view and Grid view, collections, tabs and bulk actions.
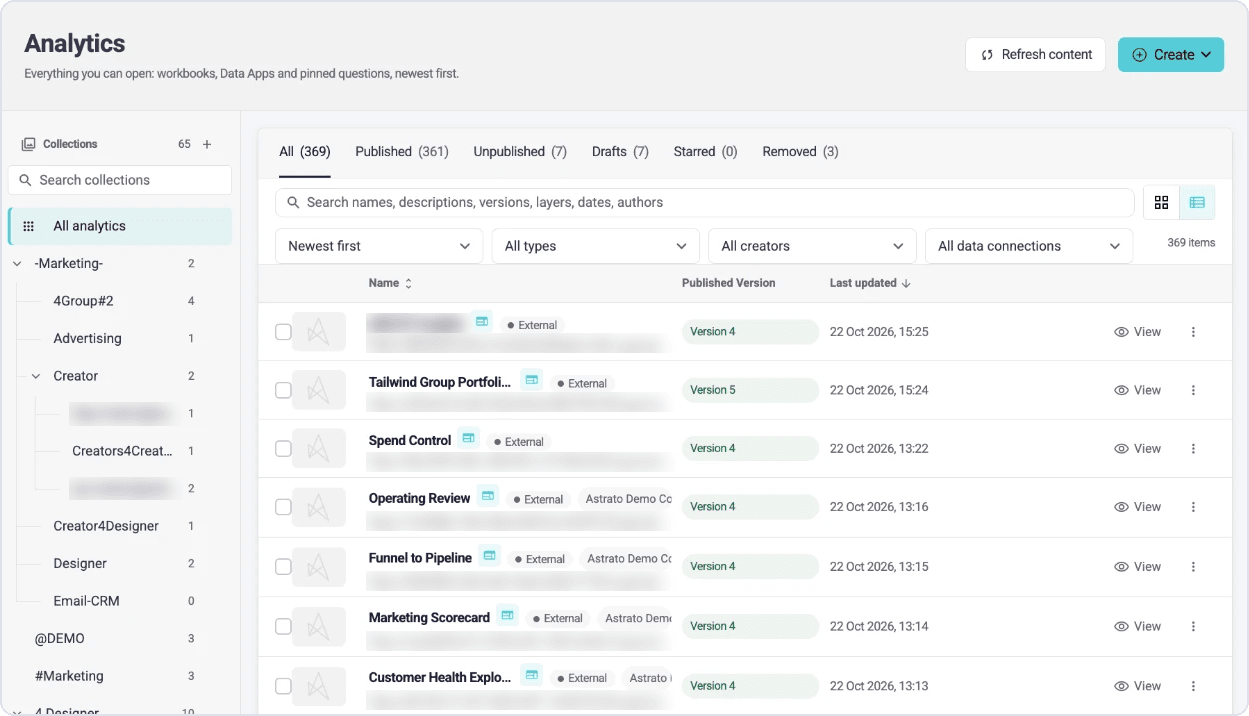
- Administration in the Lobby, for owners and administrators: Users, Groups, License Teams, Embed Links, Media, 3rd Party Integrations, System Settings and more.
Switching between Lobbies
Section titled “Switching between Lobbies”Prefer the old Lobby for now? Open your account menu and choose Switch to old lobby, where your workspace offers it.
Find it, continue it, or ask Nash. All from one home.
Learn more
Section titled “Learn more”- Get started with the new Home and navigation
4.21.1 - 20 October 2026
Section titled “4.21.1 - 20 October 2026”Snowflake Semantic Views in Astrato
Section titled “Snowflake Semantic Views in Astrato”Define it in Snowflake. Put it to work in Astrato.
If your team already describes its business in Snowflake Semantic Views (which tables join, what “revenue” means), you no longer have to rebuild that in Astrato. Import a view and its tables, joins, dimensions and measures become a semantic layer that Nash, Data Explorer and your workbooks can use straight away. Astrato keeps track of the view, so you can see when it changes in Snowflake and choose whether to take the change.
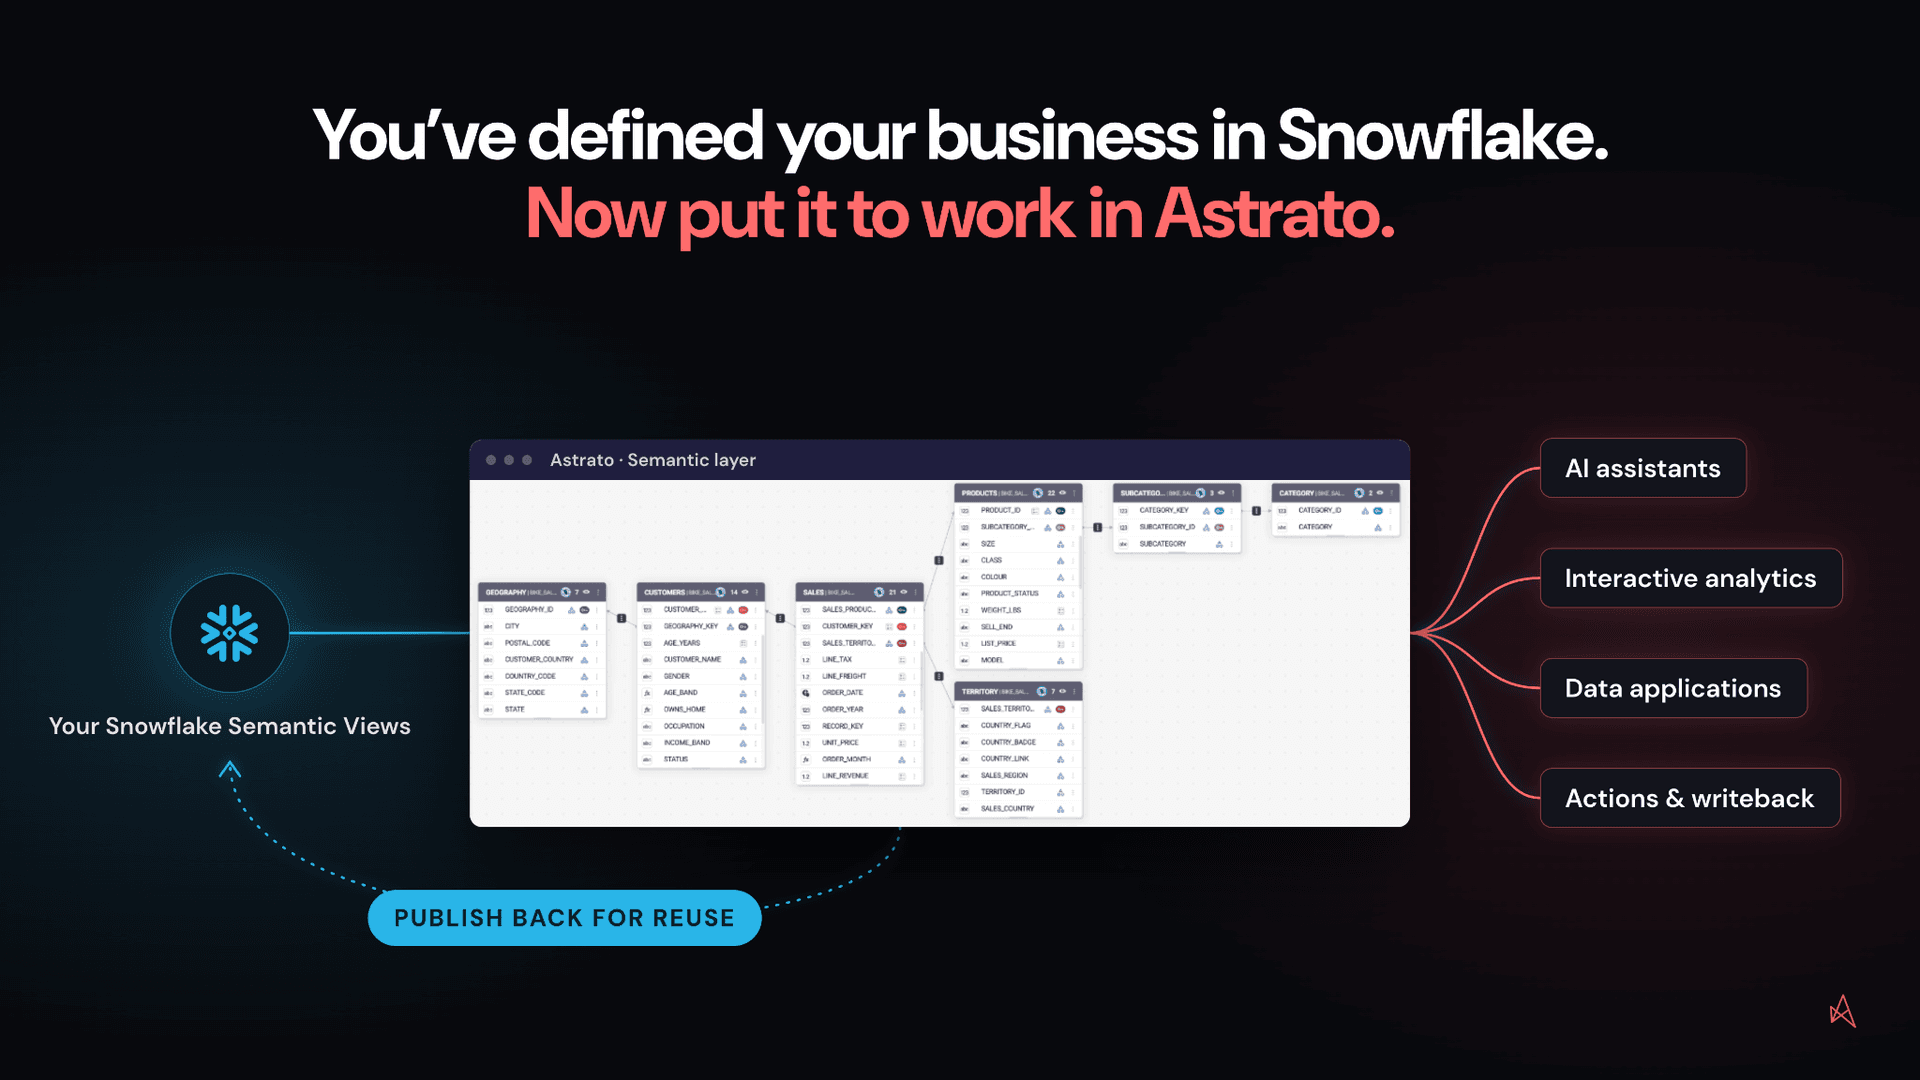
Where: Data & AI → Semantic Layers, select Create, then Snowflake Semantic View. The entry appears when your workspace has a Snowflake data connection.
Start from Snowflake
Section titled “Start from Snowflake”-
Bring in your existing Snowflake Semantic Views without recreating business definitions.
-
See what came from Snowflake. Each imported item shows the semantic view it came from.
-
Stay informed of upstream changes. When the view changes in Snowflake, a banner says what changed, and Review changes lets you accept or skip each one.
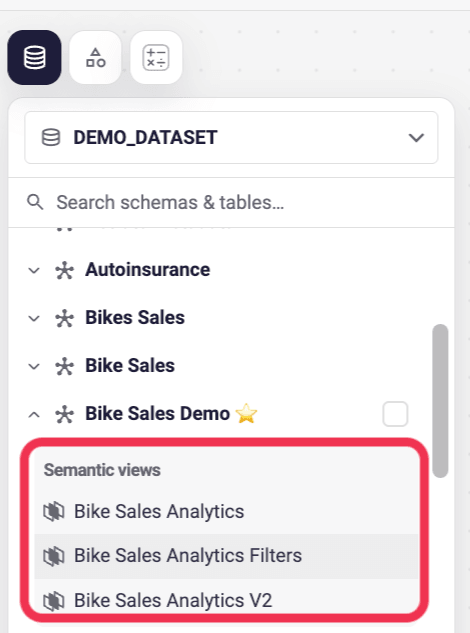
The data browser in Astrato, listing Snowflake semantic views above a schema’s tables
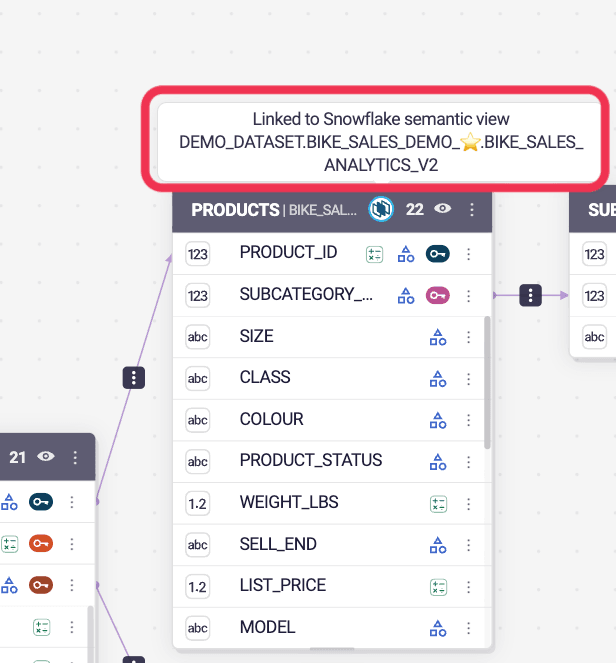
An imported table in Astrato showing that it is linked to its Snowflake semantic view
Extend it in Astrato
Section titled “Extend it in Astrato”Add what the Snowflake view doesn’t have: new calculations, extra dimensions, business questions and descriptions. Changes are checked before you publish, and you can trace where each item comes from.
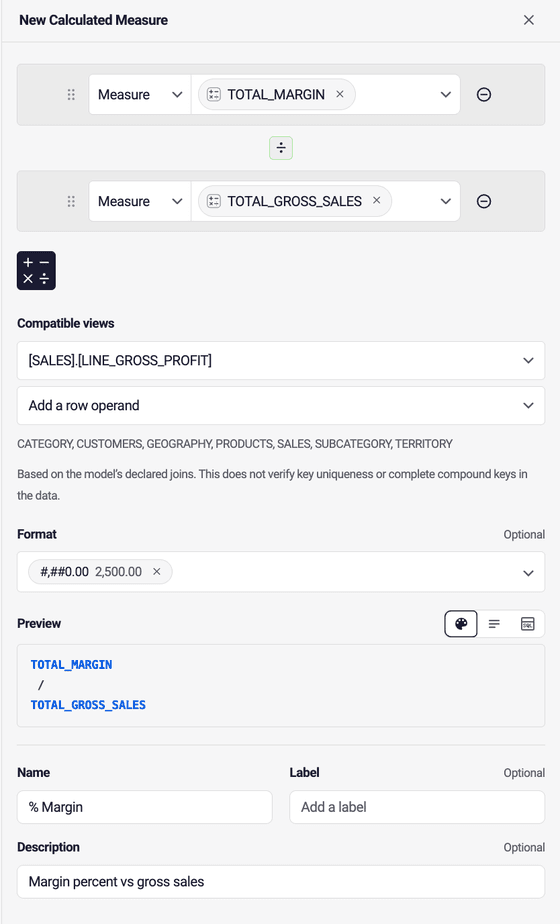
A new calculated measure being built in Astrato from two measures that came from a Snowflake semantic view
Then put those definitions to work across:
-
AI assistants. Ask business questions through Nash, or through an AI assistant connected to Astrato, and get answers based on the same definitions.
-
Interactive analytics. Explore performance, investigate drivers and answer follow-up questions.
-
Actions and writeback. Move from analysing business performance to taking action directly within your workbooks.
Take it back to Snowflake
Section titled “Take it back to Snowflake”Download your semantic layer, including what you added in Astrato, as the SQL that creates a Snowflake semantic view. You or your Snowflake team review the SQL and run it in Snowflake, so other Snowflake tools can use the same definitions. Astrato does not change anything in Snowflake itself.
Tables, joins, field and custom groups dimensions, descriptions and most measures come across. Some Astrato features have no Snowflake equivalent and are left out, such as time intelligence axes, period comparisons, bucket dimensions and display formats. Astrato lists what will be left out before the file downloads.
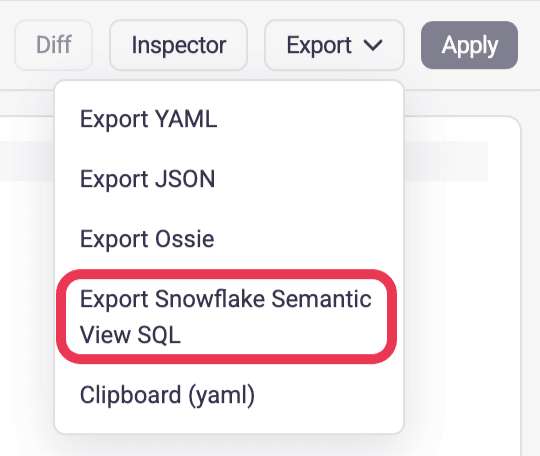
The Export menu in Astrato, with the option to export Snowflake Semantic View SQL
Where: open the semantic layer, select Dev to open Developer View, then Export → Export Snowflake Semantic View SQL.
Learn more
Section titled “Learn more”4.21 - 15 October 2026
Section titled “4.21 - 15 October 2026”New “Data Set” variable type
Section titled “New “Data Set” variable type”Embed measure values inside Text objects the clean way. A new “Data Set” variable type lets a Text object reference measures from a workbook-level dataset directly, replacing the fragile workaround of off-screen tables pushing values into variables through actions.
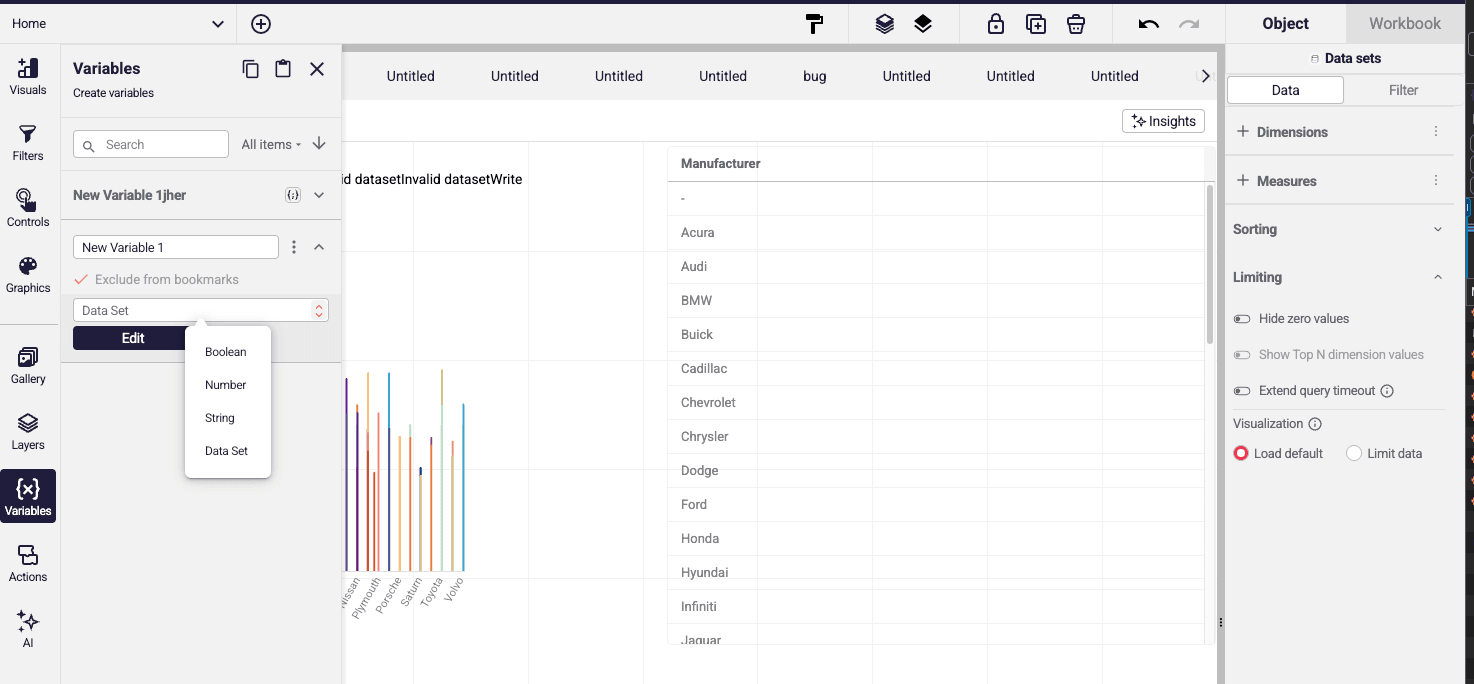
Put live Astrato screenshots into Excel reports
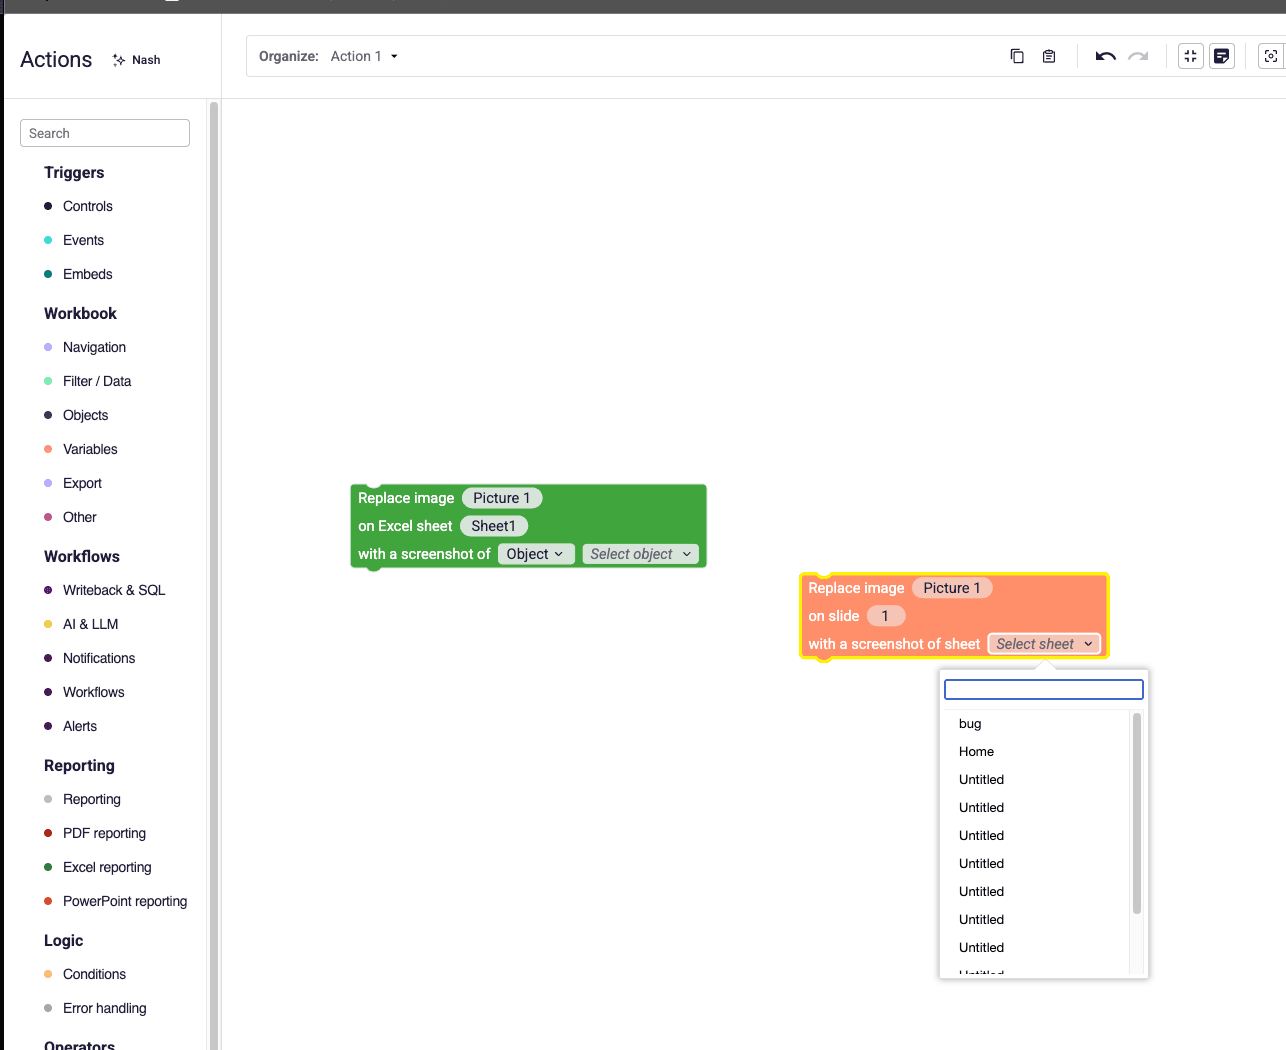
Section titled “Put live Astrato screenshots into Excel reports”Excel report templates have two new blocks that replace a placeholder image with a screenshot of an Astrato object or a whole sheet. Image size follows the placeholder and your report’s resolution settings, so charts drop into your existing layouts.
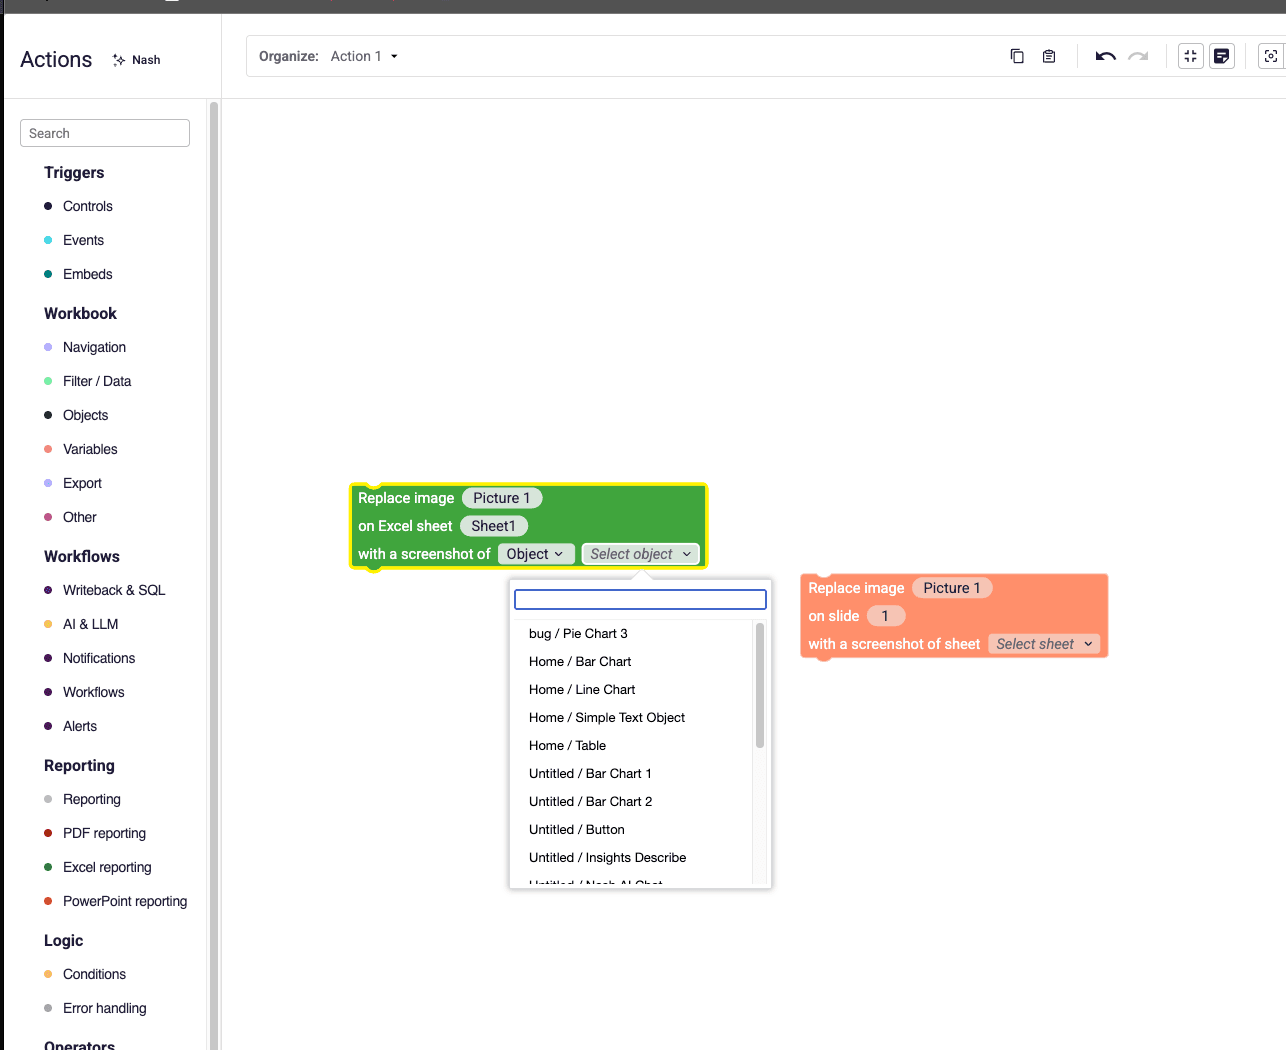
Fallback login for people outside your SSO domains
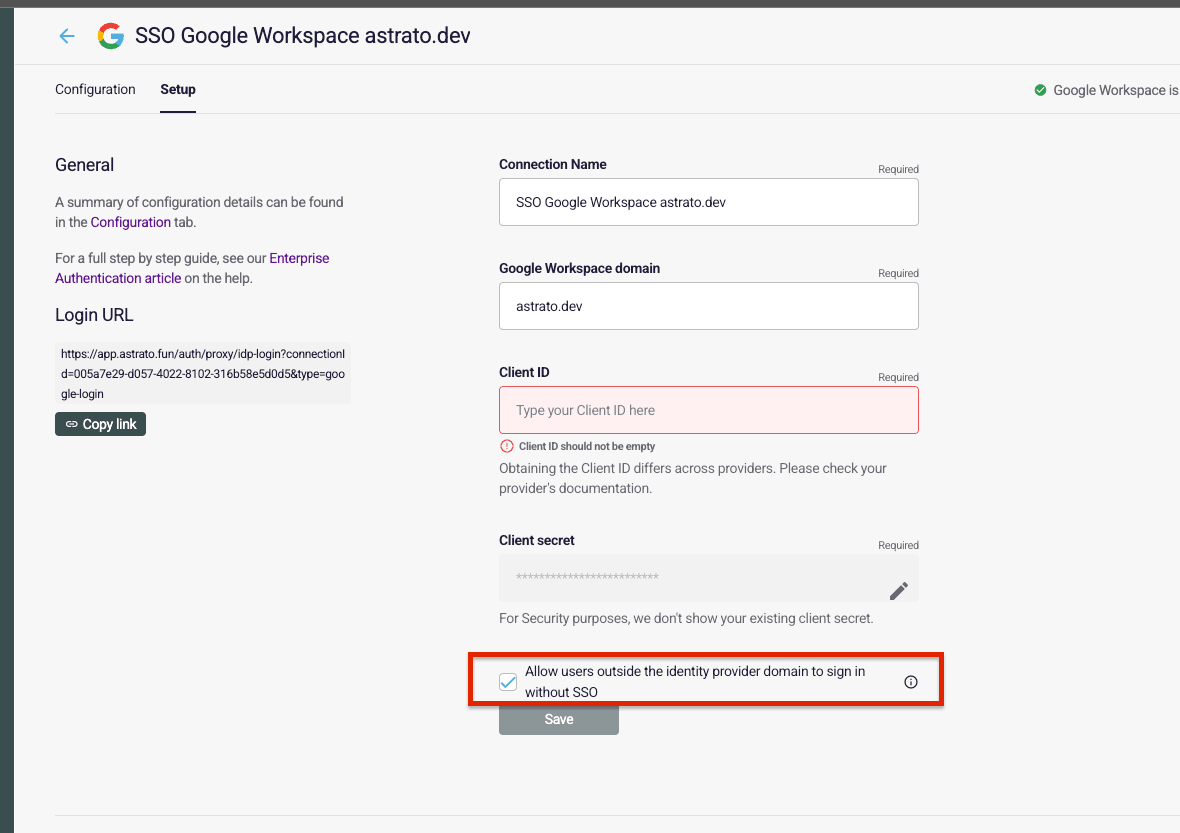
Section titled “Fallback login for people outside your SSO domains”A new Fallback Login option in SSO settings lets people whose email domain isn’t on your identity provider’s list sign in with a username and password instead of being blocked. Useful for contractors, partners and organisations with more than one email domain. It works with every SSO provider.
4.20.1 - 07 October 2026
Section titled “4.20.1 - 07 October 2026”Map labels that place themselves and never overlap
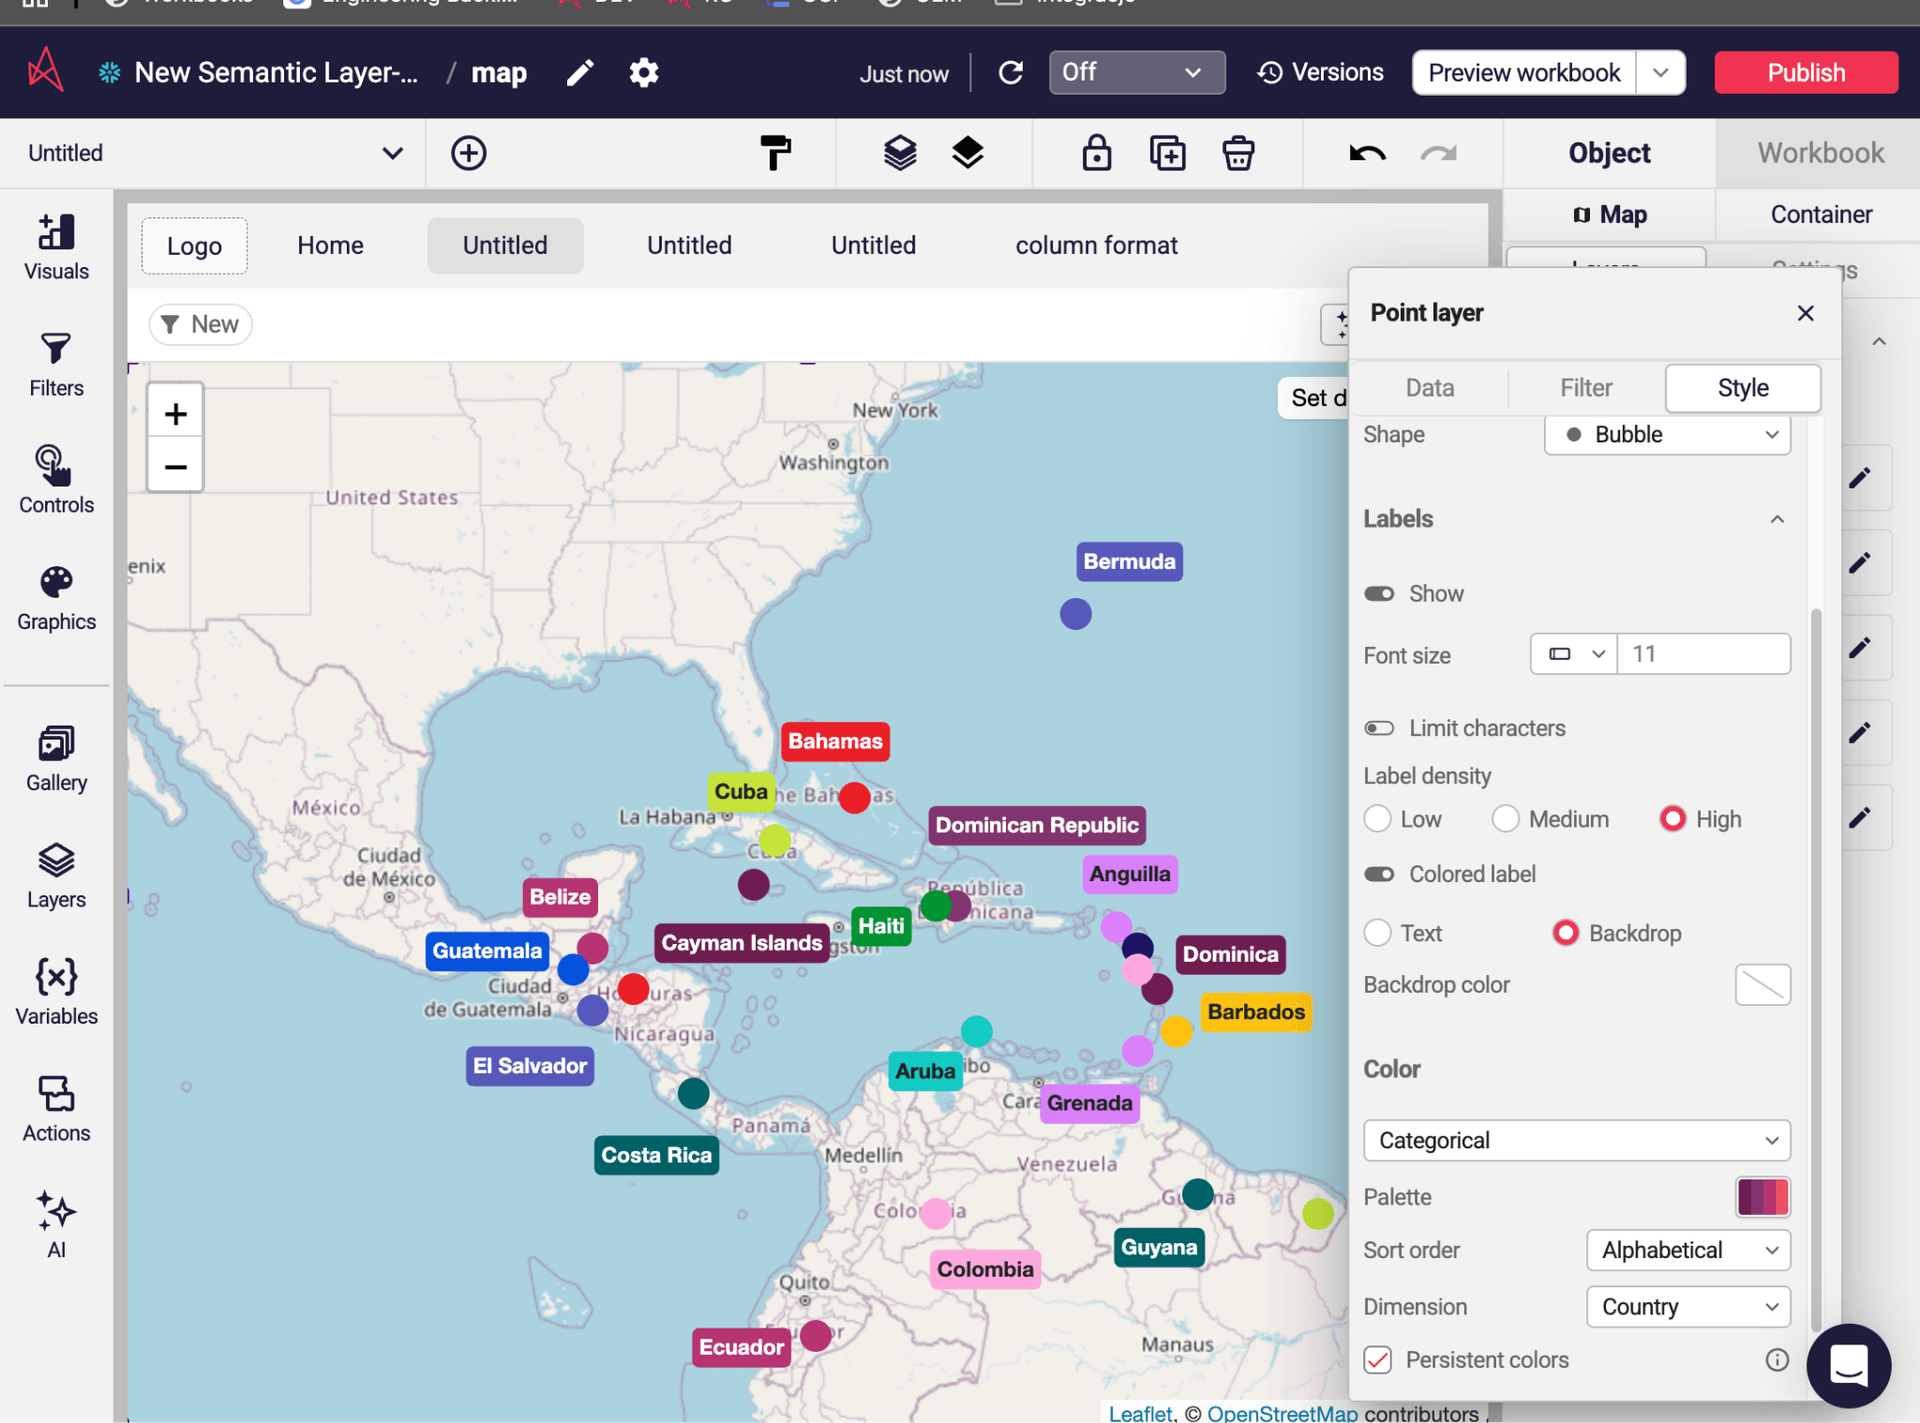
Section titled “Map labels that place themselves and never overlap”Point and shape layers on a map can now show labels, and Astrato decides where each one goes. Point labels sit just outside the point, toward the open space around it. Shape labels sit at the centre of the shape, so a label never drifts toward a neighbouring region.
Where points or shapes are packed closely together, labels that don’t have enough room are hidden, and any label that would overlap one already shown, or fall outside the visible map, is left out.
Labels are hidden on clustered points. The result is a map that can carry names and values directly on it while staying readable as you zoom and pan.
And/Or filtering in charts
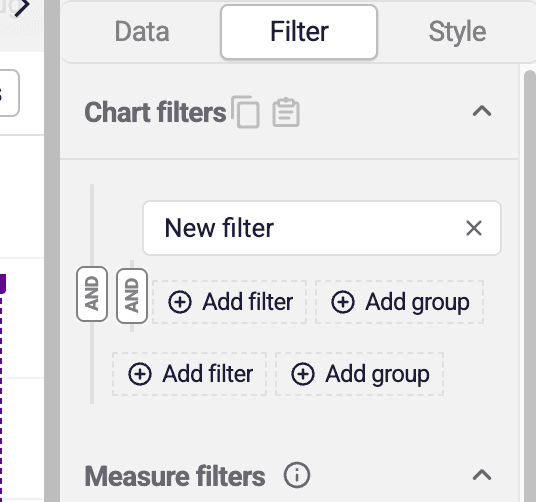
Section titled “And/Or filtering in charts”Static filters on a chart are no longer limited to a flat list where every condition must be true. You can now build filter groups, choose AND or OR inside each group and between groups, and nest one group inside another, for example “(Region = EMEA and Product = A) or Status = Priority”.
Filters and groups can be dragged and dropped to reorganise them, edited in place, and copied and pasted. Existing chart filters carry over automatically as a single AND group, so current charts behave exactly as before until you change them.
Selections made by viewers still apply on top of the chart’s filter groups. Date Picker and Slider objects respect filter groups too. Atomic Input keeps the existing flat filter list for now.
Growth calculation: new “Start from zero” option
Section titled “Growth calculation: new “Start from zero” option”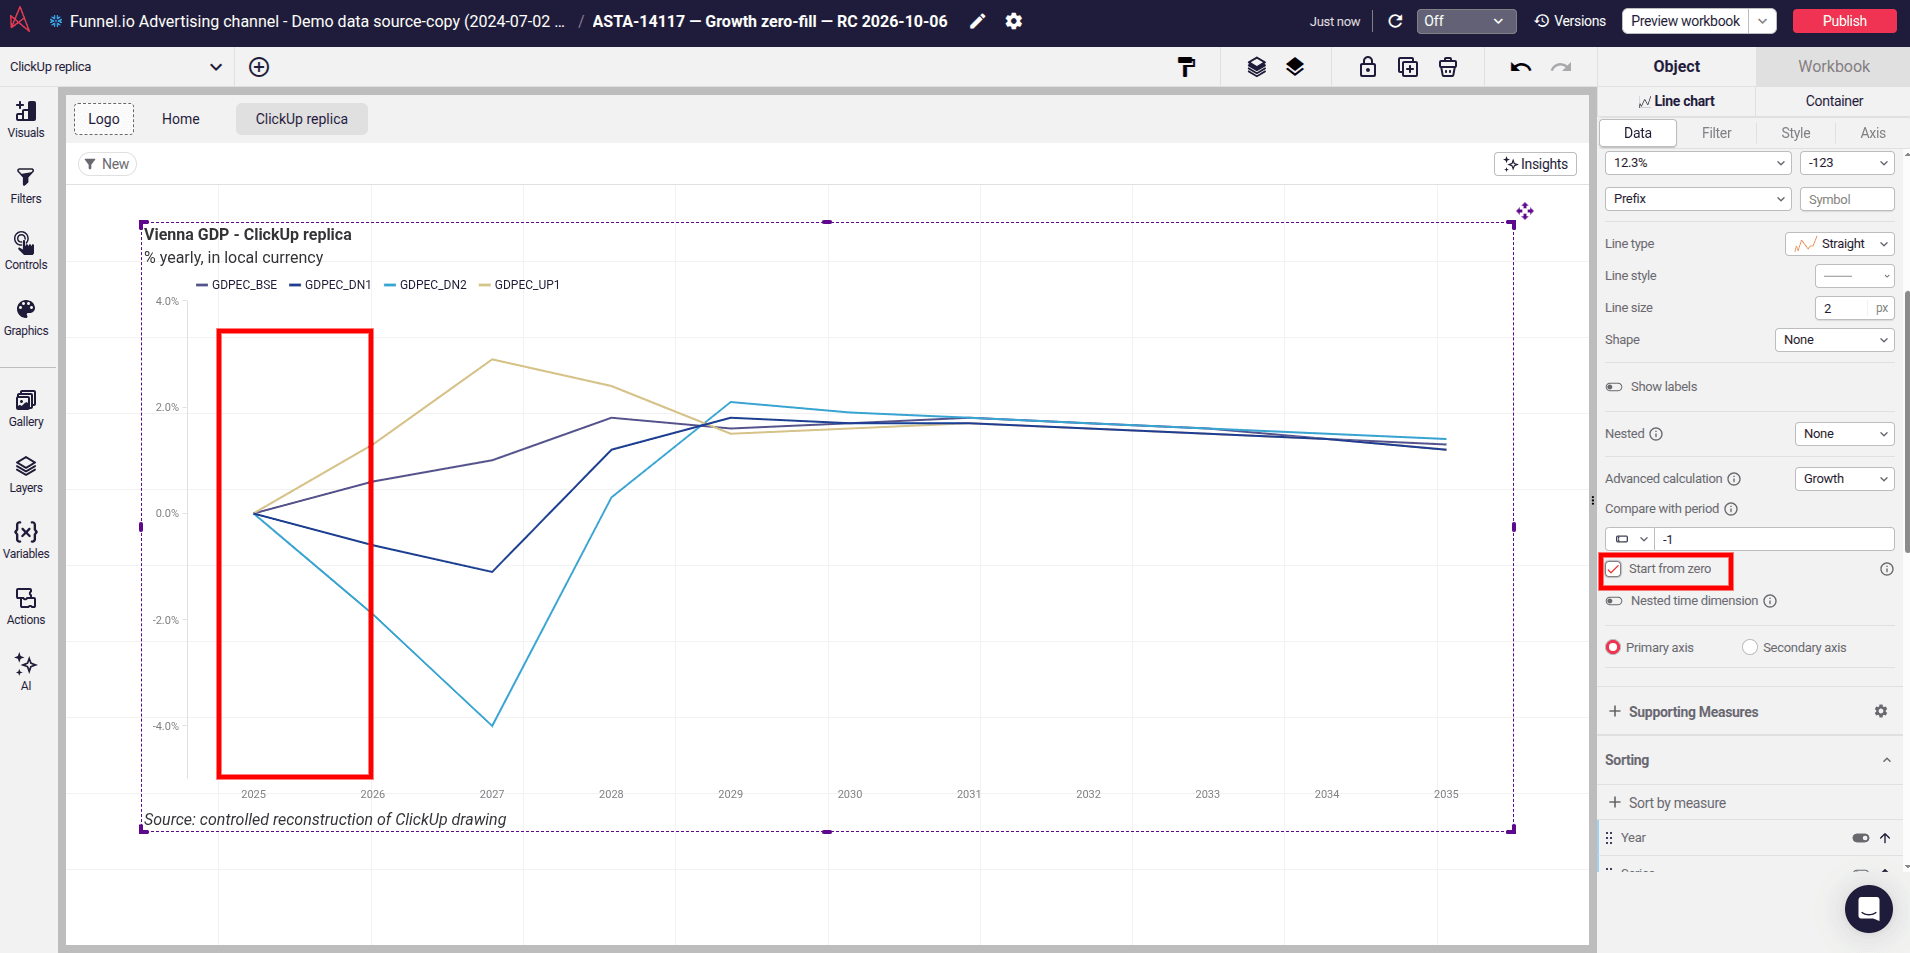
Actions: change a column’s number, date or currency format
Section titled “Actions: change a column’s number, date or currency format”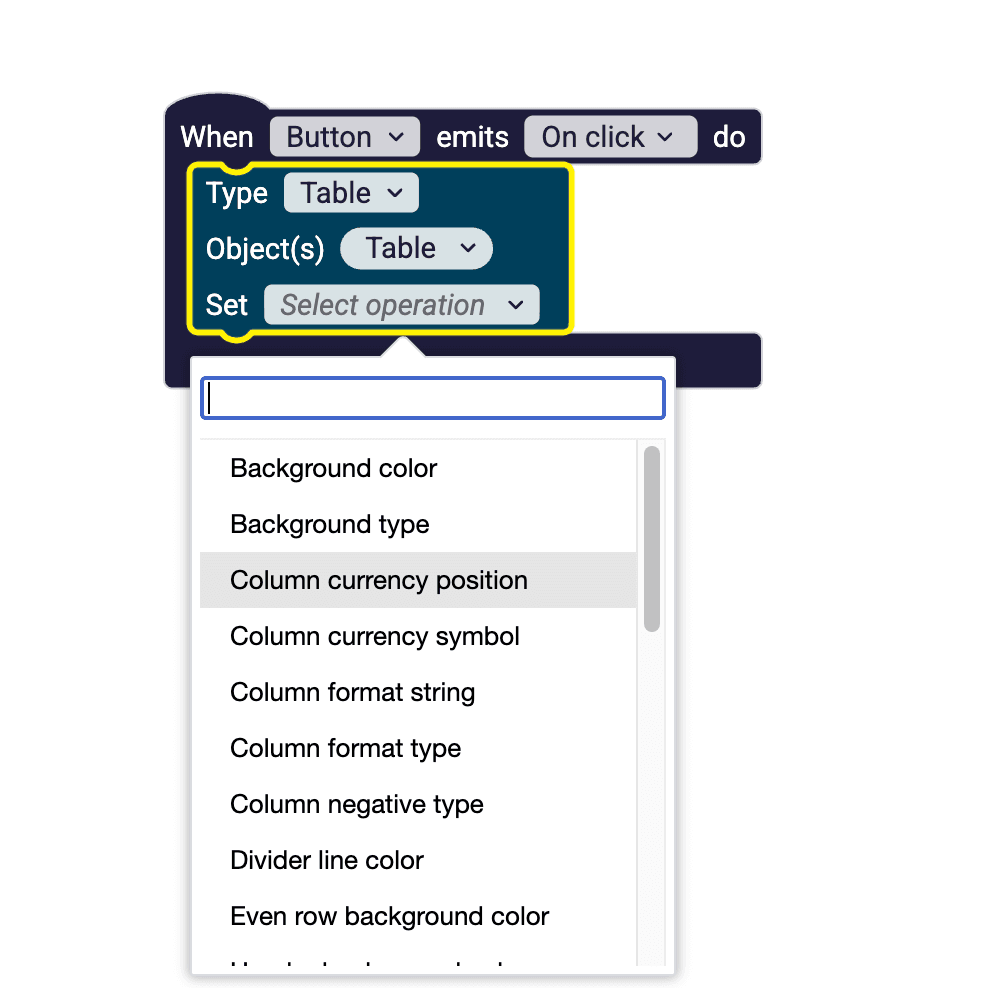
Rich text: cap the number of lines and show an ellipsis
Section titled “Rich text: cap the number of lines and show an ellipsis”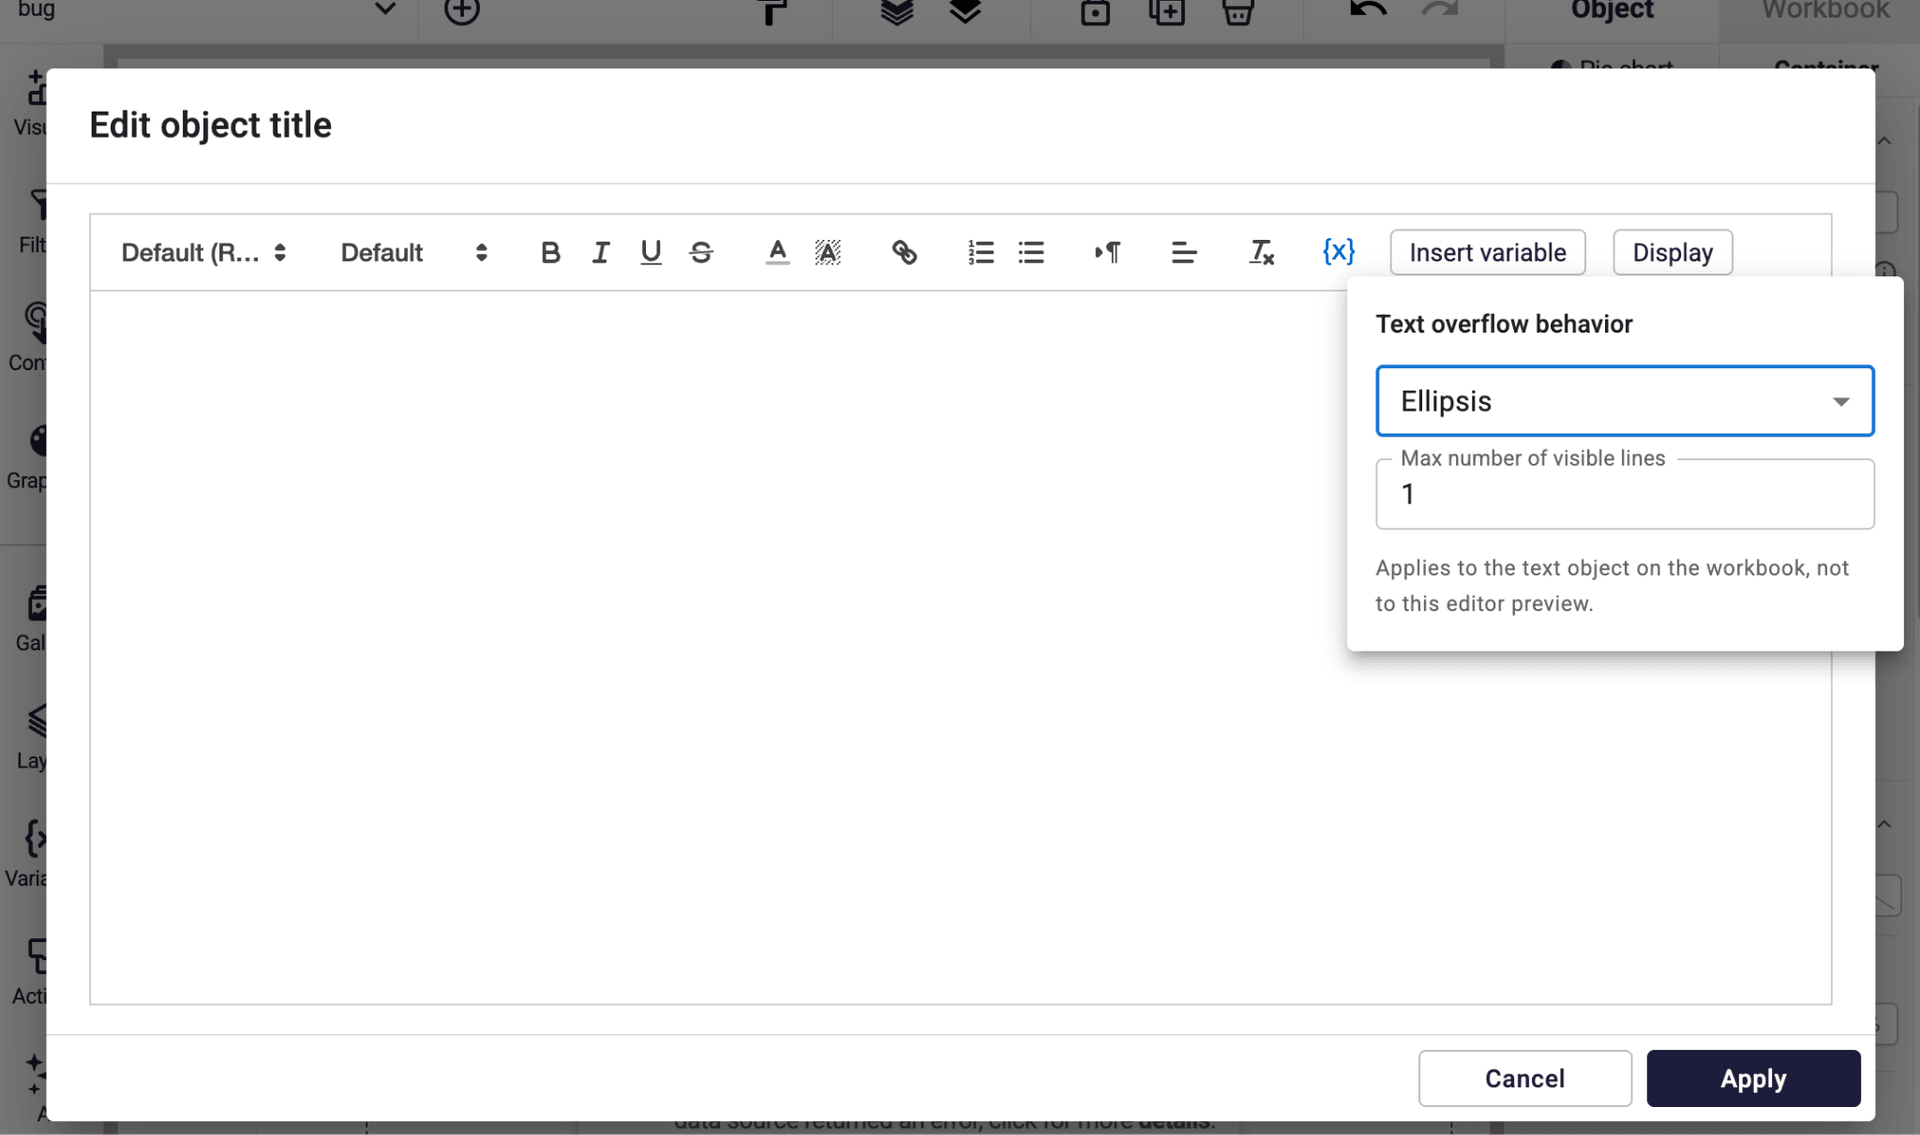
Navigation: keep the hamburger menu open when a workbook loads
Section titled “Navigation: keep the hamburger menu open when a workbook loads”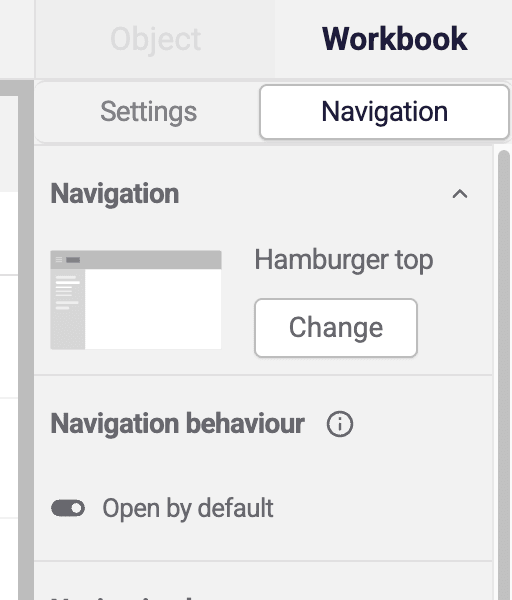
4.20 - 29 September 2026
Section titled “4.20 - 29 September 2026”ClickHouse now supports CSV and inline data upload
Section titled “ClickHouse now supports CSV and inline data upload”If your data lives in ClickHouse, you can now add a CSV file or inline data as a source, the same way you already can with other warehouses. Until now, both options were switched off for ClickHouse connections. This makes it quick to bring a small reference table or a one-off file in alongside your ClickHouse data.
Exported files are named after what you exported
Section titled “Exported files are named after what you exported”When you download a chart, table or report, the file is now named after the object you exported. It used to be saved under a generic name, so you had to rename it before you could tell what was inside. Now you can find the right file in your downloads folder straight away.
Find objects by their ID in the Layers panel, and copy the ID in one click
Section titled “Find objects by their ID in the Layers panel, and copy the ID in one click”The search in the Layers panel now matches an object’s ID as well as its name. You can also copy any object’s ID from its menu in the Layers panel. This helps when you are tracking down a slow query or an error: logs refer to objects by ID, and you can now jump from the log to the object on the sheet in seconds.
Embedded content tells your application when an item is unavailable
Section titled “Embedded content tells your application when an item is unavailable”Astrato embeds already send a message to the host application when a session expires, so the application can sign the user back in. Embeds now send a similar message, 404Error, when the embedded item itself can’t be loaded because it has been deleted, has expired, or its ID is invalid. Your application can use this to show its own message or hide the embed, instead of leaving your users on Astrato’s default “This item is unavailable” page. The existing session-expiry message works exactly as before.
New variables stay visible after you add them
Section titled “New variables stay visible after you add them”If you had typed a search into the Variables panel, adding a new variable could leave it hidden behind that search. The panel now clears the search when you add a variable, so the new one appears right away and you can start setting it up.
Charts 1.97 - 15 September 2026
Section titled “Charts 1.97 - 15 September 2026”Pivot and Hierarchical tables can now show measures as rows without placeholder dimensions
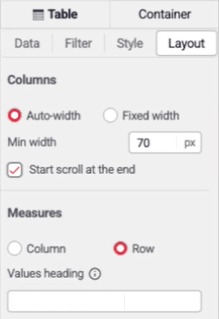
Section titled “Pivot and Hierarchical tables can now show measures as rows without placeholder dimensions”Previously, showing measures as rows required at least one row or column dimension, even when you didn’t need one — forcing you to add empty placeholder fields that added setup work and could produce incorrect measure labels. Pivot and Hierarchical tables now support measures as rows with any combination of dimensions, including none at all: measures only, row dimensions only, column dimensions only, or both. The measure-name column uses a fixed “Values” label, and Pivot’s indent on/off modes continue to work as expected.
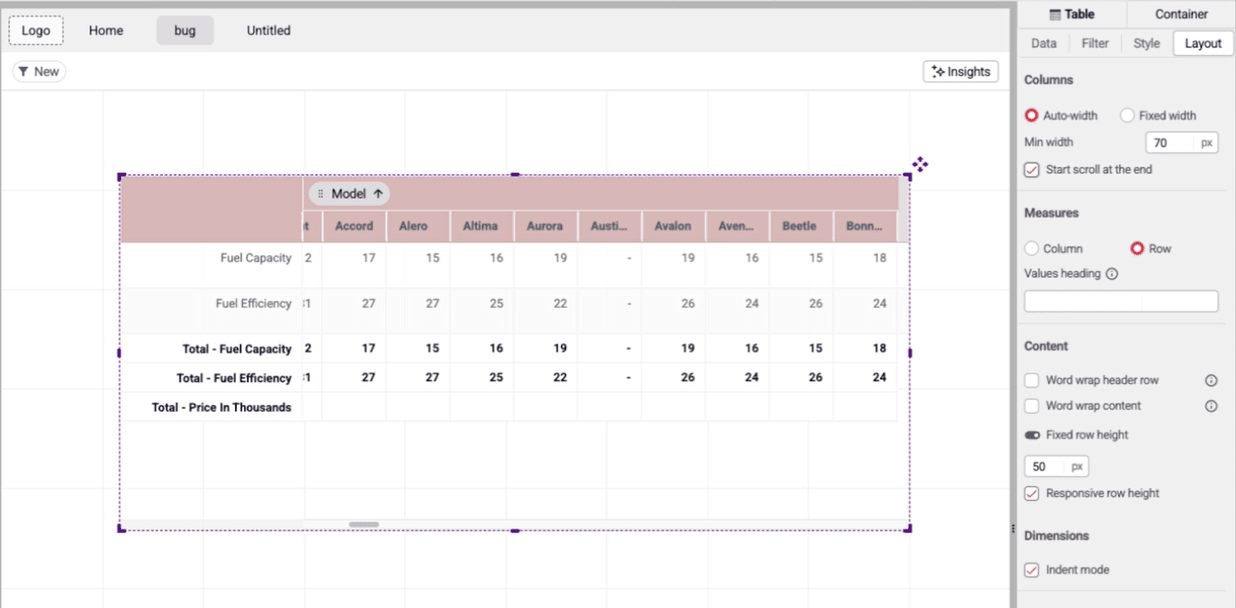
Configurable heading for the measures column in Pivot and Hierarchical tables
Section titled “Configurable heading for the measures column in Pivot and Hierarchical tables”The heading above the measure-name column — shown when measures are displayed as rows — can now be renamed from the default “Values” to whatever fits your report.
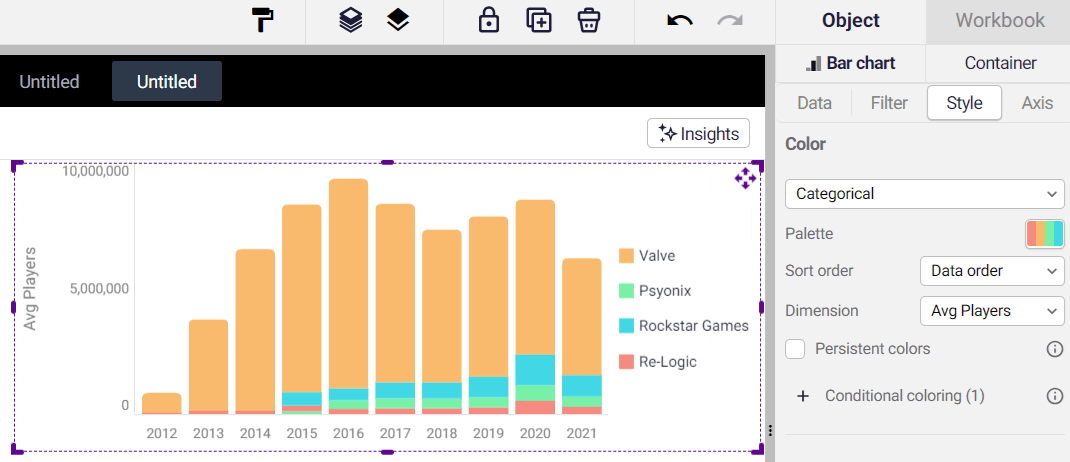
Charts: sort the legend to match your chart’s data order
Section titled “Charts: sort the legend to match your chart’s data order”A new “Sort by data” option lets the legend follow the same order as the chart itself — for example, by bar height or query order — across bar, line, pie and other chart types.
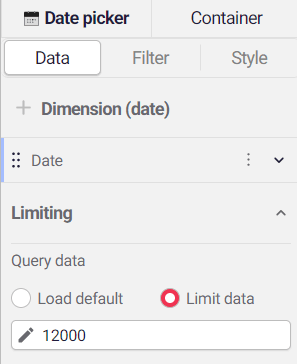
Date Picker: control over the record limit
Section titled “Date Picker: control over the record limit”The date picker previously capped its date range at a fixed 7,500 records behind the scenes. That limit is now configurable, so longer date ranges are no longer silently truncated.
Axis charts: text wrapping on axis labels
Section titled “Axis charts: text wrapping on axis labels”Long axis labels can now wrap onto multiple lines instead of being cut off, with an automatic option that wraps based on available space.
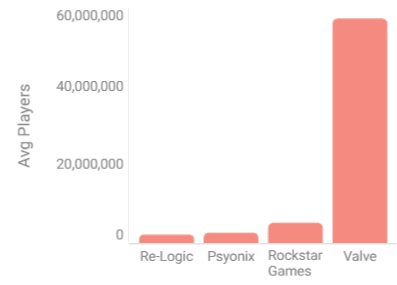
Filters: option to hide non-selectable values
Section titled “Filters: option to hide non-selectable values”Filter objects can now be set to hide values that can’t currently be selected, keeping the list focused on what’s actually usable.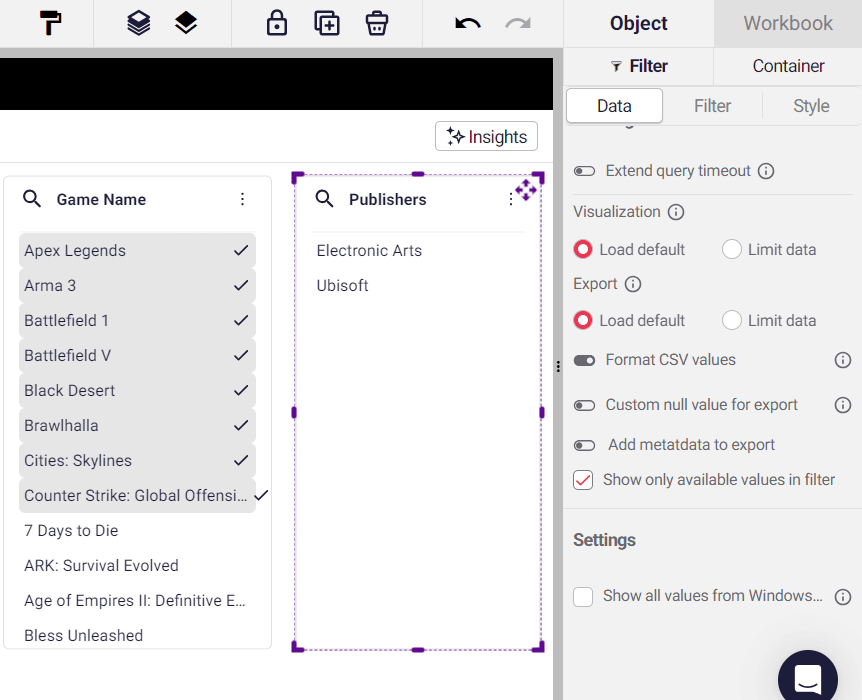
Table: header label alignment now independent of column content
Section titled “Table: header label alignment now independent of column content”Header labels can now be aligned separately from the column content beneath them — for example, left-aligning text headers while keeping numeric columns right-aligned — without affecting where the content itself sits.
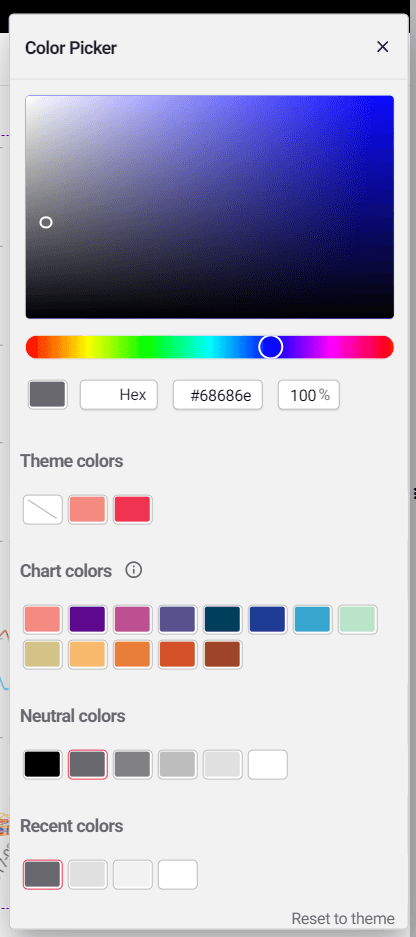
Color Palettes - Theme colors & Neutral
Section titled “Color Palettes - Theme colors & Neutral”Theme colors read from main colors set in theme
- Chart colors read from your default categorical
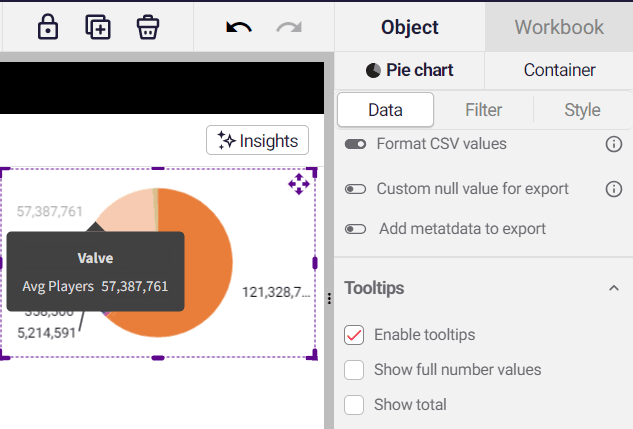
Pie charts: option to hide the total from tooltips
Section titled “Pie charts: option to hide the total from tooltips”Pie chart tooltips can now hide the “Total” value when it isn’t needed.
Improvements & Fixes
Section titled “Improvements & Fixes”-
Filters — parameter-to-variable connections no longer reset after publishing.
-
Pivot — “Grouped by” settings on duplicate fields no longer affect each other.
-
Date Picker — quick-select buttons now trigger filter actions.
-
Filters — fixed an “in list” filter turning into “equals” with bare-comma separators.
-
Bar Chart — “Show backdrop” data label setting more consistent.
-
Writeback — clearer error when a source column doesn’t contain valid colors.
-
Pivot table — unsupported dimension/measure combinations no longer break the table.
-
Pivot — fixed renders empty when filters change on workbook load.
-
Pie chart — data labels now show for every measure.
-
Container — fixed size and position issues within groups.
-
Alternates — separator spaces are no longer trimmed
Embeds, Security Update - 11 September 2026
Section titled “Embeds, Security Update - 11 September 2026”We’ve updated domain restrictions on embeds. Please make sure your allowlist is up to date, you can add domains on this page in the Allow list tab: https://app.astrato.io/administration/embed-links
Excel Add-in 1.1.0 - 09 September 2026
Section titled “Excel Add-in 1.1.0 - 09 September 2026”-
Removed unnecessary horizontal scrolling in the Excel task pane.
-
Added authentication reporting.
-
Added error reporting with correlation IDs (helpful for Astrato support) to make troubleshooting faster.
4.191 - 01 September 2026
Section titled “4.191 - 01 September 2026”Our New AI-native Semantic Layer Editor has landed 🎉
Section titled “Our New AI-native Semantic Layer Editor has landed 🎉”One governed definition of your business - across analytics, applications, and AI.
The latest Astrato Semantic Layer brings a major upgrade to how teams model, govern, manage, and use business logic across their data.
It introduces a new Semantic Layer Editor, stronger governance and developer workflows, deeper Snowflake integration, and direct access to governed business context for AI through MCP.
A new Semantic Layer Editor Experience
Section titled “A new Semantic Layer Editor Experience”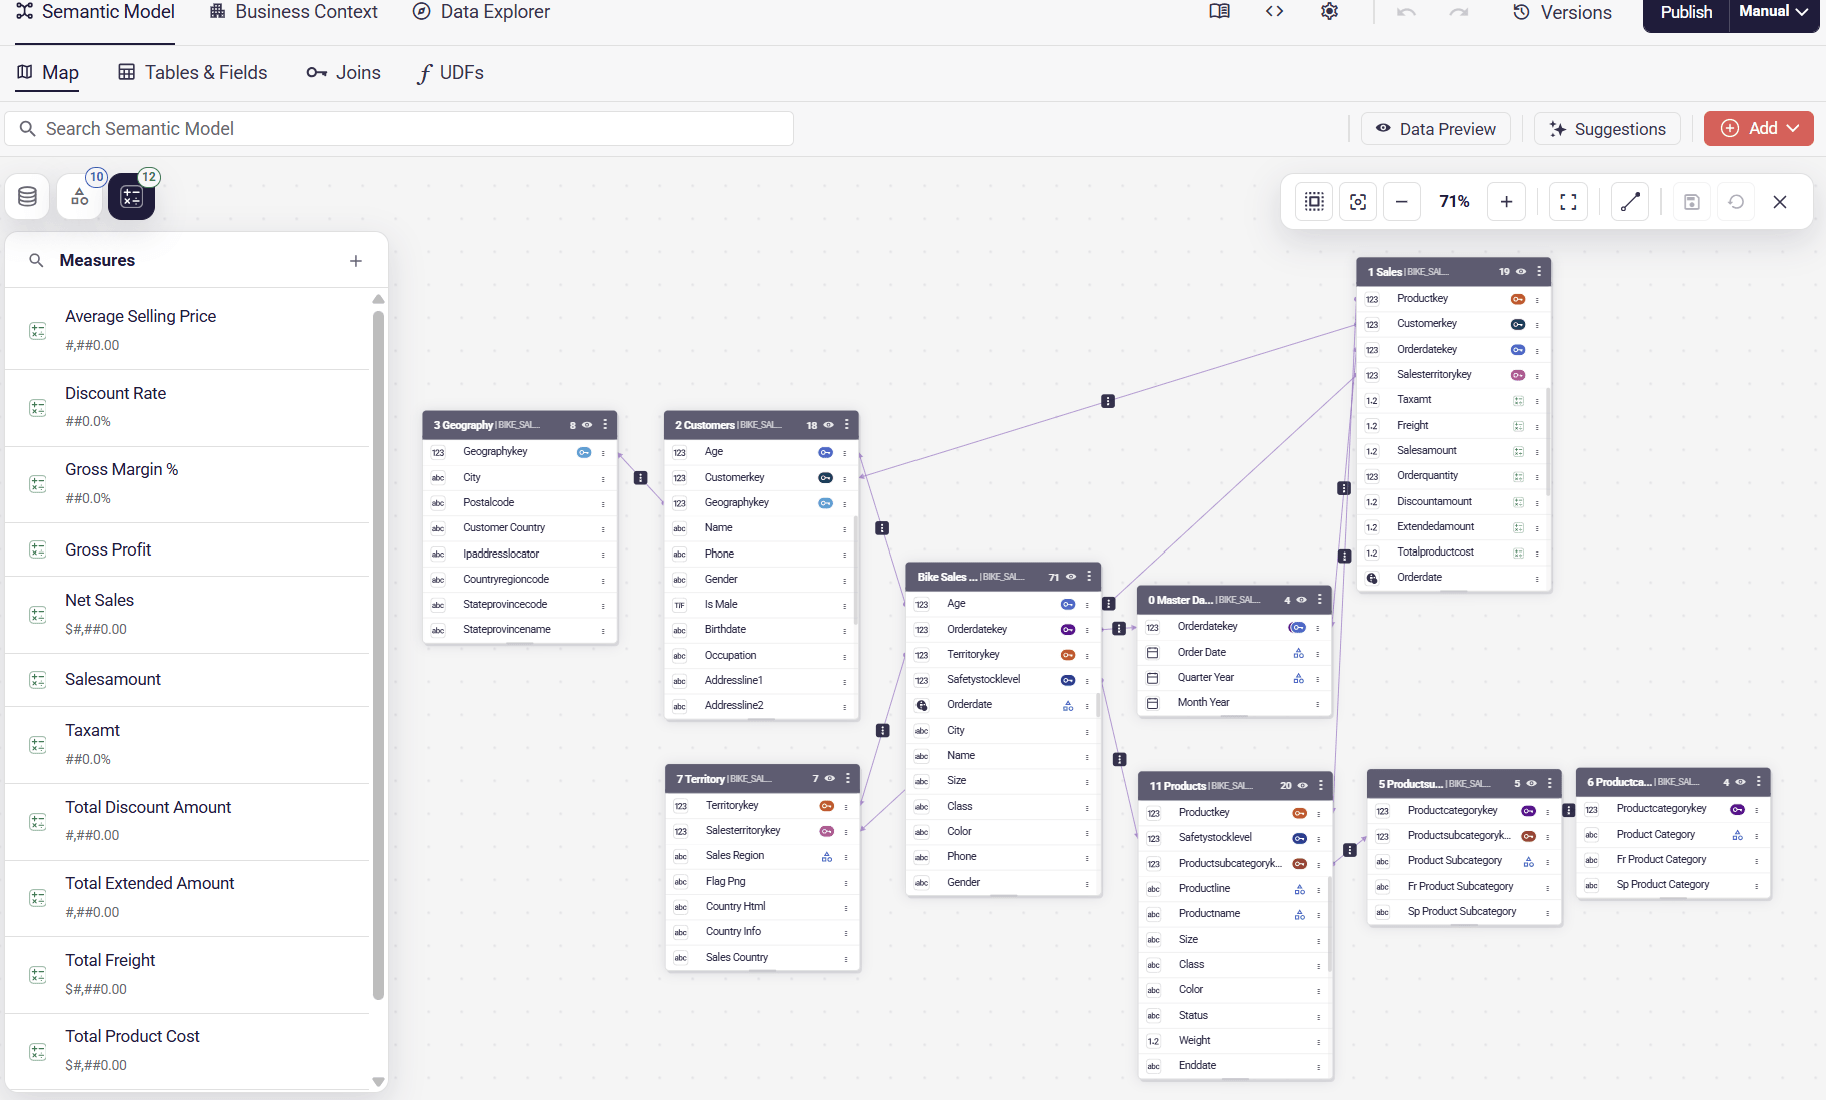
-
The redesigned editor makes building and managing semantic models faster and more intuitive.
-
Define dimensions, measures, relationships, hierarchies, calculations, and business logic in one place — creating a consistent semantic foundation that can be reused across Astrato.
-
Models are easier to navigate, understand, validate, and maintain, whether you’re working with a handful of tables or a complex enterprise data model.
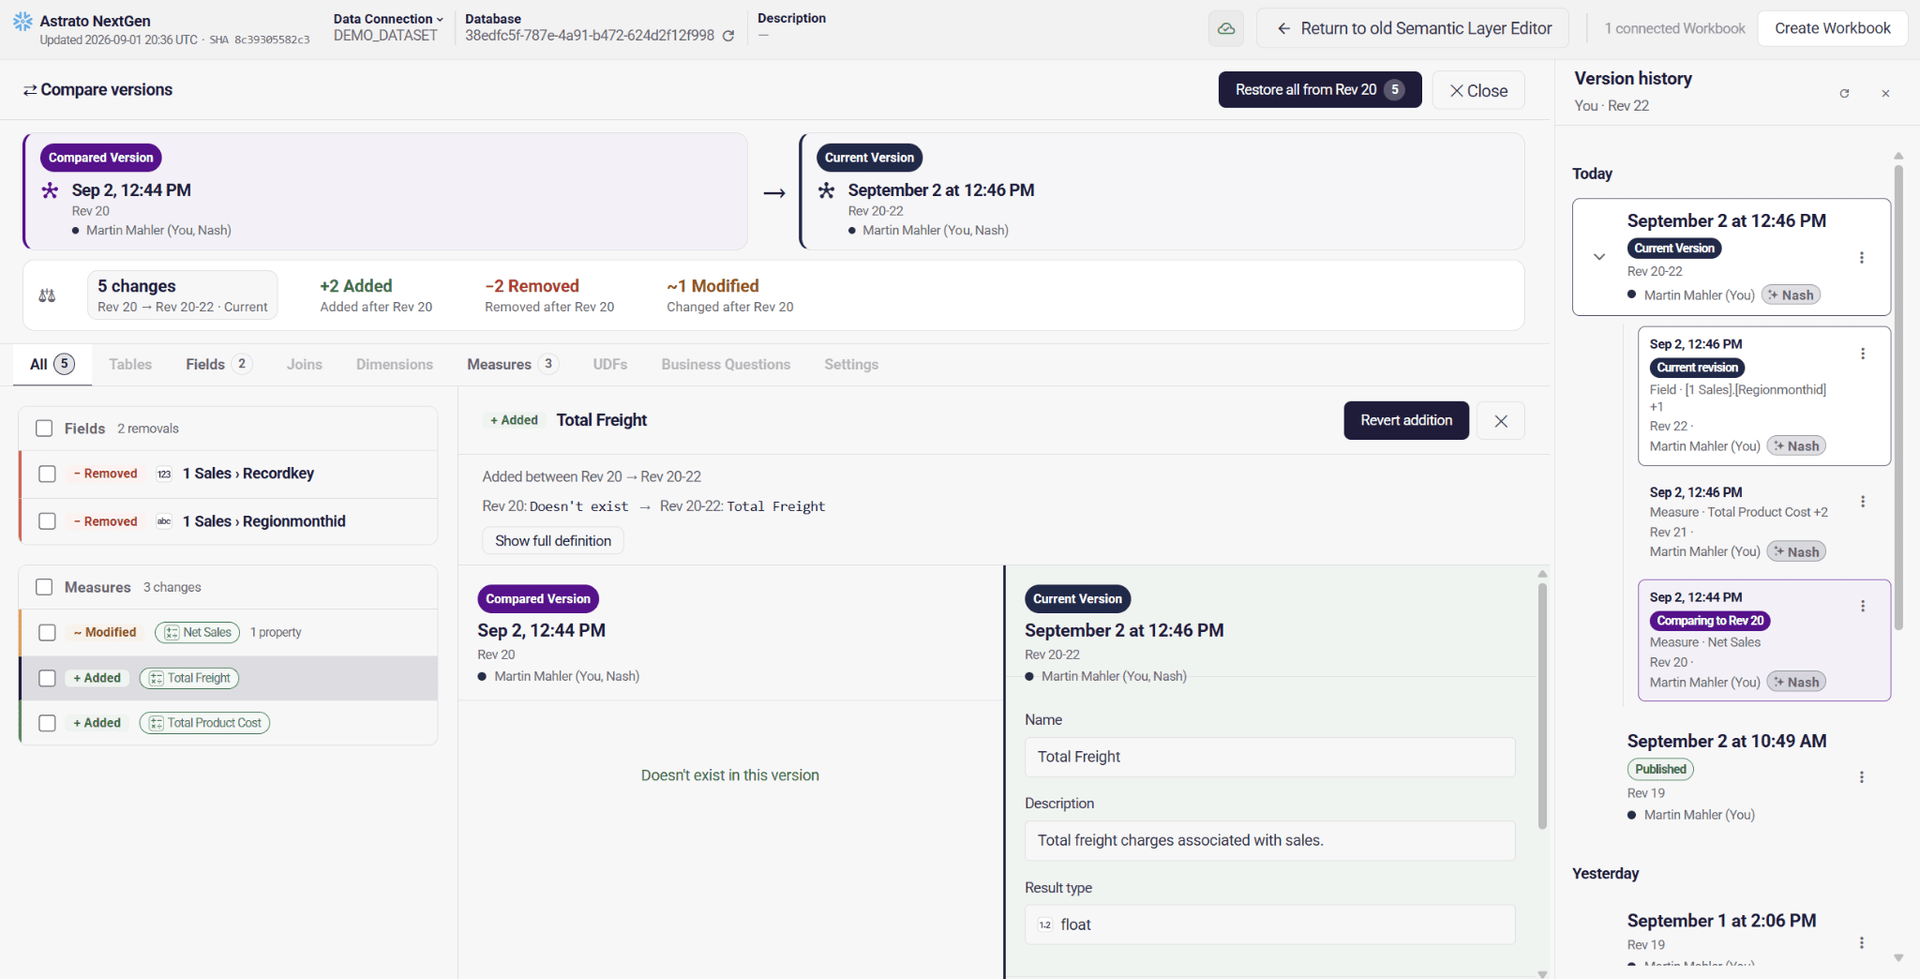
🕘 Version history, comparison & rollback
Section titled “🕘 Version history, comparison & rollback”
-
Semantic models can now move through a controlled development and publishing workflow.
-
Make changes without immediately affecting production, validate them, and publish when they’re ready.
-
This gives teams greater control over how semantic changes are developed and released - particularly when multiple people are working on the same model.
Learn more about how Version Control works ->
✅ Built-in validation & error handling
Section titled “✅ Built-in validation & error handling”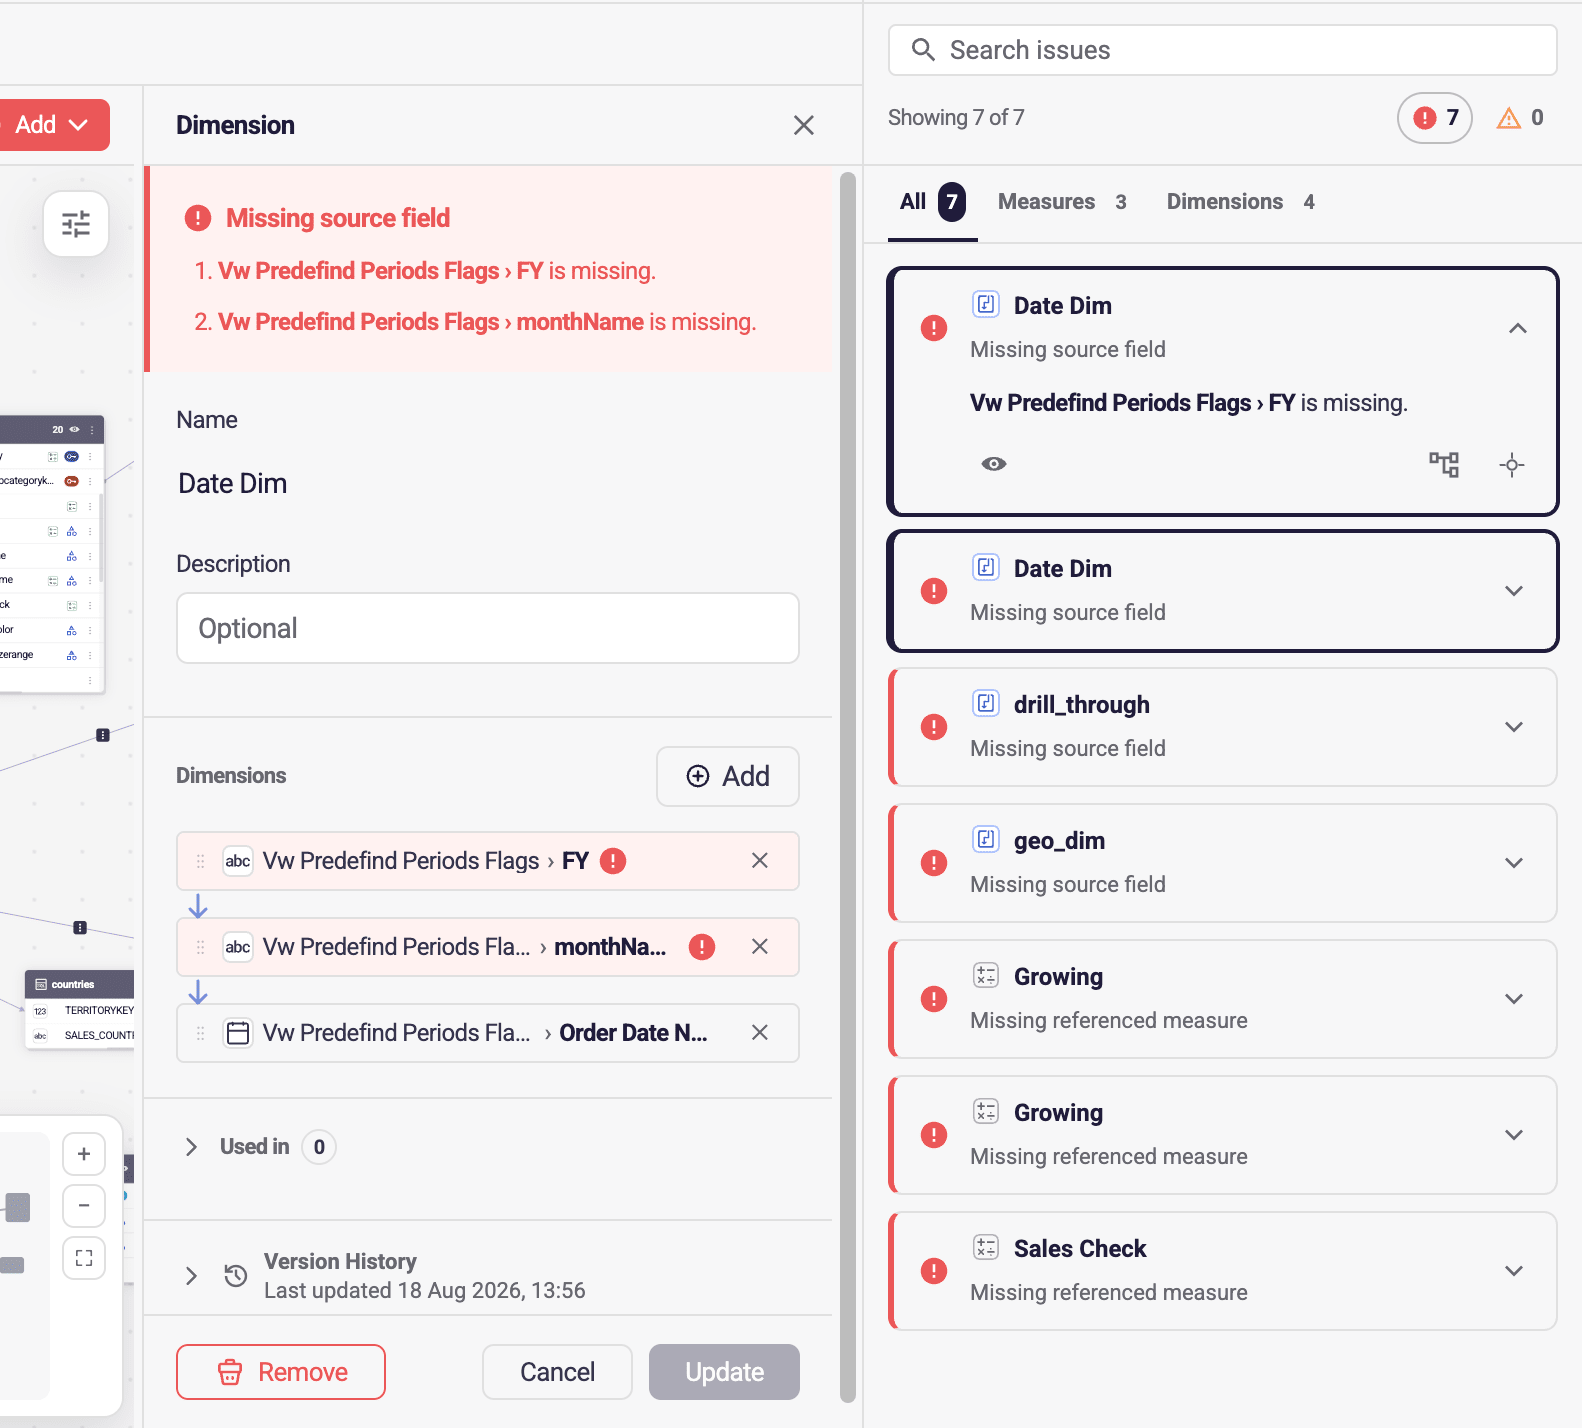
-
Astrato now automatically validates your semantic model and identifies configuration issues before they reach users.
-
Errors and warnings are surfaced directly in the editor, making it easier to catch problems early and keep models reliable as they evolve.
🔗 Lineage & model visibility
Section titled “🔗 Lineage & model visibility”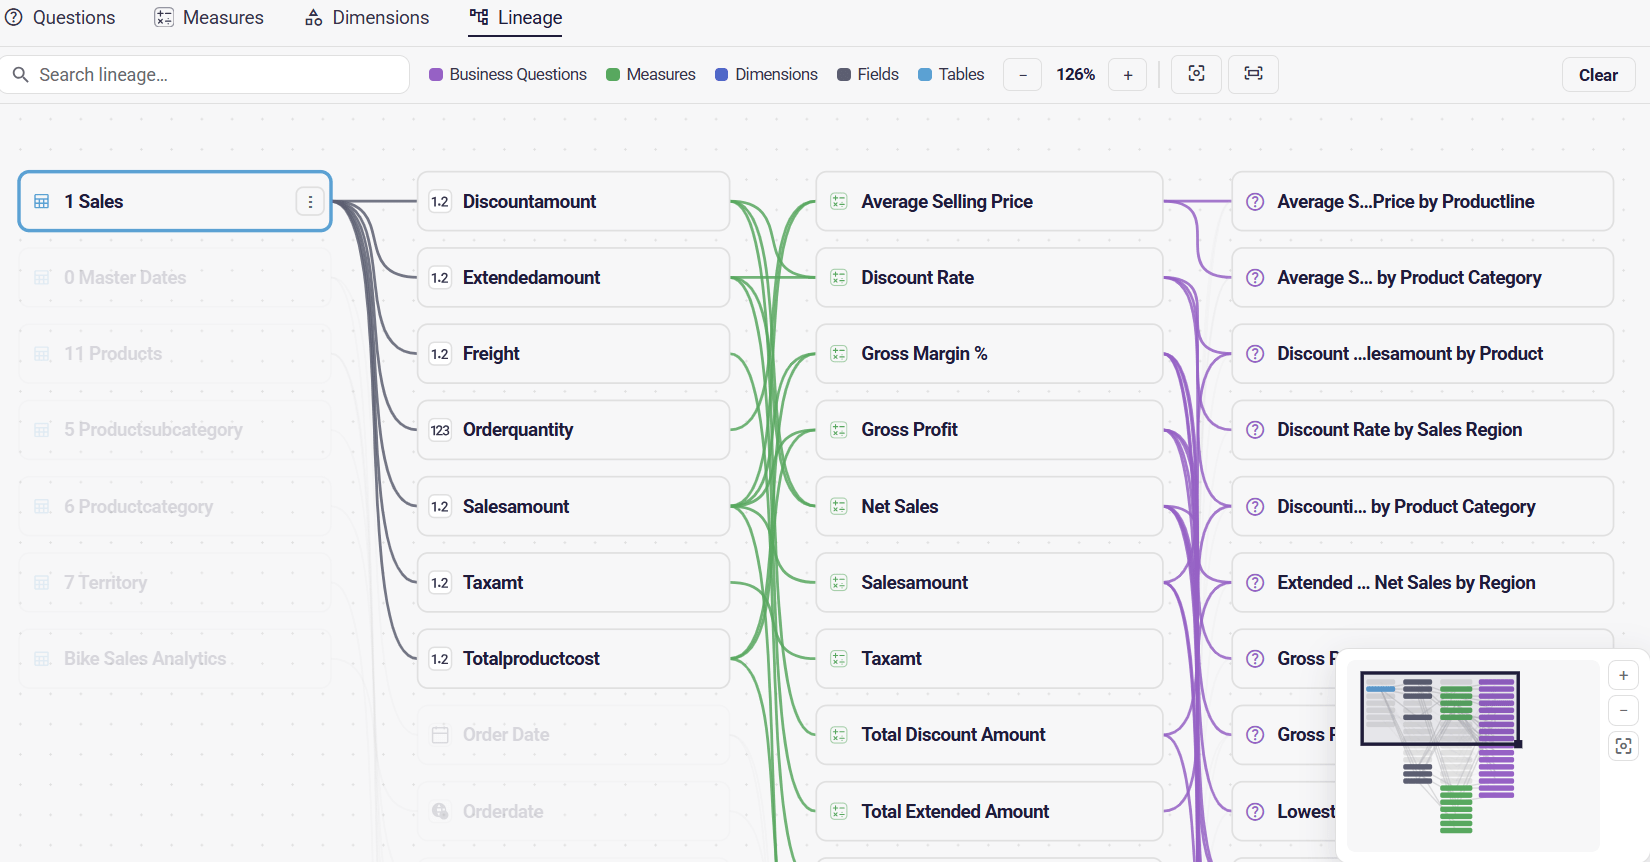
-
Understand how your semantic model fits together.
-
New lineage capabilities make it easier to see relationships and dependencies across your model, helping teams understand the impact of changes and navigate increasingly complex data environments.
📚 Documentation built into the model
Section titled “📚 Documentation built into the model”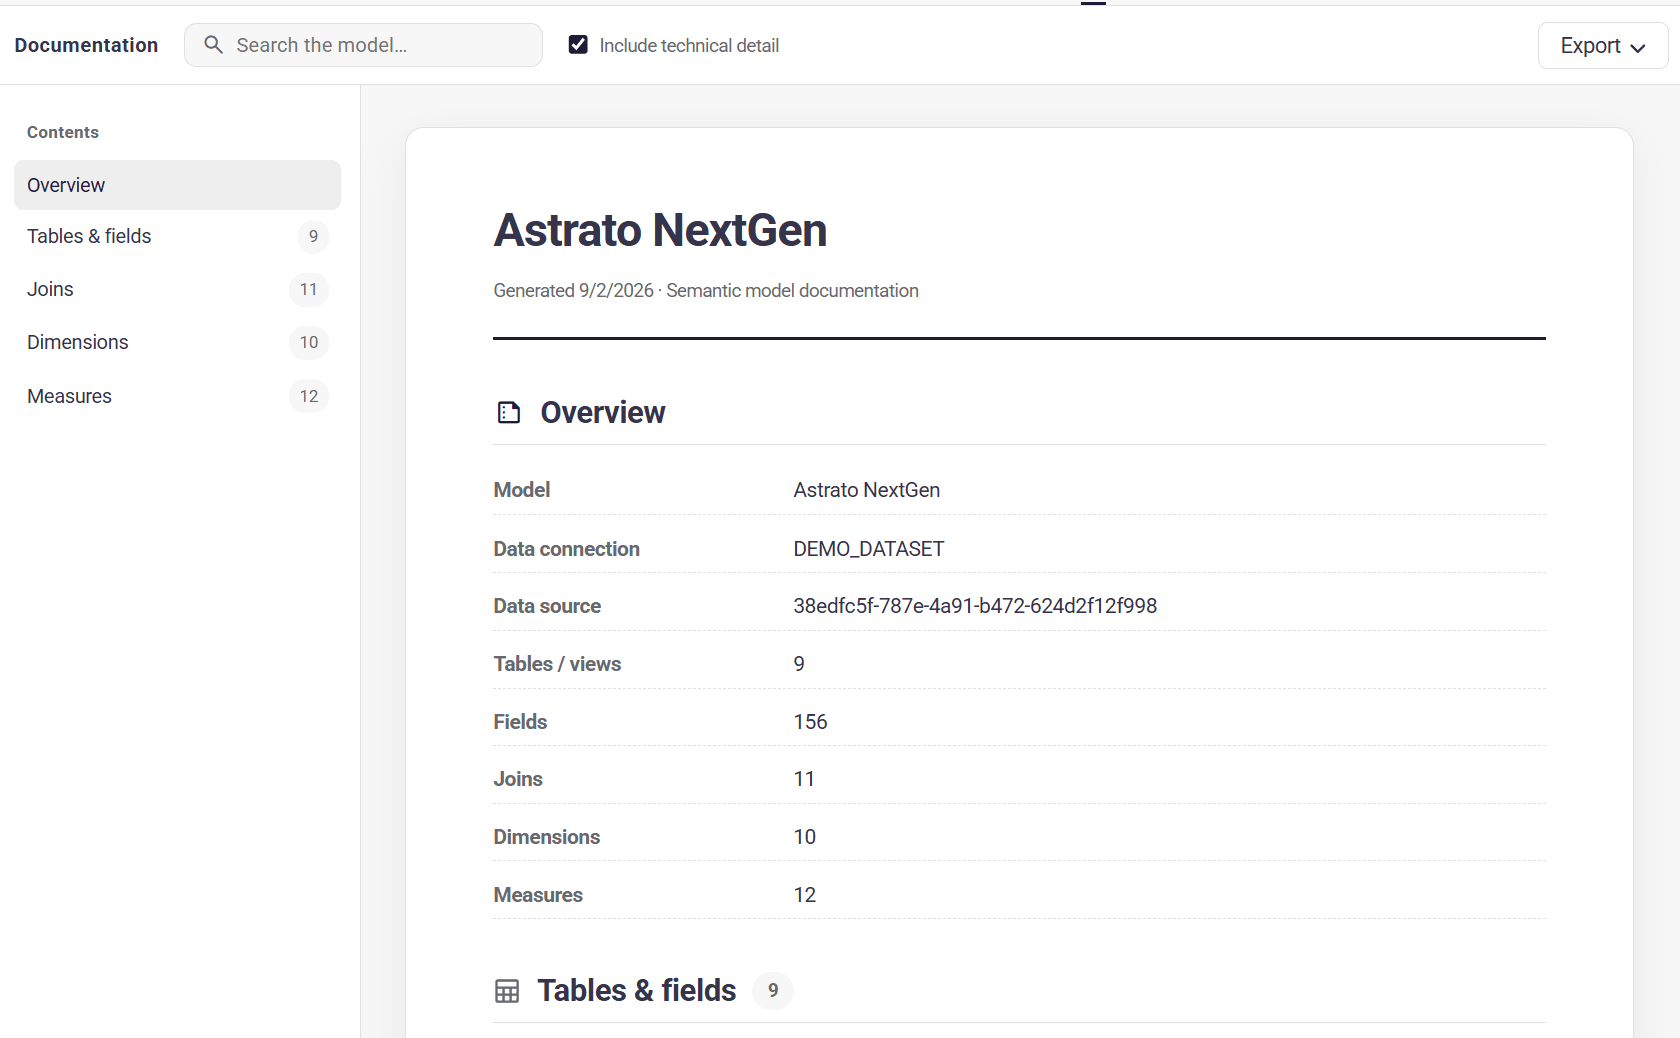
Add descriptions and business context directly to semantic objects.
-
This makes the semantic layer more than a collection of technical definitions: it becomes a documented representation of how your organisation understands its data.
-
That context is available not just to analysts, but to the AI systems working with the model.
🛠️ Developer-friendly workflows
Section titled “🛠️ Developer-friendly workflows”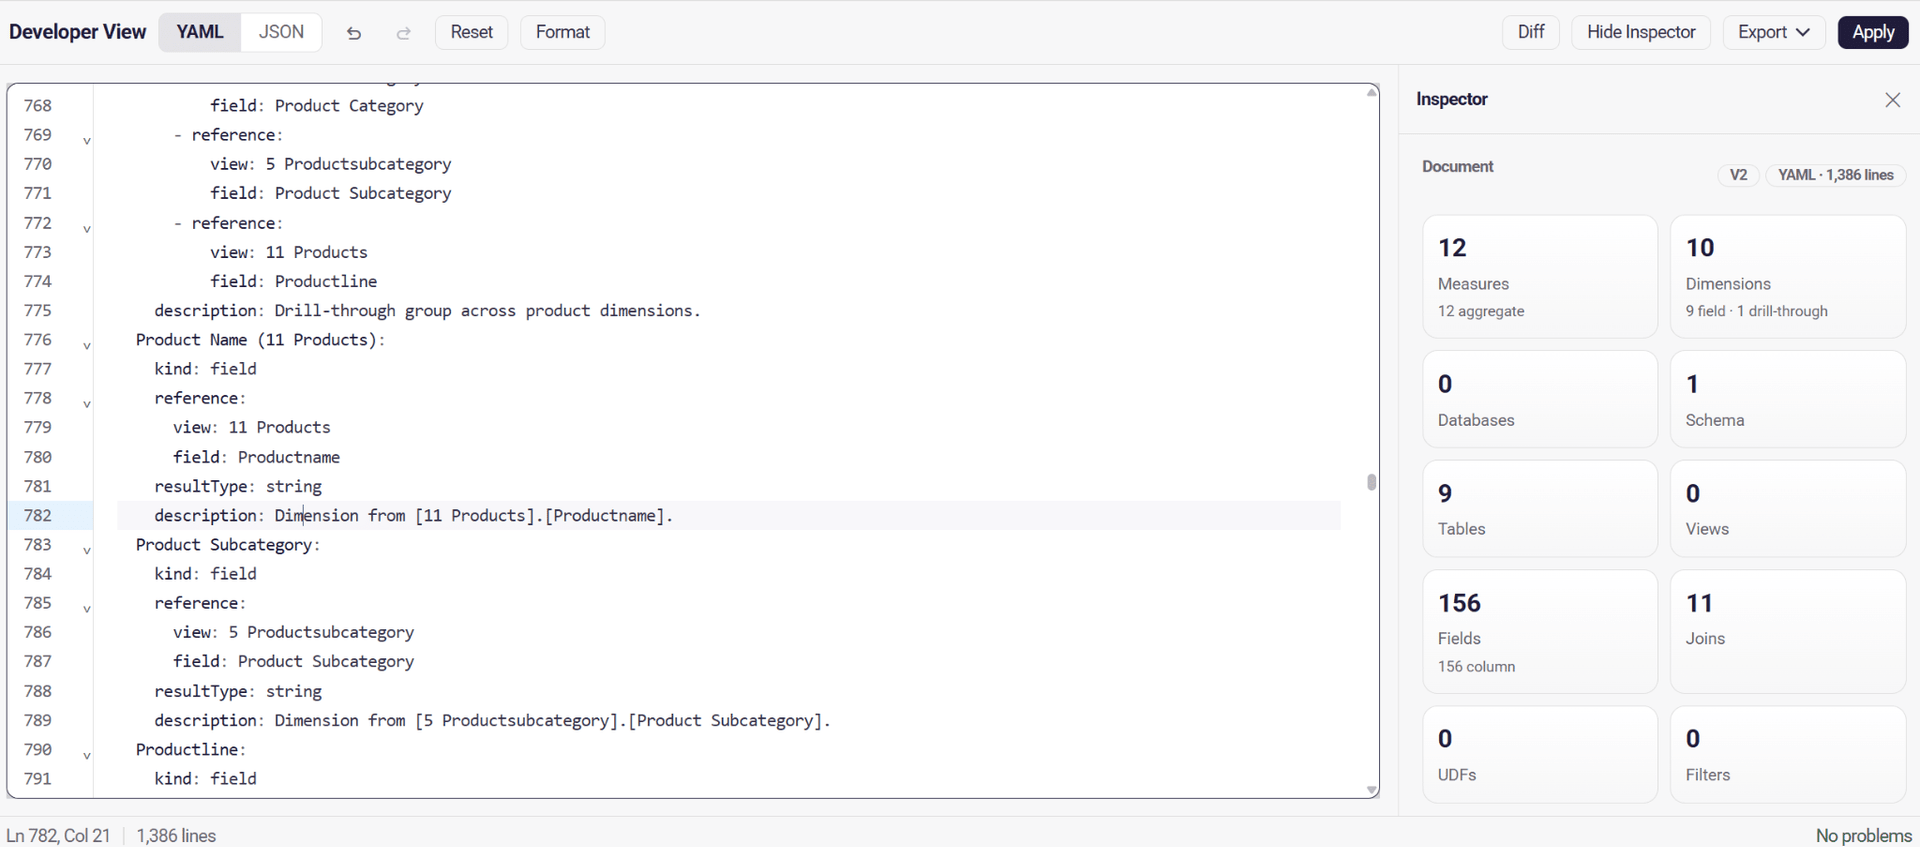
-
The new Semantic Layer is designed to fit more naturally into modern development practices.
-
Improved tooling makes semantic models easier to manage, maintain, and evolve — giving technical teams more control without making the experience inaccessible to business users.
❄️ Snowflake Semantic Views
Section titled “❄️ Snowflake Semantic Views”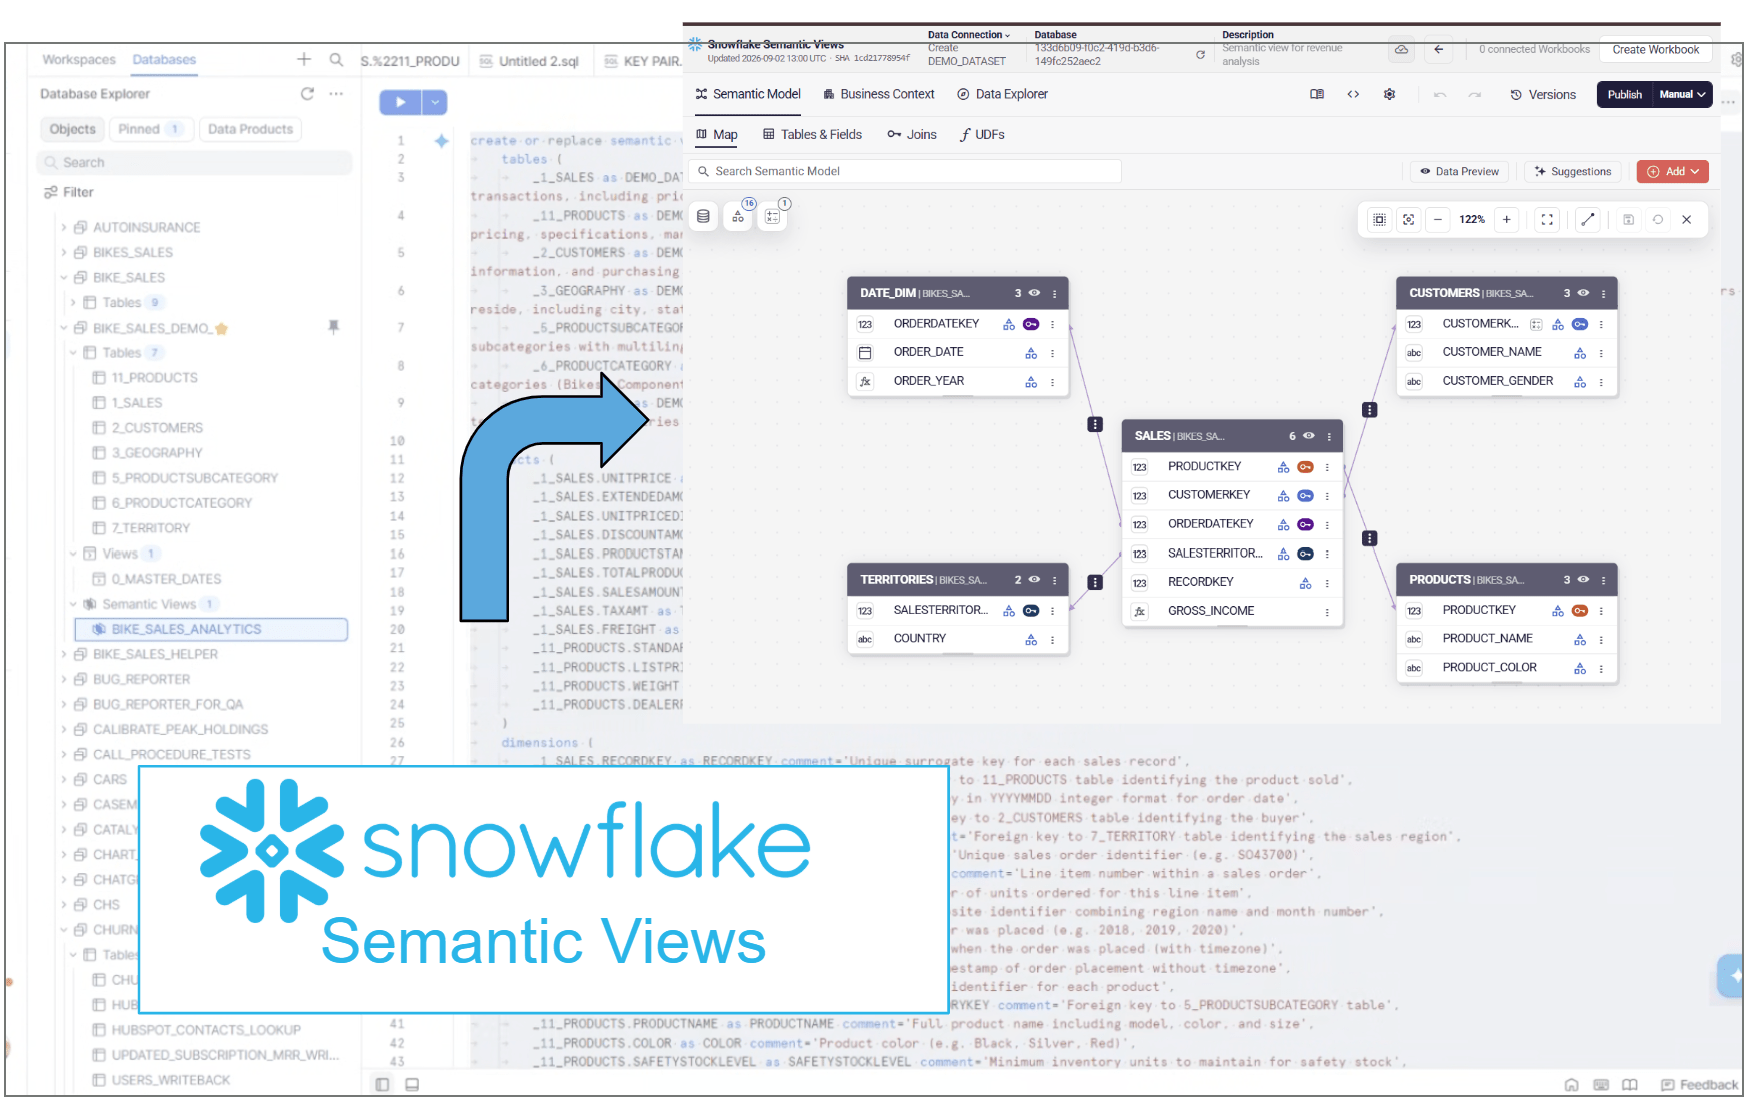
-
Astrato now supports Snowflake Semantic Views, bringing Snowflake’s governed semantic definitions directly into the Astrato experience.
-
Teams can build on semantic logic already defined in Snowflake rather than recreating it elsewhere — extending the same governed definitions across their analytics environment.
🤖Your semantic layer, available through MCP
Section titled “🤖Your semantic layer, available through MCP”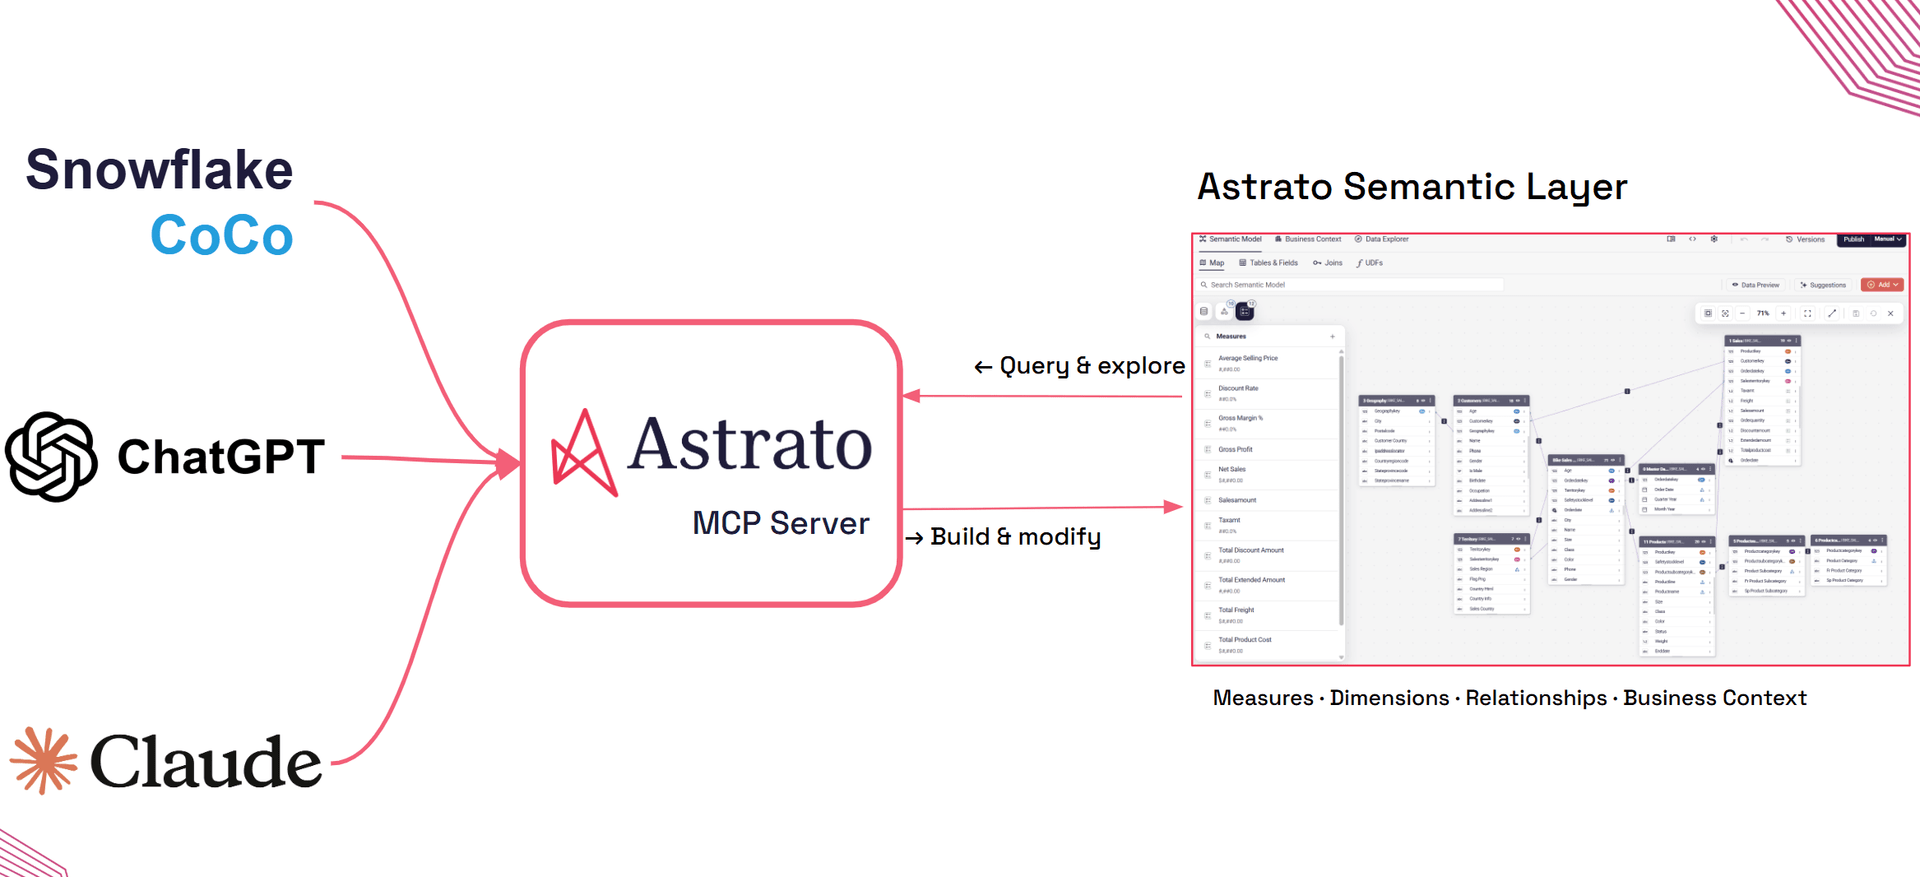
-
Astrato’s Semantic Layer can now be exposed through the Model Context Protocol (MCP).
-
That means AI assistants (Claude, ChatGPT/Codex, Snowflake CoCo) and agents can work with governed business definitions instead of trying to infer meaning directly from raw schemas.
-
Measures, dimensions, relationships, descriptions, and business logic become machine-readable context that AI can use to understand and query your data more reliably.
Connect an AI assistant to Astrato MCP ->
✨ A smarter Astrato Nash AI
Section titled “✨ A smarter Astrato Nash AI”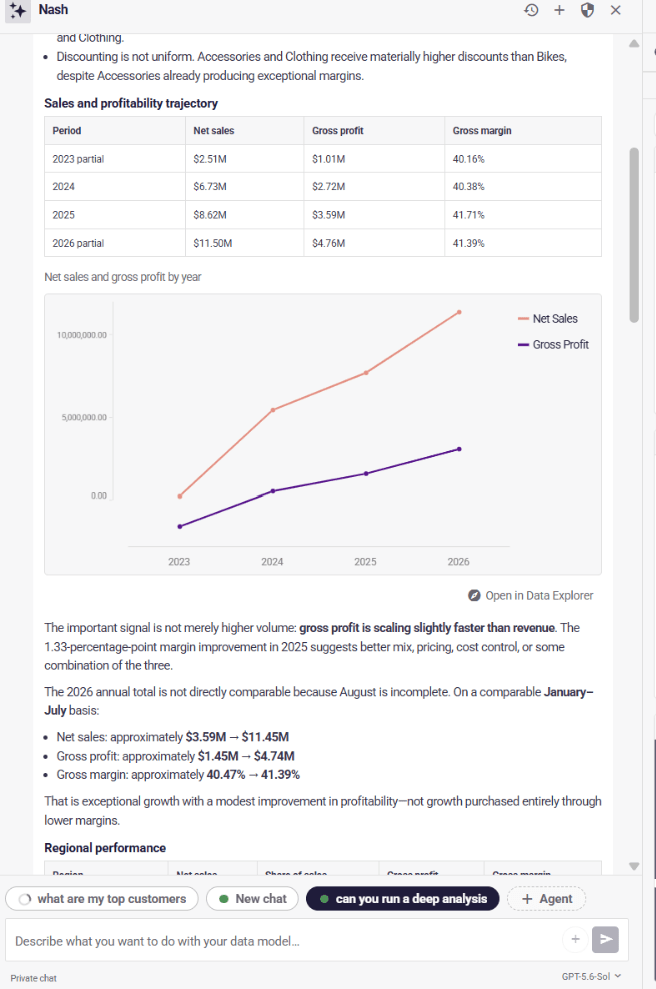
-
Nash now benefits directly from the richer context contained within the Semantic Layer.
-
With a better understanding of business definitions, relationships, measures, and metadata, Nash can interpret questions more accurately and produce more relevant analytical results.
-
The result is a tighter connection between the logic your organisation defines and the answers AI produces.
🌐 One semantic foundation. Many experiences.
Section titled “🌐 One semantic foundation. Many experiences.”-
The Astrato Semantic Layer isn’t limited to dashboards.
-
The same governed definitions can power interactive analytics, Excel, embedded experiences, applications, AI assistants, and agents.
-
Define the business logic once. Use it everywhere.
Also available in this release:
Section titled “Also available in this release:”👥 Put new users into the right groups automatically
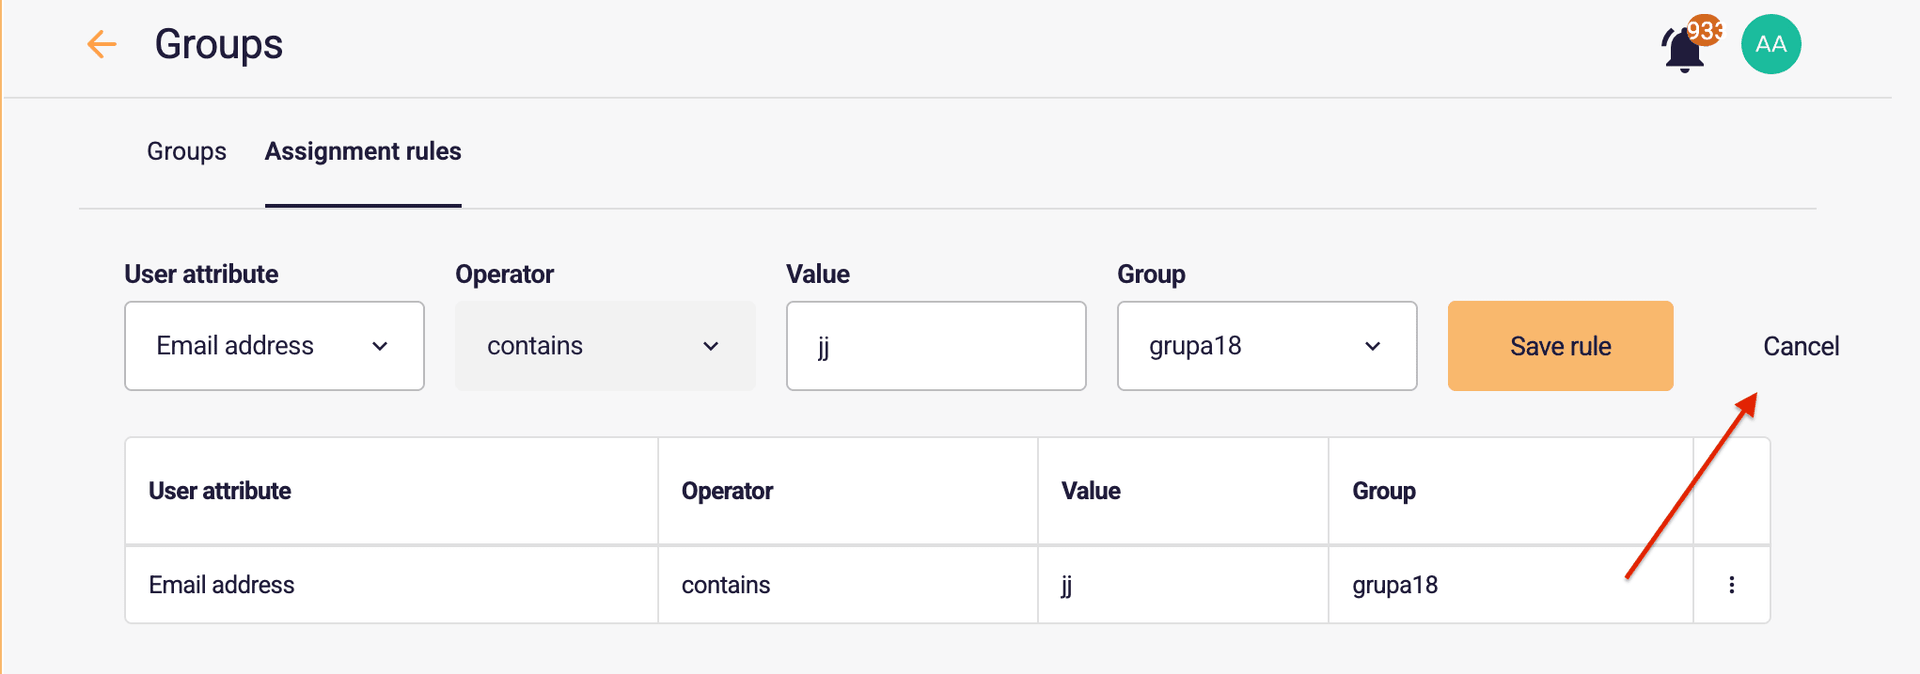
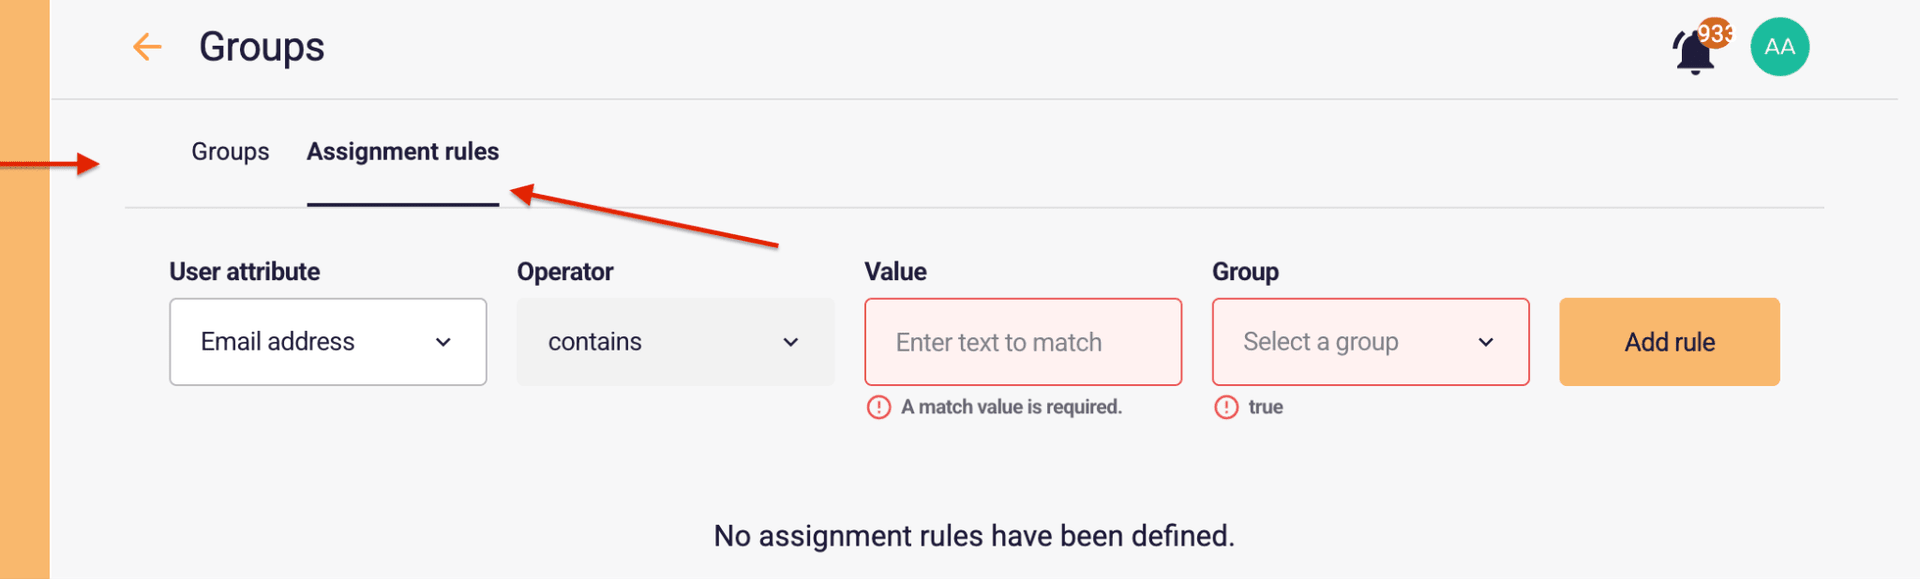
Section titled “👥 Put new users into the right groups automatically”Until now, someone signing in to Astrato for the first time belonged to no group at all, which meant they often could not open anything and had to wait for an administrator.
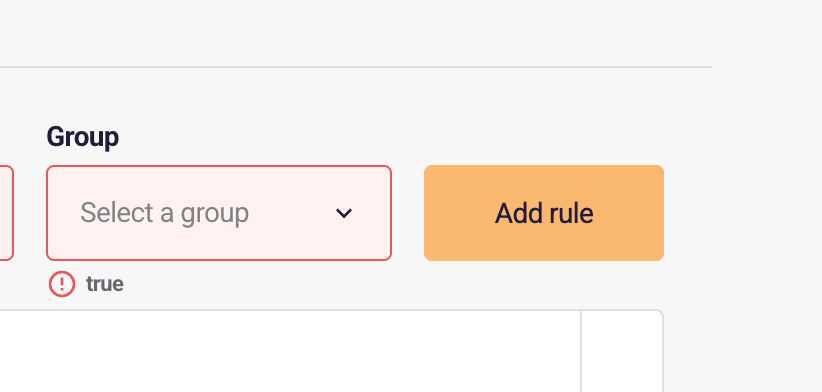
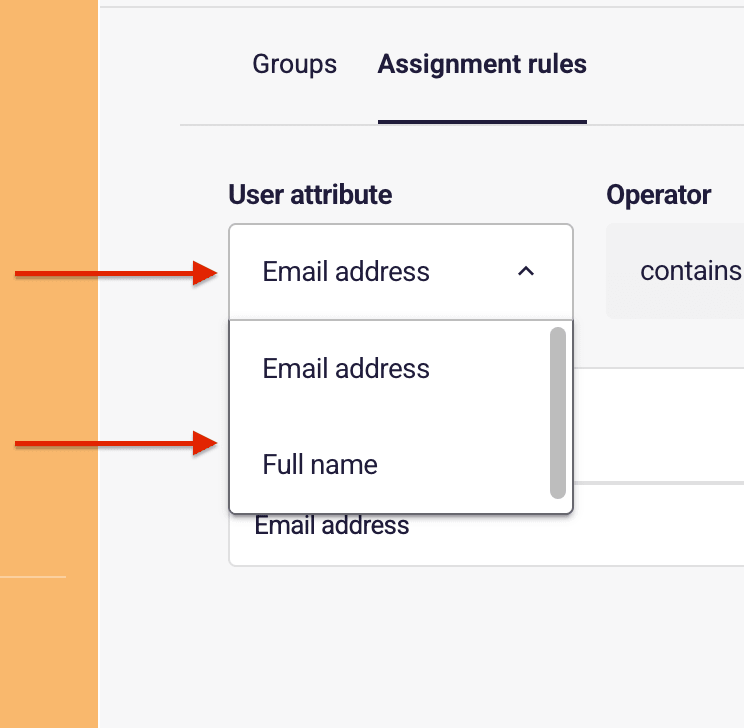
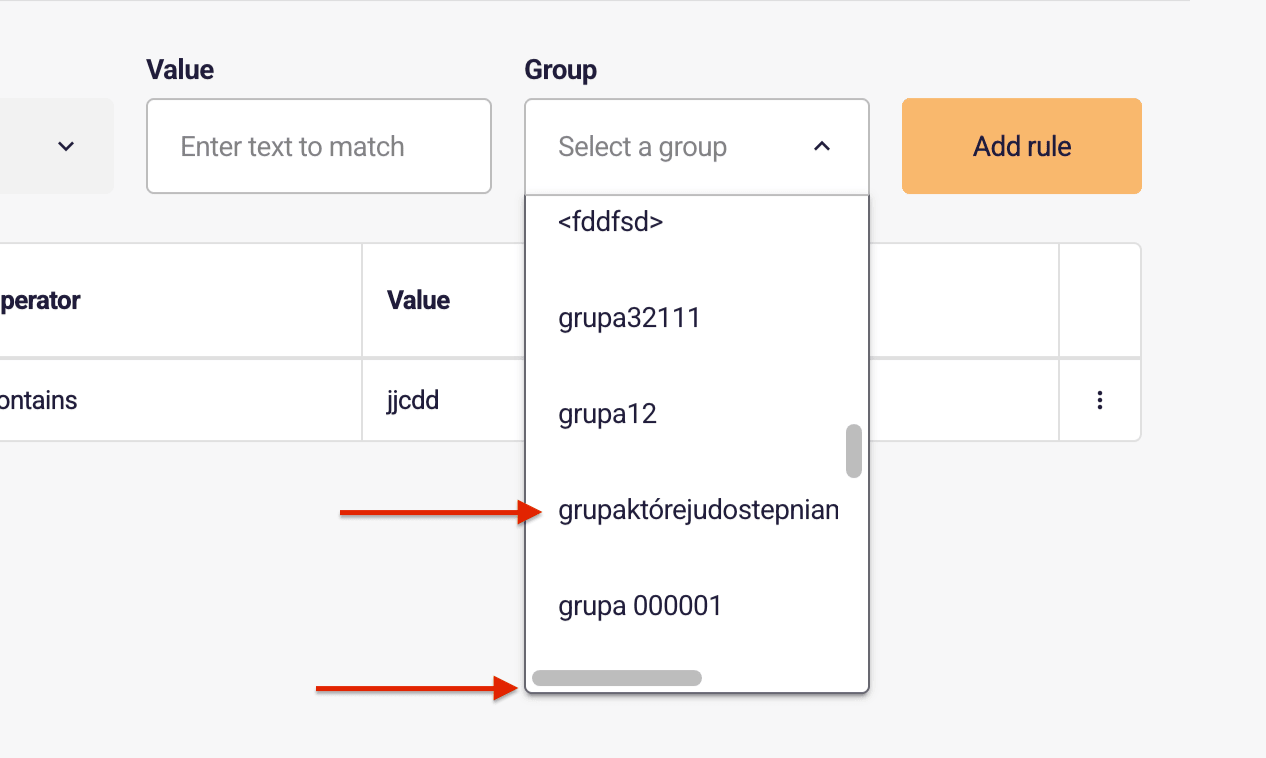
You can now write rules that place people into groups automatically as they arrive, matching on their email address or their name.
A rule might put everyone whose email ends in your company domain into a standard group, or route a partner domain somewhere more restricted. New starters get the right access on their first visit instead of raising a ticket.
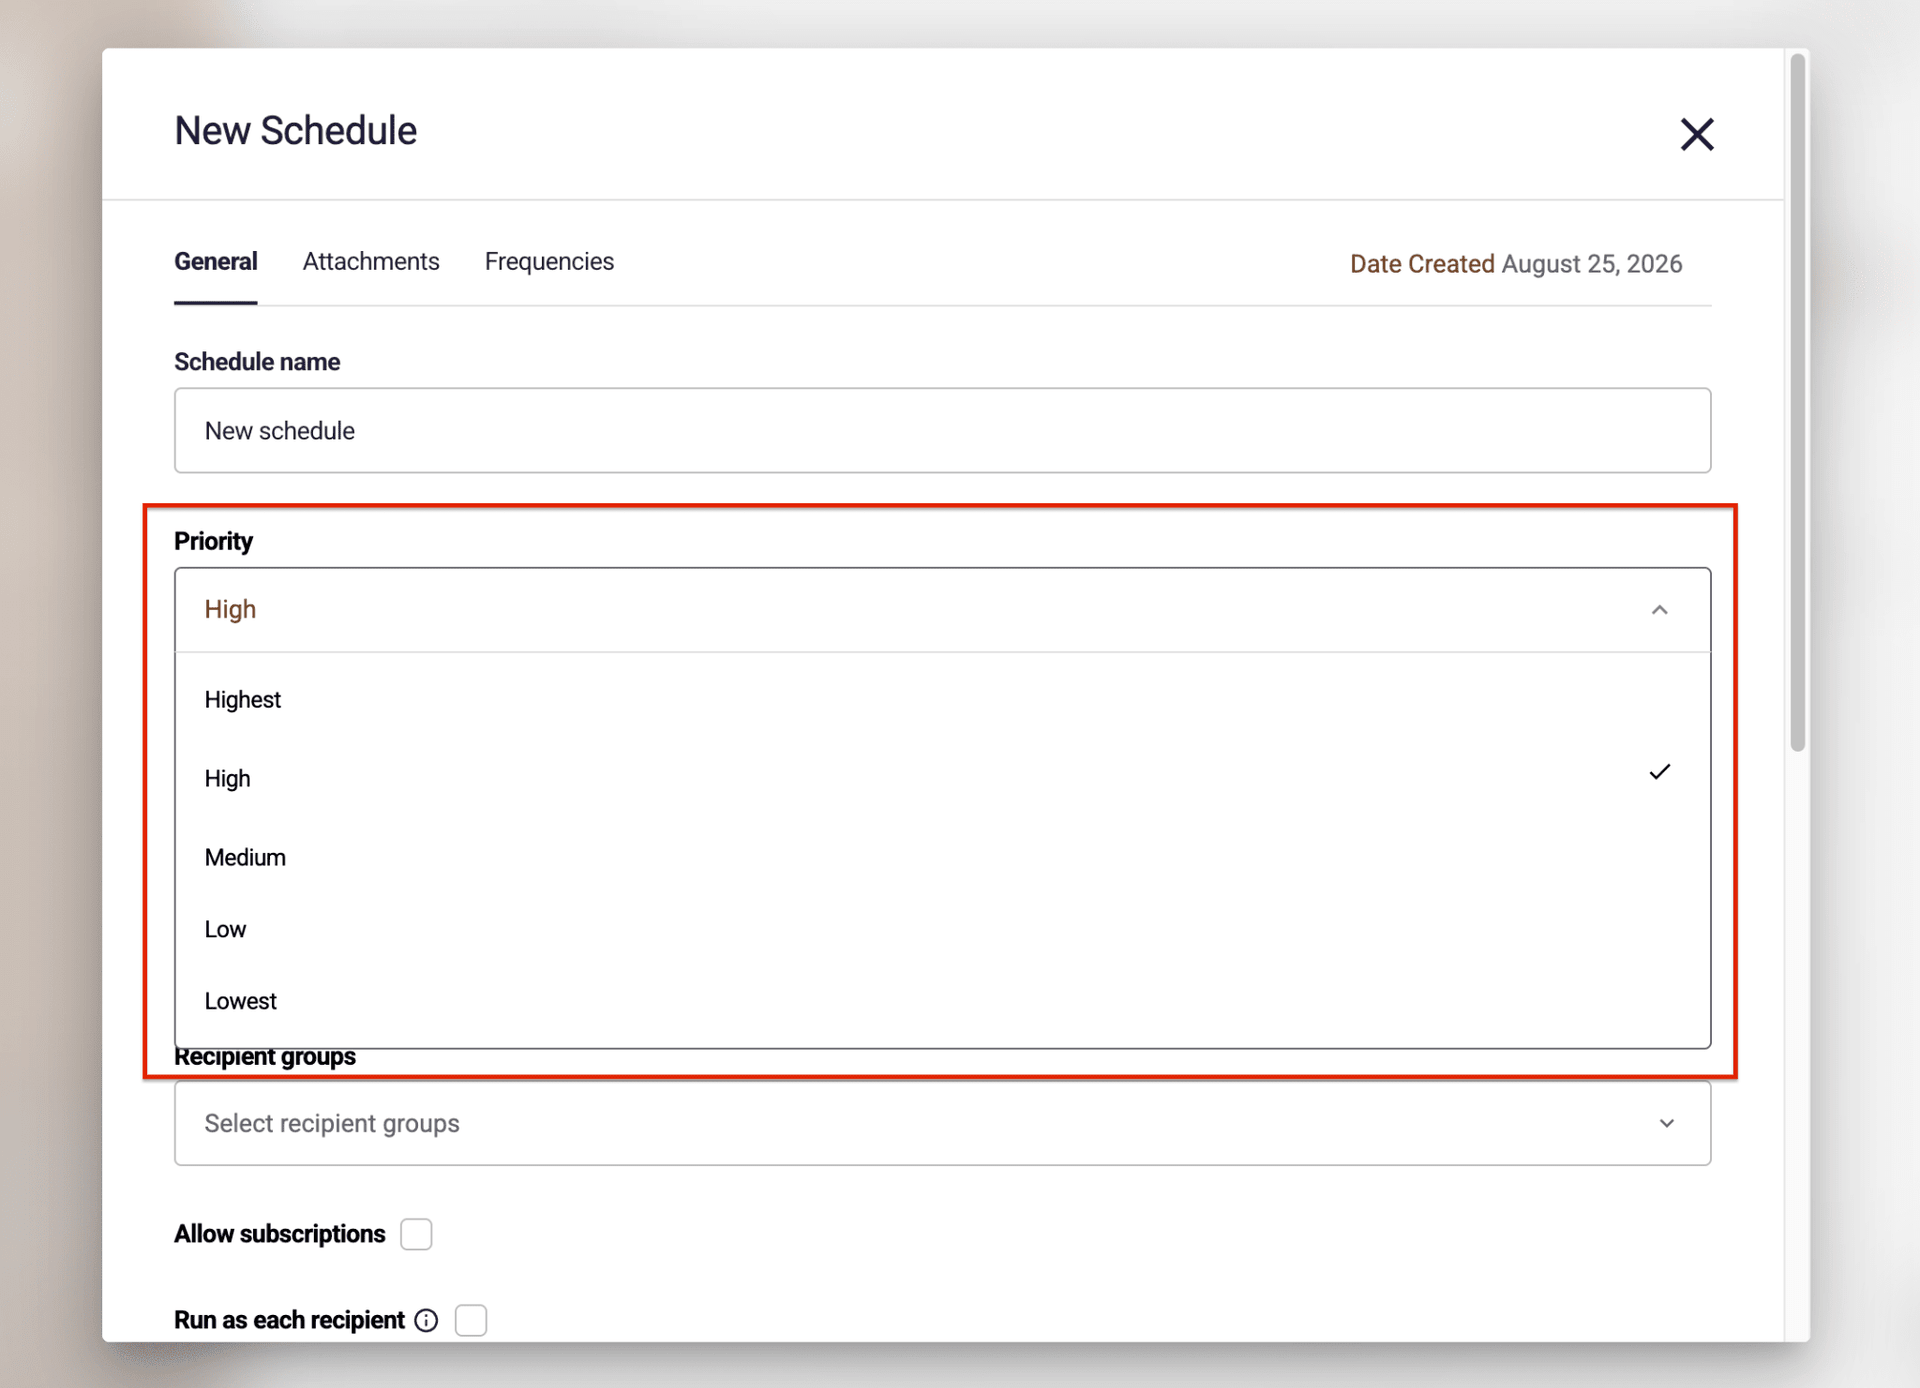
🚦📄 Set the priority of scheduled reports, and limit how many a person can run
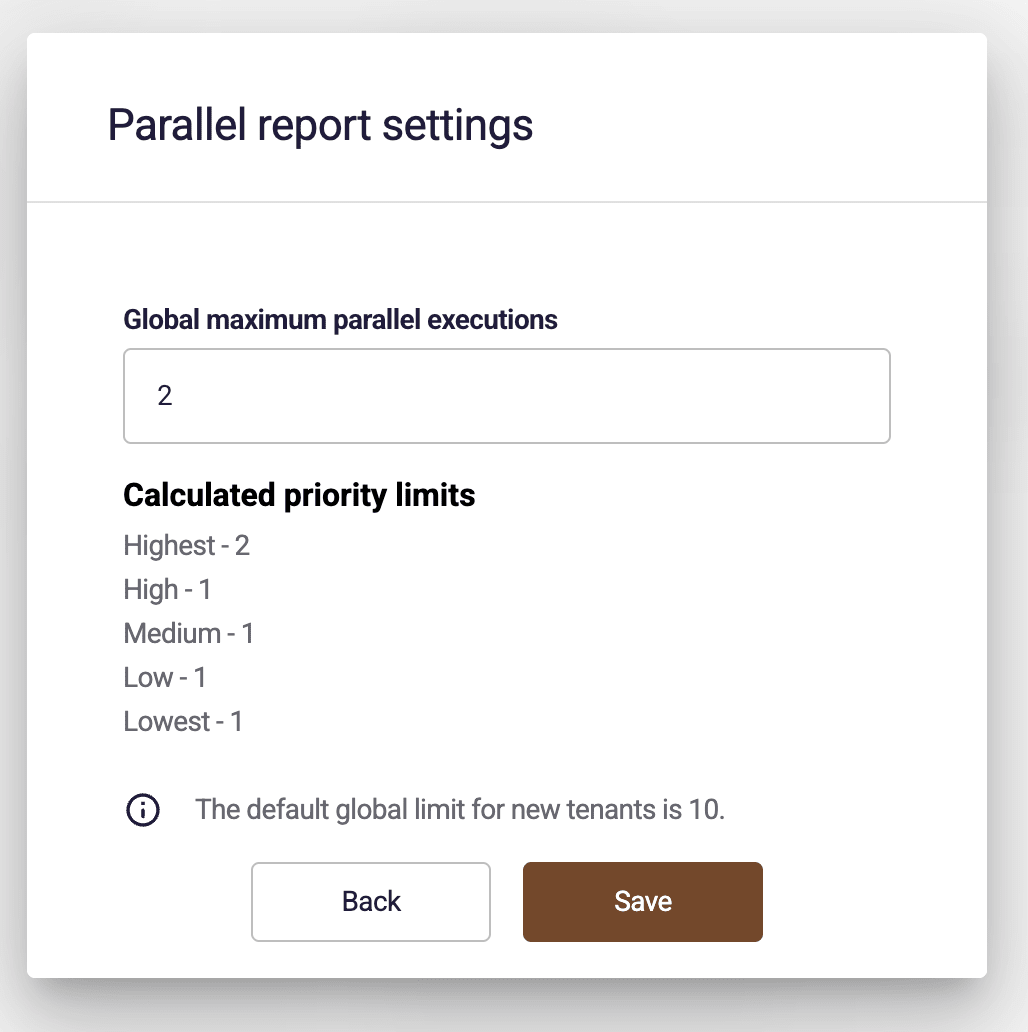
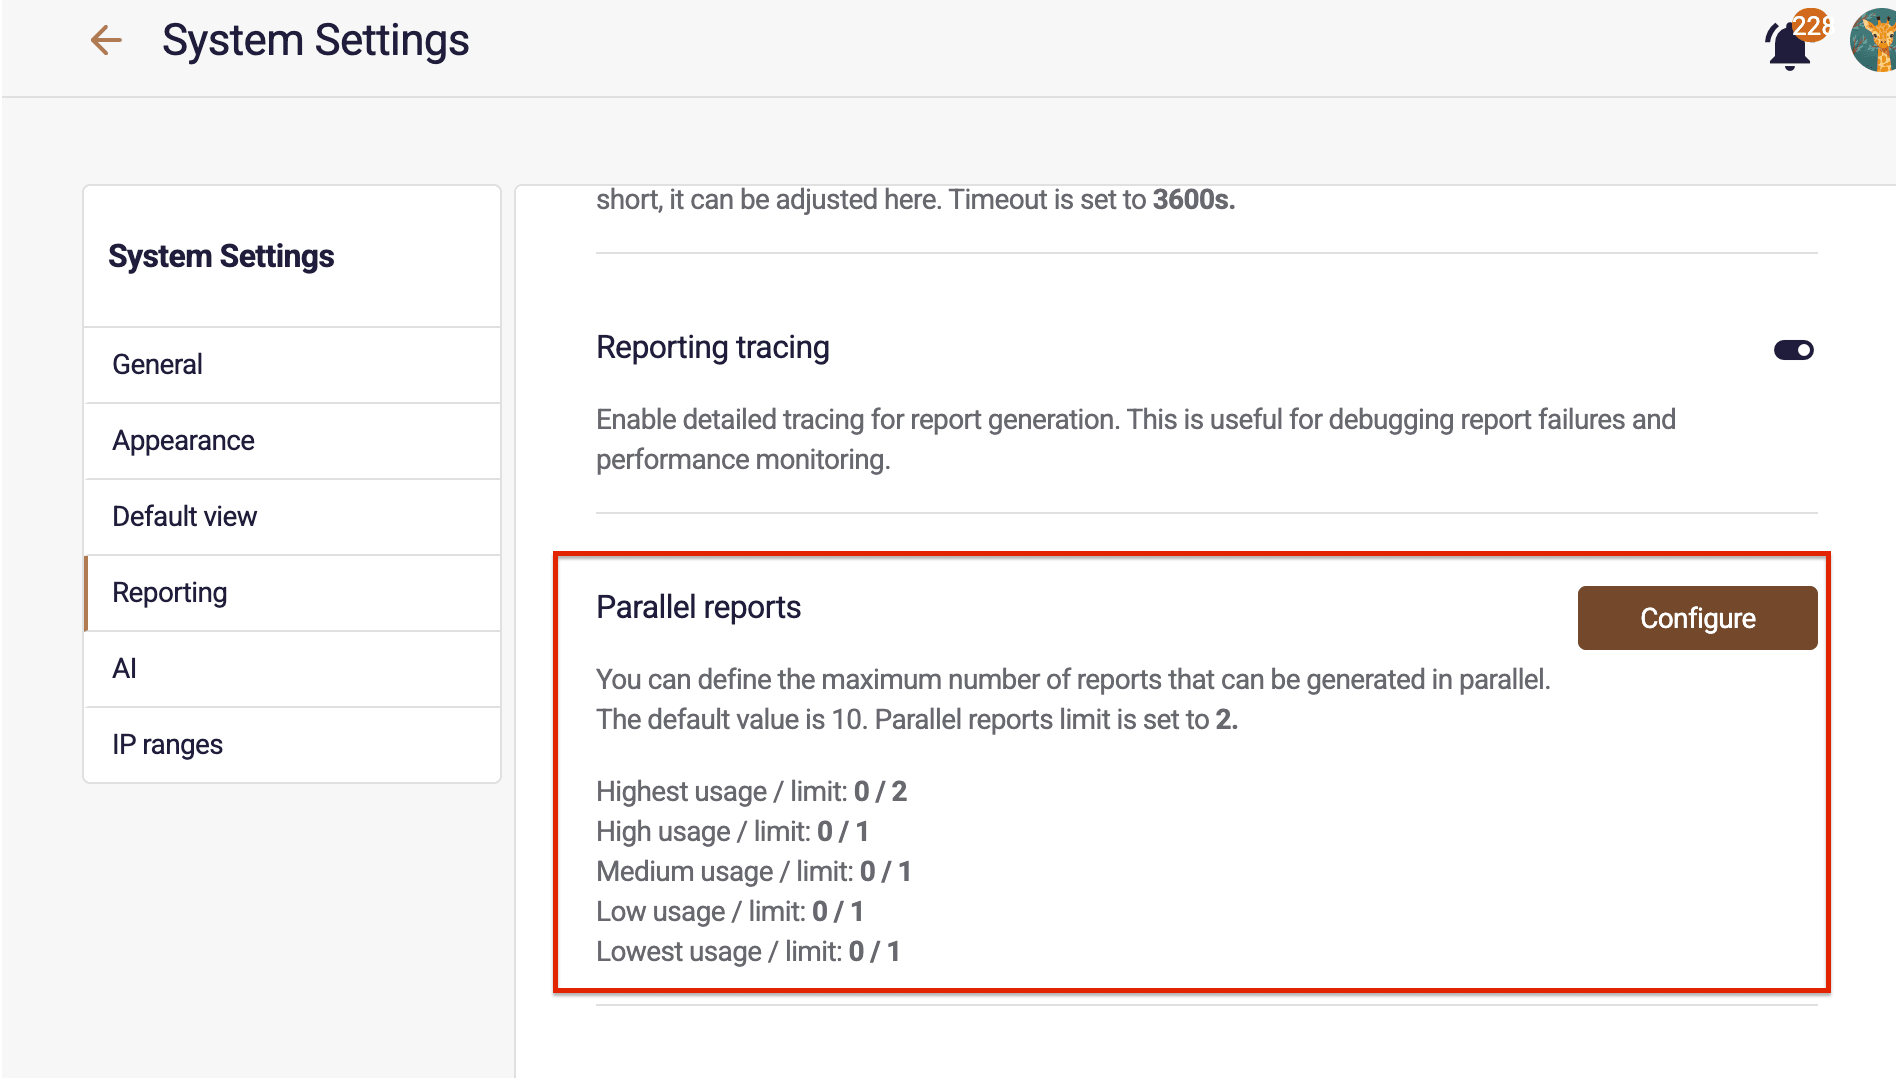
Section titled “🚦📄 Set the priority of scheduled reports, and limit how many a person can run”When a lot of reports run at the same time, the important ones can end up queued behind routine ones. Scheduled reports can now be given a priority from 1 (highest) to 5 (lowest), so the ones that matter most are executed first.
Reports triggered from Actions and Workflows run at priority 2. You can also limit how many reports a single user can have running at once, which stops one person’s bulk run from holding up everyone else.
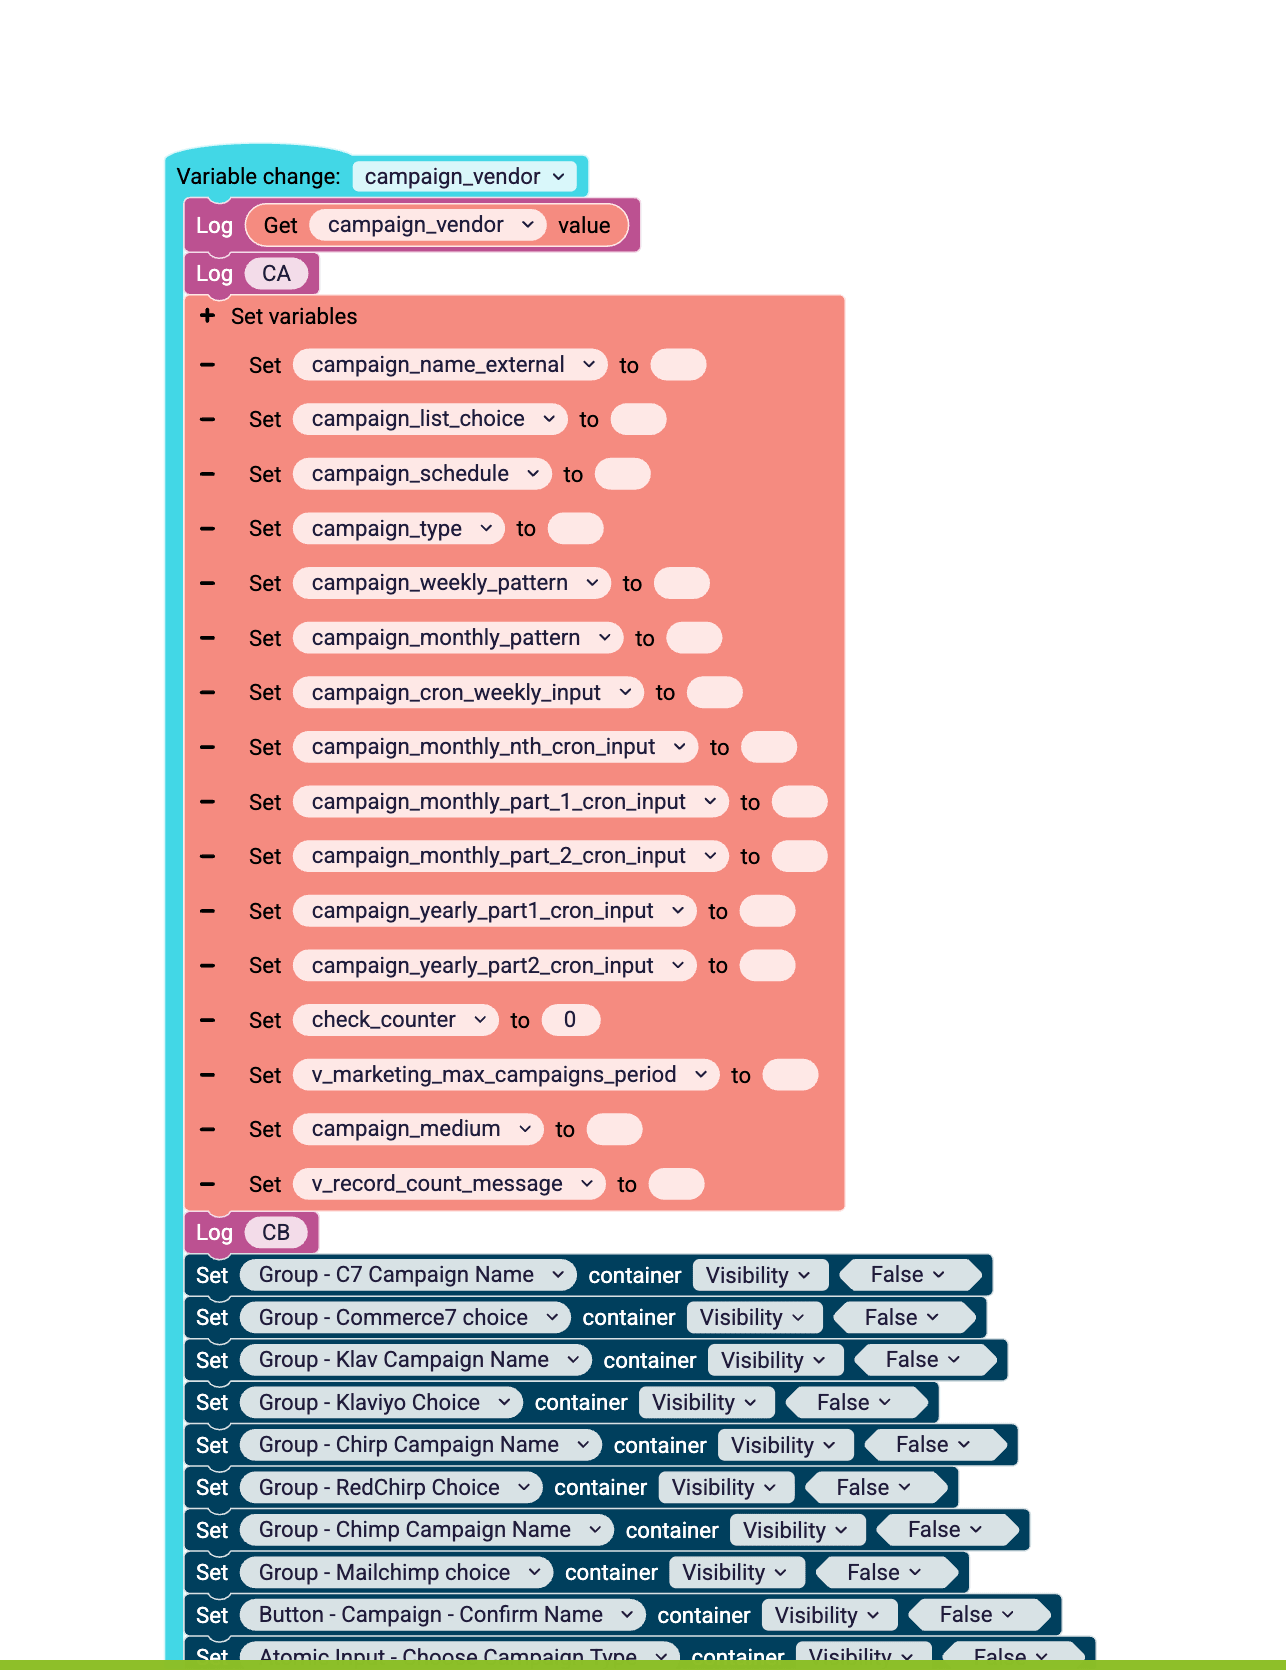
🧩 New Action Block: “Batch set variables”
Section titled “🧩 New Action Block: “Batch set variables””Actions that set several variables used to change them one at a time, with a short pause between each.
On a workbook changing many variables at once, that added up to a visible delay, and it was worse when the action was triggered by a variable change than by a button. The new Batch set variables block sets them together in a single step.
4.18.1 - 20 August 2026
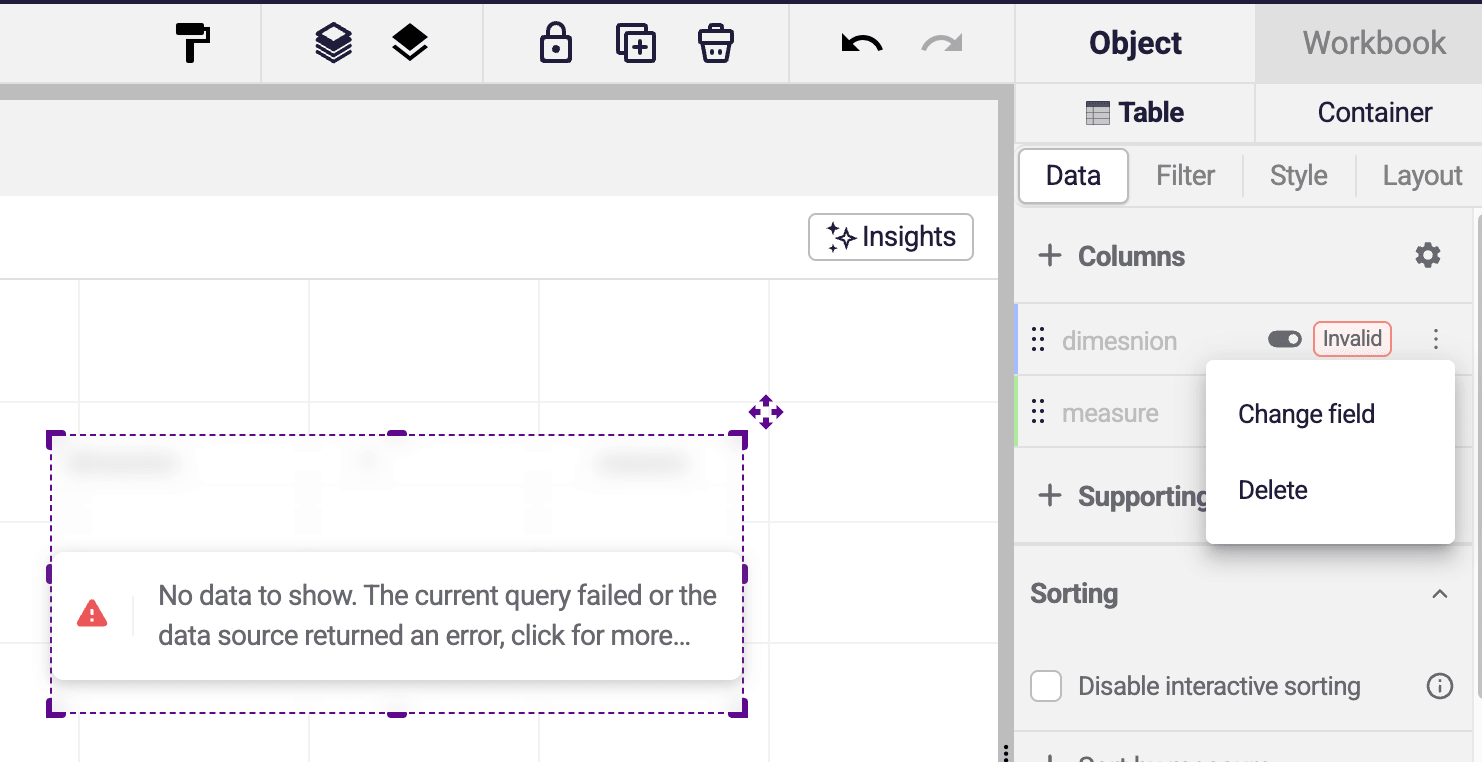
Section titled “4.18.1 - 20 August 2026”Remap invalid fields straight from the properties panel
Section titled “Remap invalid fields straight from the properties panel”When a chart references a field or measure that is no longer valid — renamed, moved or removed in the source — Astrato now flags it in the properties panel and lets you remap it to the correct field on the spot.
Previously fixing a broken chart meant navigating away from the properties panel and rebuilding the reference by hand.
Invalid fields are now easy to spot and correct in place, which cuts the time to repair content after a schema change and reduces the risk of mis-wiring a chart while doing it.
Actions: control sorting direction and read sorting state
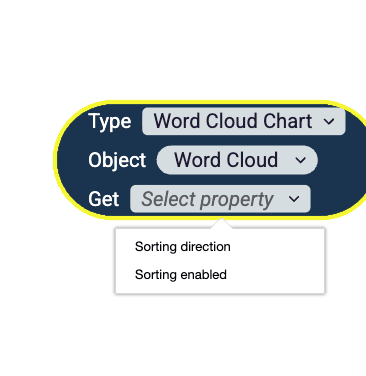
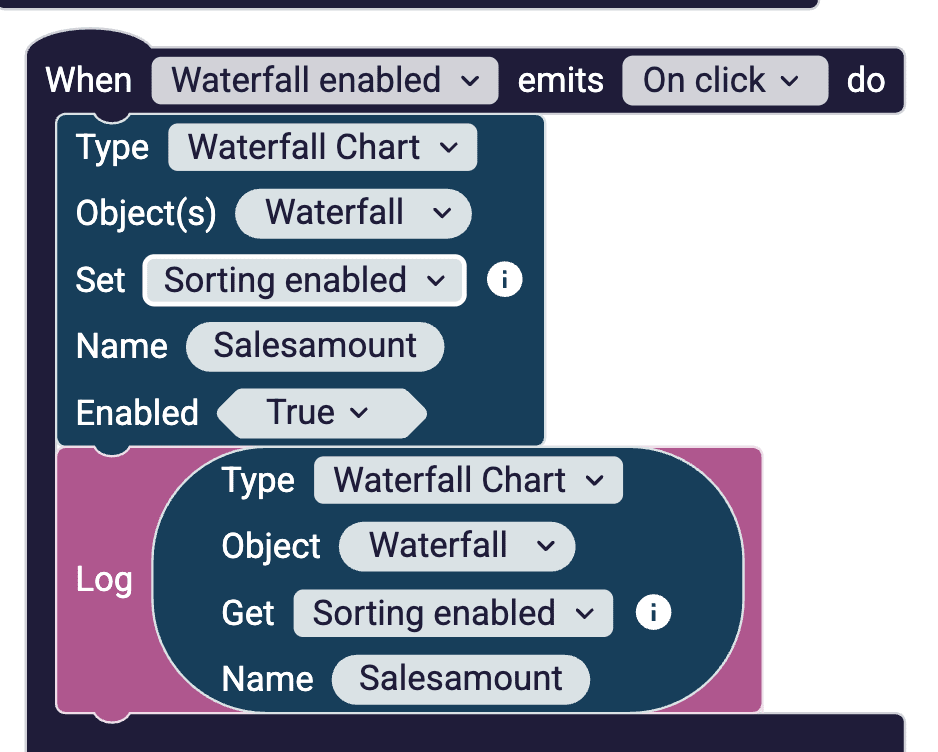
Section titled “Actions: control sorting direction and read sorting state”Actions can now drive sorting, not just toggle it. A new setSortingDirection operation sets ascending or descending order, and two new getters — getSortingEnabled and getSortingDirection — read the current sorting state back so you can build buttons and workflows that respond to it.
These are available across Bar, Combo, Dot, Gauge, Distribution Gauge, Heat Map, Histogram, Line, Pie, Radar, Sankey, Scatter, Table, Tree, Treemap, Waterfall, Word Cloud and Filter objects, and the existing setSortingEnabled operation now reaches Dot, Distribution Gauge, Histogram, Radar, Sankey, Tree and Filter too.
Sorting items are matched by the field name shown in the properties panel; an action updates every matching item, while a getter returns the first match in sorting order. For tables, dimension, measure, calculated and calculated conditional columns are all supported.
Writeback table: set a valid range for date field input
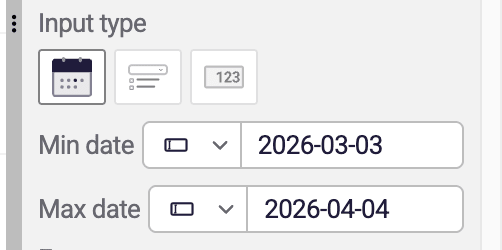
Section titled “Writeback table: set a valid range for date field input”Date fields in a writeback table can now be given a valid range, so the date picker only accepts values inside the window you define.
This keeps written-back dates within the bounds your process expects — no more out-of-range or accidental entries reaching the underlying table — and removes a class of data-quality checks that previously had to happen downstream.
Pivot table enhancements — the final two changes
Section titled “Pivot table enhancements — the final two changes”This release closes out the pivot table improvement programme with the two remaining changes.
You can now set where the horizontal scrollbar starts, matching the control already available on the bar chart, so a wide pivot opens on the columns you care about rather than always at the far left.
And column totals can now be placed at the end of the table instead of only on the left: when “show at the bottom” is selected, a new pivot-only setting moves the column totals to the end. It is off by default, so existing pivot tables keep their current structure until you choose otherwise.
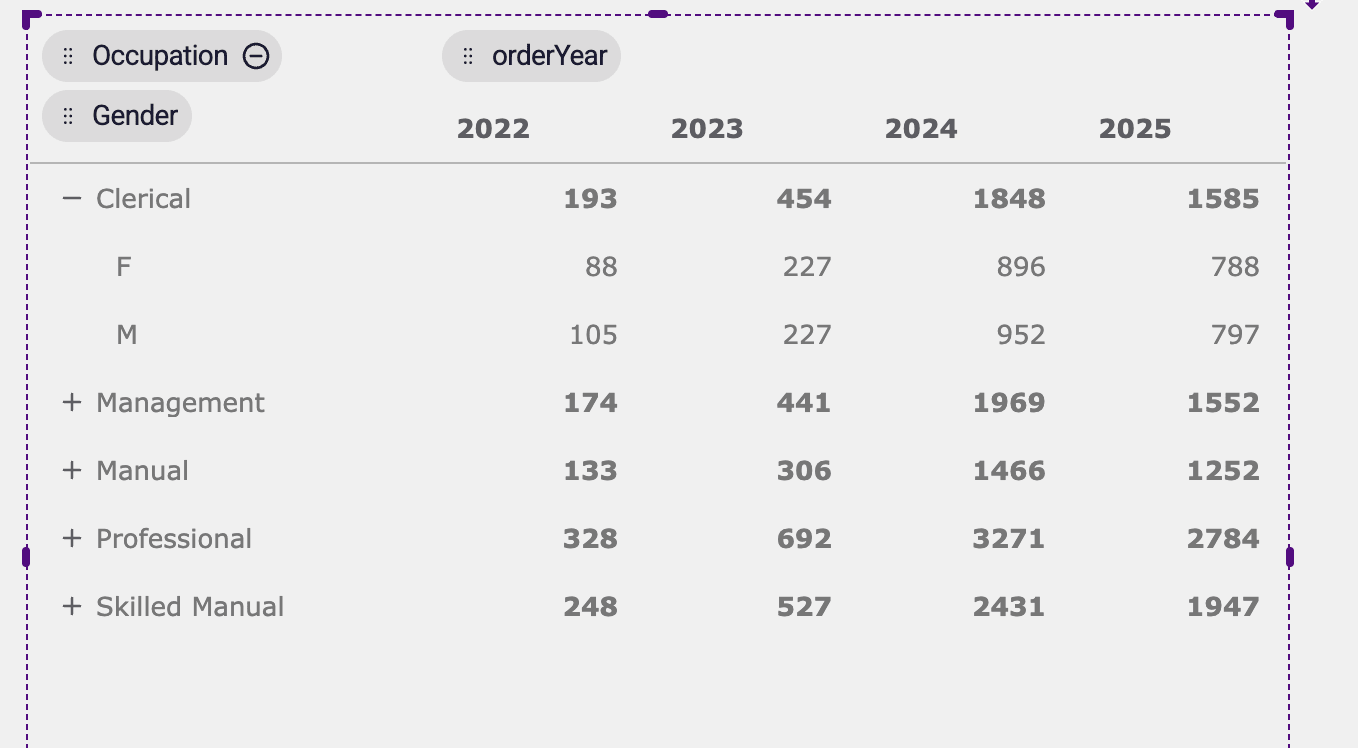
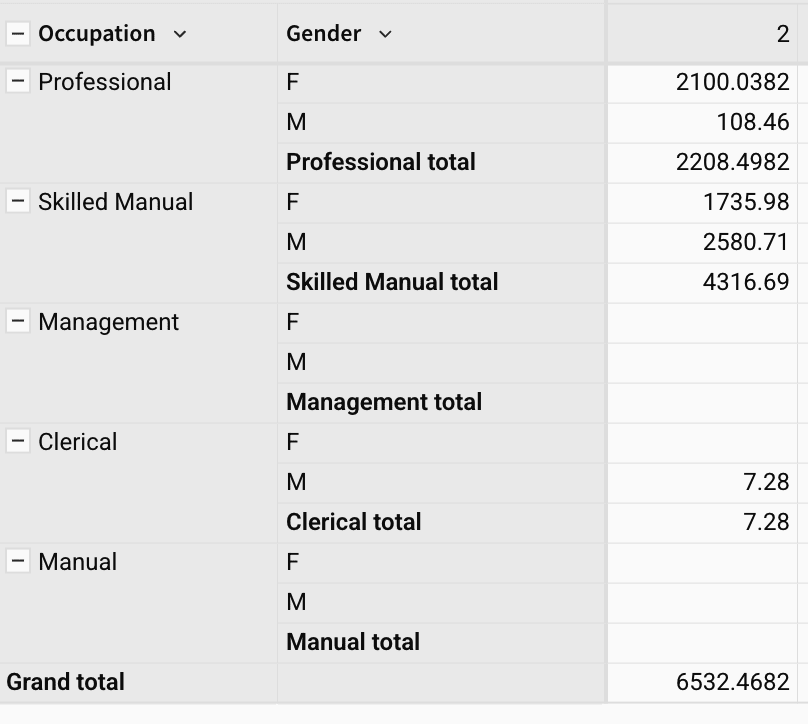
Table filter listbox now shows only the available values
Section titled “Table filter listbox now shows only the available values”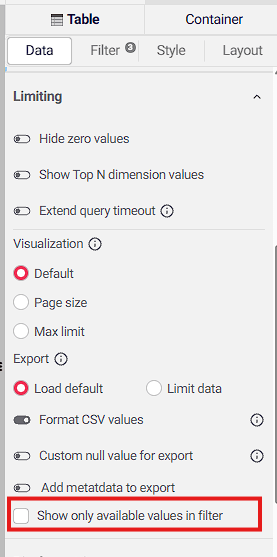
4.18 - 13 August 2026
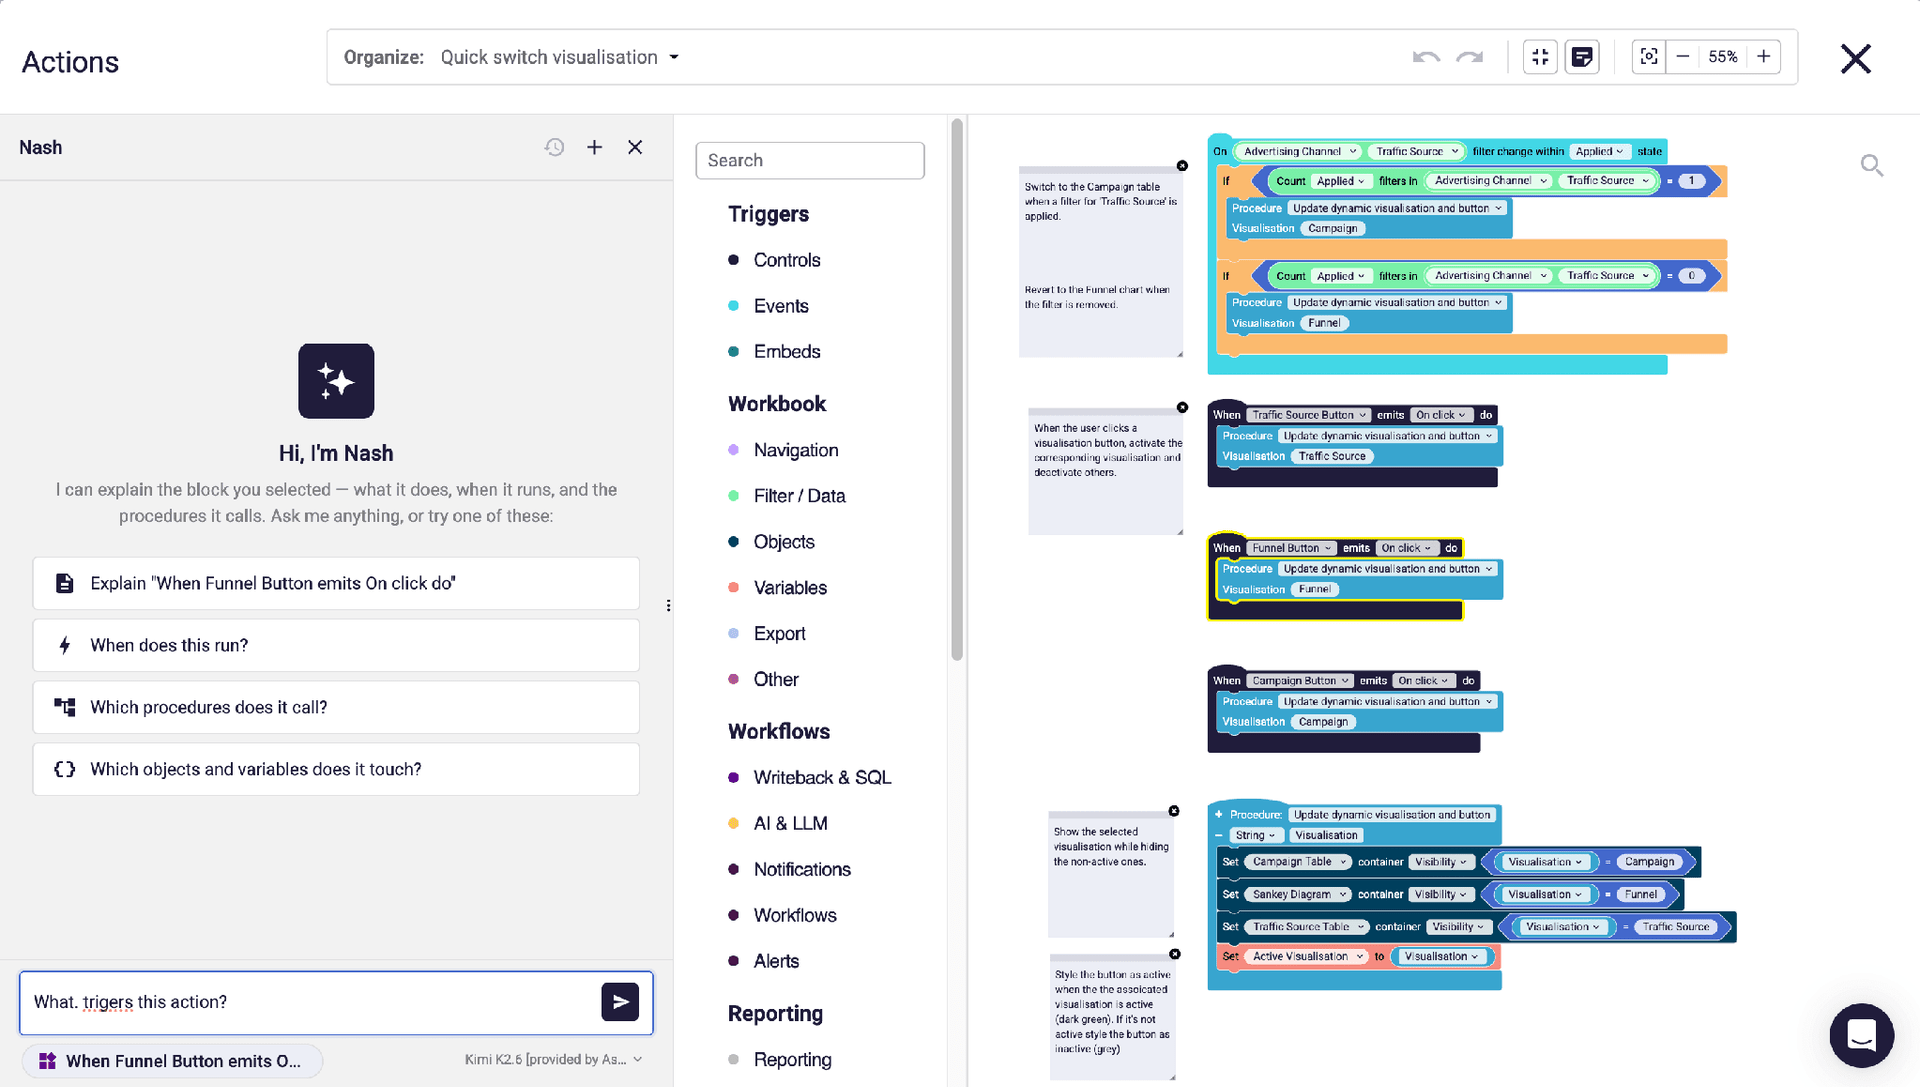
Section titled “4.18 - 13 August 2026”Nash for Actions — explain any workbook action in plain language
Section titled “Nash for Actions — explain any workbook action in plain language”Understanding an unfamiliar action used to mean reverse-engineering its logic step by step.
Nash for Actions brings Astrato’s AI assistant into the Actions editor — open the Nash panel next to the canvas and ask what the current action does.
Start from one-click questions — “Describe this action”, “What triggers it?”, “Explain the execution order”, “Which objects and variables does it use?” — or type your own.
Nash answers conversationally and keeps a separate history per action.
It is strictly read-only: it explains actions but never creates, edits, or deletes anything, sensitive values like secrets stay private, and if an action changes after an answer Nash flags that its explanation may be out of date.
Custom thumbnails for collections
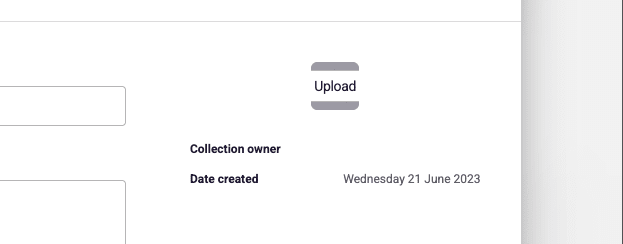
Section titled “Custom thumbnails for collections”Give collections their own visual identity: upload a custom image as a thumbnail, just as you already can for workbooks.
The edit-collection dialog is redesigned to match the workbook details layout, and now also surfaces the collection’s owner and created date.
Add-chart menu: search autocomplete no longer covers the chart icons
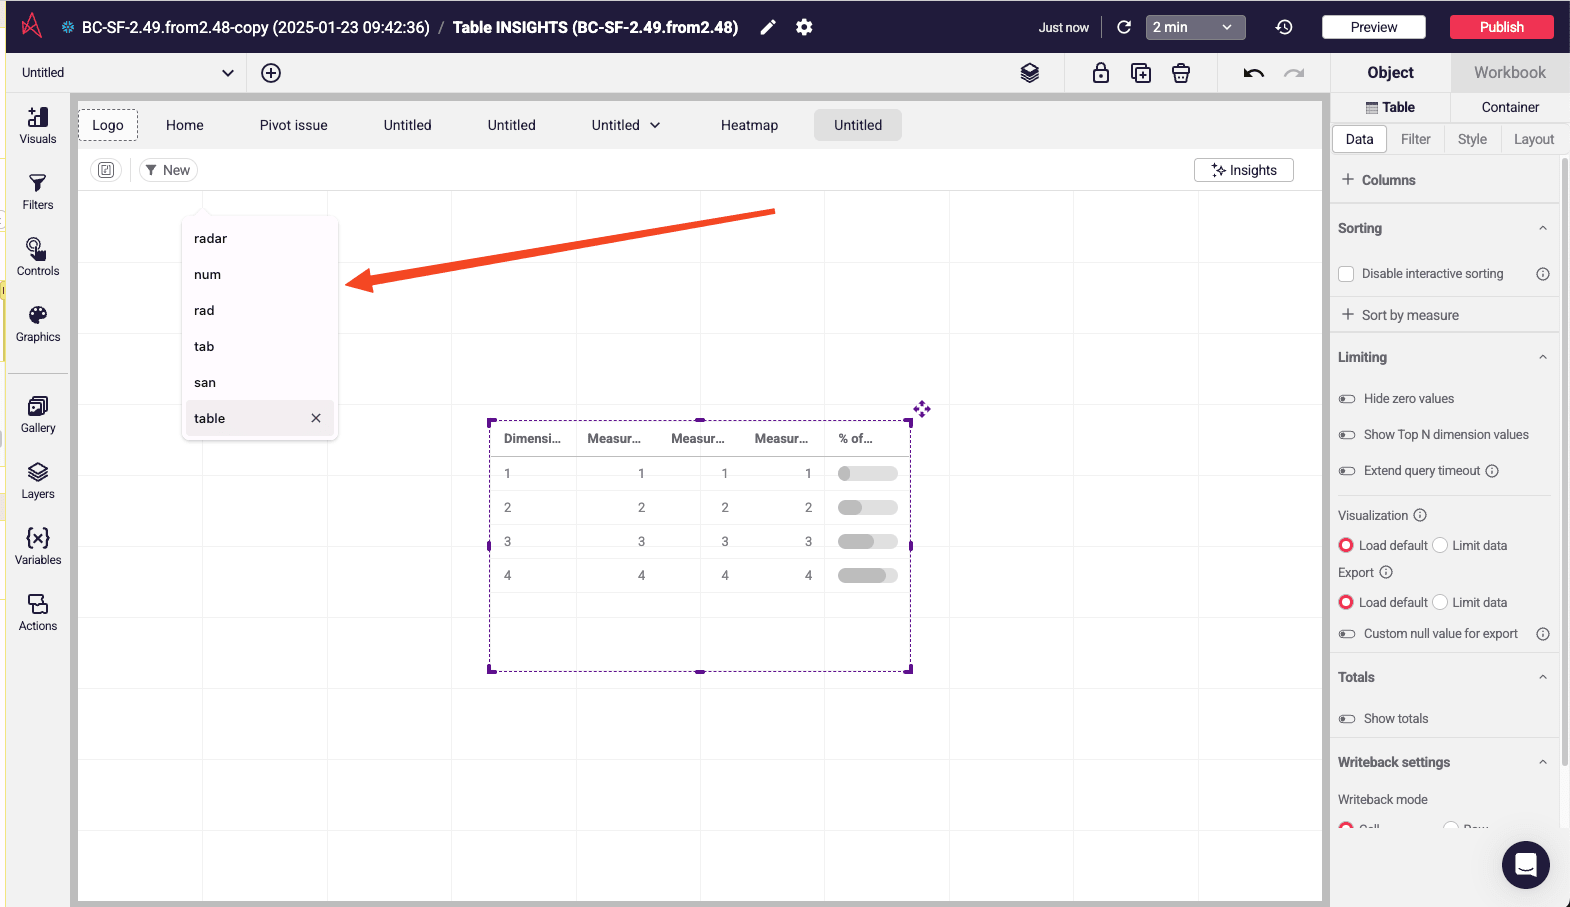
Section titled “Add-chart menu: search autocomplete no longer covers the chart icons”When you add a chart, the search box no longer pops up the browser’s autocomplete list over the chart icons.
That suggestion list used to appear the moment you opened the Add-chart menu — hiding the icons beneath it, and sometimes lingering even after the menu was closed.
Autocomplete is now switched off for that field, so the full set of chart types stays visible while you search.
Reporting: email addresses with capital letters now validate correctly
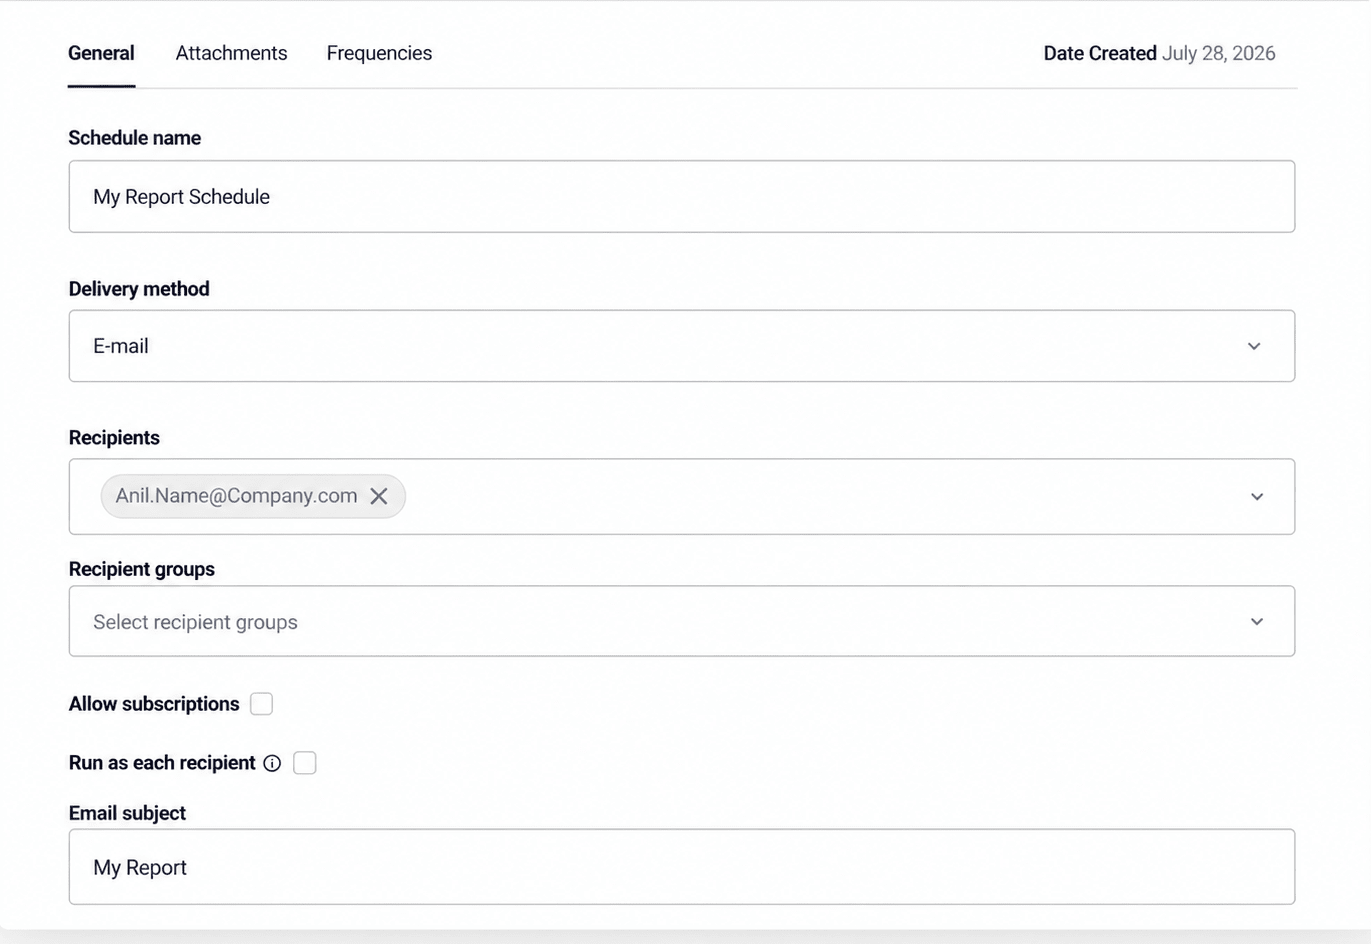
Section titled “Reporting: email addresses with capital letters now validate correctly”Scheduled-report distribution lists now accept recipient emails that contain capital letters. Previously a valid tenant user whose address included uppercase letters (for example Anil.Name@Company.com) could be wrongly rejected with “not all recipient emails belong to the tenant”; recipient matching is now case-insensitive.
4.17.1 - 11 August 2026
Section titled “4.17.1 - 11 August 2026”The Astrato Excel Add-in is now available!
Section titled “The Astrato Excel Add-in is now available!”Some of your most important work still happens in Excel — forecasts, financial models, reconciliations, board packs, and operational reporting.Until now, getting trusted data into those spreadsheets meant exporting, copying, reformatting, and rebuilding work every time the numbers changed.Not anymore.The Astrato Excel Add-in connects Excel directly to your governed semantic layer, bringing trusted data into spreadsheets as native Excel formulas and reusable datasets that refresh on demand.With it, you can:
-
Import governed datasets directly into Excel
-
Keep your existing formulas, pivots, charts, and models intact
-
Refresh data on demand without rebuilding your spreadsheets
-
Share workbooks with the latest data included (no login required to view)
All while your data team stays in control — every refresh respects the signed-in user’s permissions and is powered by your governed semantic layer.Available today for Excel on Windows, Mac, and Excel for the web.Useful links
Documentation → Coming next: Writeback from Excel, allowing users to push values back into Astrato and complete the loop between governed analytics and spreadsheet workflows.
Writeback table: bulk updates
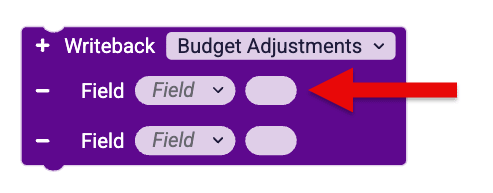
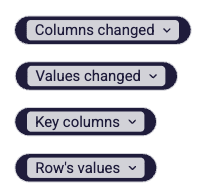
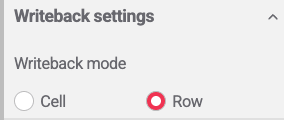
Section titled “Writeback table: bulk updates”Edit many rows of a writeback table in one go. This release brings
-
bulk inserts
-
bulk edits and
-
writeback delete
backed by a new engine-level bulk update. An unsaved-changes warning appears if you navigate away before saving, so in-progress edits are never lost.


Dynamic gradient scales for tables
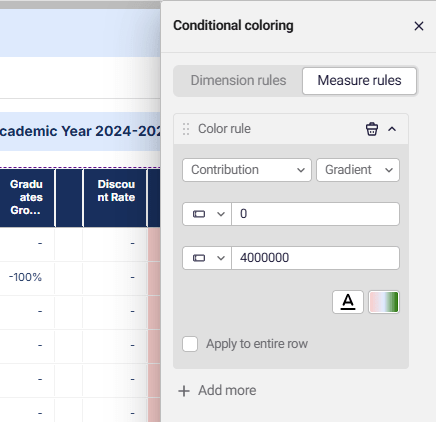
Section titled “Dynamic gradient scales for tables”Colour-scale a table column automatically from its own minimum and maximum values, so the highest and lowest figures stand out at a glance without setting manual thresholds — useful for spotting outliers in a dense table.

Auto-connect variables and parameters
Section titled “Auto-connect variables and parameters”When a variable and a parameter share the same name, Astrato now links them automatically, removing a manual wiring step when you build parameter-driven content.
New - Sorting & supporting measures for Alternates
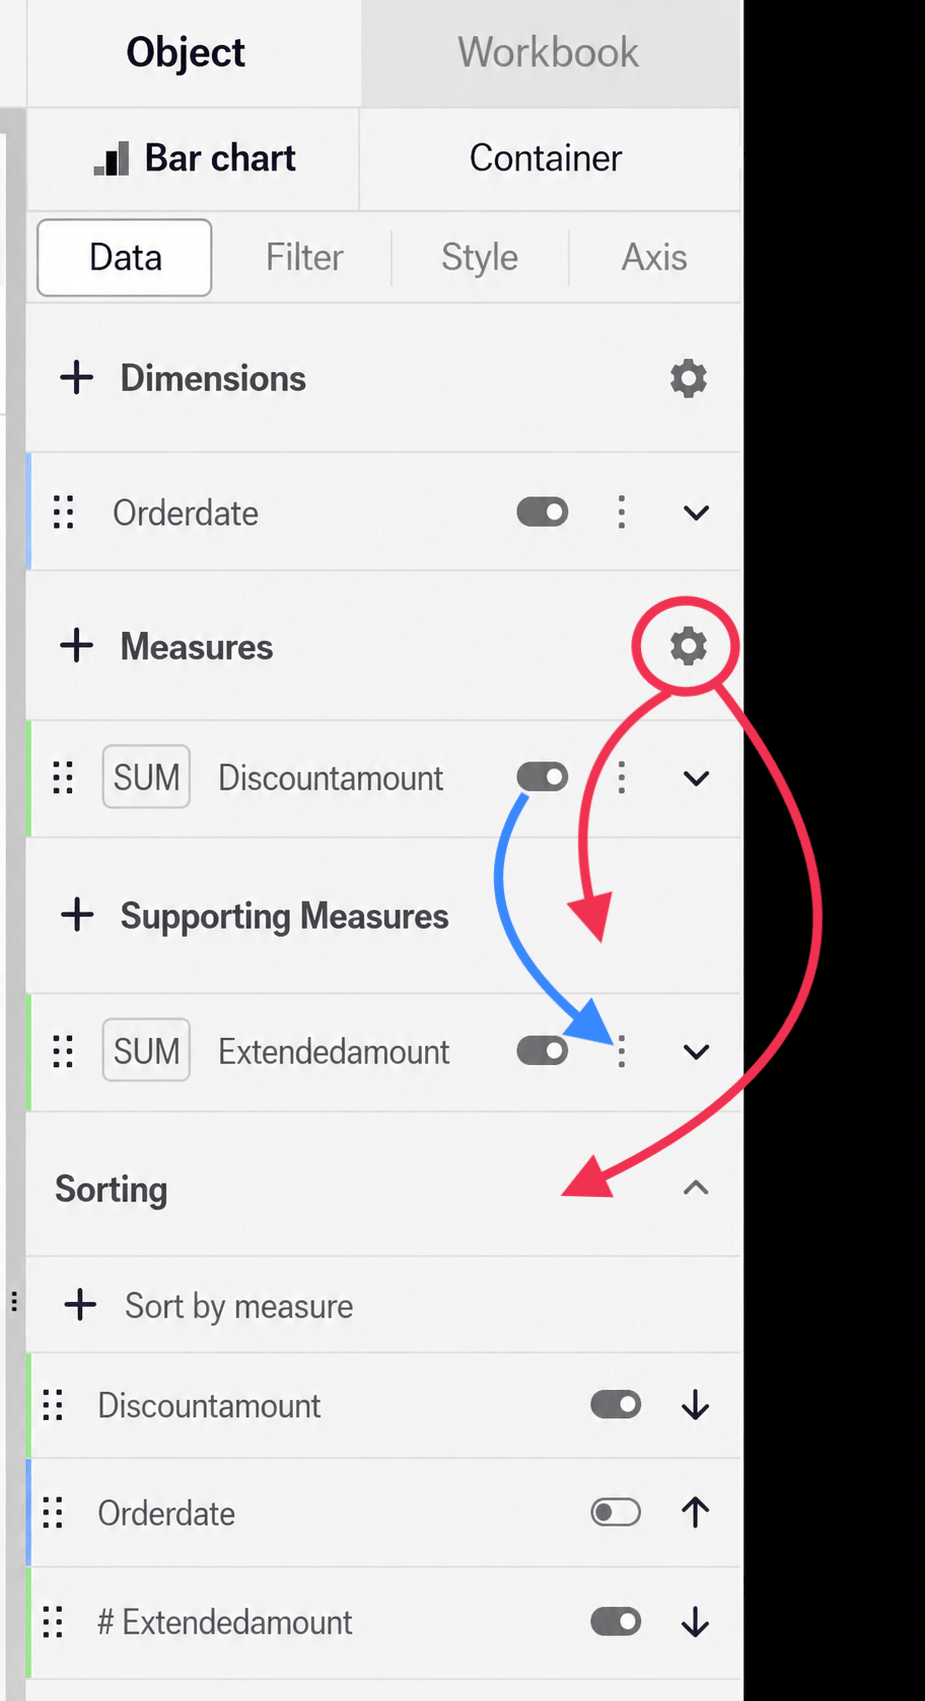
Section titled “New - Sorting & supporting measures for Alternates”Alternate visualizations — Sankey, heatmap, treemap and pie — now support sorting and supporting measures, closing the gap with standard charts so you can order and enrich them the same way.
4.17 - 03 August 2026
Section titled “4.17 - 03 August 2026”New action blocks: “Wait for object” and “Wait for sheet”
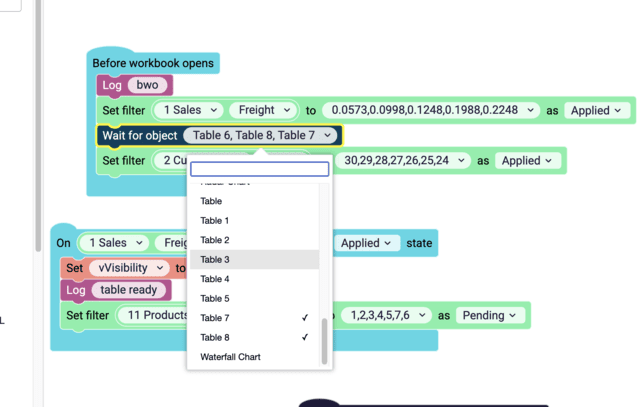
Section titled “New action blocks: “Wait for object” and “Wait for sheet””Build more reliable automations. Action sequences can now pause until a specific object or sheet is ready before the next step runs.
New “Wait for object” action block:

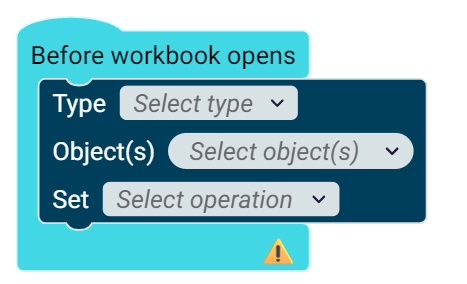
New “Before workbook opens” action block
Example of use:
Turn off in-product support for viewers
Section titled “Turn off in-product support for viewers”Admins can now disable the Astrato support messenger for viewer users from Tenant Settings — useful when viewers shouldn’t contact support directly.
Also improved
-
Reference a parent object’s ID within an action chain (“Get parent object ID”).
-
Clearer confirmation when you use the “Use latest version” button.
-
Bookmarks now handle locked fields in the filter bar correctly.

Looking for earlier releases? See the historical release notes.