

Financial Times style
This style follows the observable traits of the Financial Times’ charts: a salmon paper ground shared by page and chart, a bold headline that states the finding, a lighter subtitle with the unit, a palette led by dark blue and claret, and a small source line. There are no borders, cards or shadows. It does not use the publication’s logo or proprietary fonts.
Headlines, subtitles and source lines are host HTML; the chart is styled with operations. See Colour visualizations with operations. Sizing tokens are on Tokens.
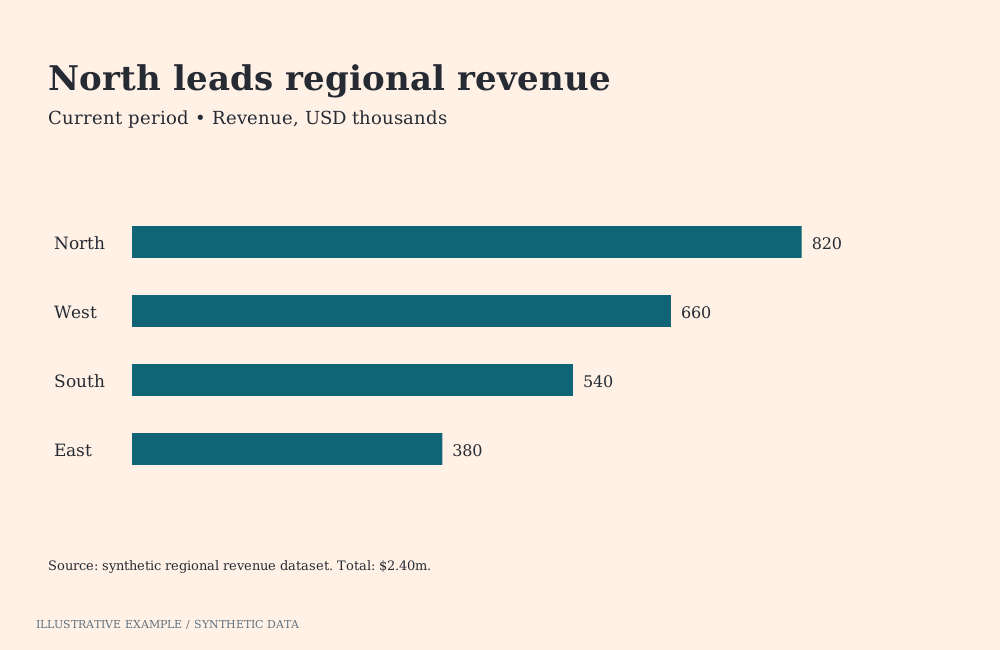
Illustrative example with synthetic data. Salmon ground, editorial type and restrained chart chrome.
When to use the Financial Times style
Section titled “When to use the Financial Times style”Use it for financial and economic reporting where each chart makes one point and the page reads as a printed briefing: market updates, investor and board reports, and research notes.
| The page is mainly | Use instead |
|---|---|
| Finding-as-title charts on a plain white ground | Economist |
| A presentation that leads to one decision | Storytelling with data |
| Indicators read beside prose | Explainer |
| Many items compared at a glance, colour carrying categories | Information is Beautiful |
| A long narrative read by scrolling | Visual essay |
| A dashboard that looks like the tenant’s Workbooks | Astrato default |
Use cases
Section titled “Use cases”| Use case | What the page shows |
|---|---|
| Market update | Indices and yields as line charts, each headline stating the move |
| Company results | Revenue and margin by quarter as grouped columns, margin in claret |
| Investor or board report | A few charts per page, each with a source line so it can be lifted out |
| Economic research note | Short paragraphs, each followed by the chart that supports it |
Tokens
Section titled “Tokens”Define the tokens once and redefine them for dark; see Define colour tokens. The dark theme keeps a warm ground.
:root {  --page: #fff1e5;  --surface: var(--page);  --tint: #f2dfce;  --ink: #33302e;  --muted: #66605c;  --line: #ccc1b7;
  /* Series, in order of use. */  --series-1: #0f5499;  --series-2: #990f3d;  --series-3: #0d7680;  --series-4: #b3530c;
  --font: 'Inter', Arial, sans-serif;
  --space-1: 4px;  --space-2: 8px;  --space-3: 16px;  --space-4: 32px;}:root[data-theme='dark'] {  --page: #2b2320;  --tint: #3a302c;  --ink: #fff1e5;  --muted: #c2b6ab;  --line: #4f4540;
--series-1: #6fa8ff; --series-2: #ff7faa; --series-3: #33c1c9; --series-4: #ff9b4a;}- Font. Inter is openly licensed and served by Google Fonts; see Load visualization fonts.
- Series order.
--series-1for the main measure,--series-2for the measure the headline is about or a comparison, then--series-3and--series-4. Use no more than four. --tintis the one fill: the table row highlight, or a band behind a group of charts.- Figures. Use
font-variant-numeric: tabular-numswherever figures stack in a column.
Page and card chrome
Section titled “Page and card chrome”No card borders, fills or shadows; page and chart share the salmon ground. The Card supplies structure; this style sets its tokens and type.
<figure class="chart"> <figcaption> <h2 class="chart-title">Bond yields have climbed back to their 2023 high</h2> <p class="chart-subtitle">10-year government bond yield, %</p> </figcaption> <div class="chart-host"></div> <p class="chart-note">Source: central bank</p></figure>:root { /* The Card's tokens; see /app-components/object-frame/#css. */ --panel-border: 0; --radius: 0; --panel-shadow: none; --frame-pad-x: 0px; /* 1px more than the Card's 6px, because there is no border. */ --frame-pad-y: 7px; --frame-title-h: 26px; --frame-subtitle-h: 18px; --frame-note-h: 16px; /* 7 + 26 + 18 + 7 = 58px of card around a 200px plot. */ --chart-min: 258px;}
body { margin: 0; background: var(--page); color: var(--ink); font: 400 16px / 1.45 var(--font);}.chart-title { font-family: var(--font); font-weight: 600; font-size: clamp(16px, 3.8cqi, 22px);}.chart-subtitle { font-family: var(--font); font-size: clamp(13px, 3cqi, 16px);}.chart-note { font-family: var(--font); font-size: 12px;}- Set font longhands only; a
fontshorthand resetsline-heightand moves the text out of its row. --chart-minis 6px more than the Card’s default and the source line adds 16px: 274px per card. Add the difference per chart row to the scrolling threshold; see Calculate a scrolling threshold.
Charts
Section titled “Charts”Read token values from script, pass them as payloads, and re-apply them when the theme changes; see Switch themes in place. The built-in chart theme has a white background and axis charts have no background operation, so check each chart on the salmon ground in both themes.
Axes, bar and line
Section titled “Axes, bar and line”The axis operations take an axisName; bar and line use dimension and primaryMeasure. Other
axis types publish the same operations with their own axis names; check the type’s operations page.
| Setting | Operation | Value |
|---|---|---|
| No line or ticks on the value axis | setShowAxisLine, setShowAxisTicks |
primaryMeasure: false |
| A baseline on the category axis | setShowAxisLine, setAxisLineColor |
dimension: true, --ink |
| Category ticks | setAxisTickColor |
dimension: --line |
| Axis labels | setAxisLabelColor |
Each axis: --muted |
| No axis titles; the subtitle states the unit | setShowAxisTitle |
Each axis: false |
const token = (name: string) => getComputedStyle(document.documentElement).getPropertyValue(name).trim();
const axisOperations = [  { name: 'setShowAxisLine', payload: { axisName: 'primaryMeasure', showAxisLine: false } },  { name: 'setShowAxisTicks', payload: { axisName: 'primaryMeasure', showAxisTicks: false } },  { name: 'setShowAxisLine', payload: { axisName: 'dimension', showAxisLine: true } },  { name: 'setAxisLineColor', payload: { axisName: 'dimension', lineColor: token('--ink') } },  { name: 'setAxisTickColor', payload: { axisName: 'dimension', tickColor: token('--line') } },  ...(['dimension', 'primaryMeasure'] as const).flatMap((axisName) => [    { name: 'setAxisLabelColor', payload: { axisName, labelColor: token('--muted') } },    { name: 'setShowAxisTitle', payload: { axisName, showAxisName: false } },  ]),];
Check each result; see Check operation results.
Bar and line
Section titled “Bar and line”| Type | Setting | Operation | Value |
|---|---|---|---|
| Bar, line | Colour per measure | setMeasureGraphColor |
The series tokens in order |
| Bar, line | No label backdrop, so labels sit on the paper | setMeasureDataLabelShowBackdrop |
false |
| Bar | Horizontal for ranked categories, vertical for periods | setBarChartOrientation |
horizontal or vertical |
| Bar | Square bar ends | setBarChartBarRadius |
0 |
| Bar | One measure’s colour | setColoringColor |
--series-1 |
| Bar | Measures in different units side by side | setBarChartLayout |
groups |
| Bar | Sort by value | setSortingDirection |
descending on the measure |
| Line | Straight segments | setLineType |
straight |
| Line | Heavy lines | setMeasureLineSize |
strokeWidth: 3 for the main measure, 2 for the others |
| Line | Fewer value labels, in the series colour | setMeasureDataLabelsShow, setMeasureDataLabelDensity, setMeasureDataLabelIsColored |
true, low, true |
A line split by a second dimension colours by category from the palette:
setCustomPaletteColors with the series
tokens. Colours follow domain order or a hash, not the category value; see
Styling and theming.
Legend, number and table
Section titled “Legend, number and table”| Setting | Operation | Value |
|---|---|---|
| No legend when the subtitle names the series | setLegendEnabled |
false |
| Legend above the plot, otherwise | setLegendPosition, setLegendItemLabelFill |
top, --ink |
| Number figure | setNumberFontFamily, setNumberFontWeight, setNumberFontColor |
Inter, 600, --ink |
| Number comparison | setComparisonFontFamily, setComparisonFontColor |
Inter, --muted |
| Table: the paper as background | setTableBackgroundType, setTableBackgroundColor, setTableHeaderBackgroundColor |
single, --page, --page |
| Table: horizontal dividers only, no outer border | setTableColumnBorders, setTableBorderEnabled |
showHorizontal, false |
| Table: divider colour | setTableColumnBorderColor, setTableHeaderBorderColor |
--line |
| Table: text | setTableAllColumnsFontColor, setTableHeaderFontColor |
--ink, --muted |
| Table: row highlight | setTableHighlightBackgroundColor |
--tint |
| Table: fonts | setTableHeaderFontFamily, setTableBodyFontFamily |
Inter |
Titles, labels and annotation
Section titled “Titles, labels and annotation”- Headline. State the finding: “Bond yields have climbed back to their 2023 high”.
- Subtitle. Measure and unit in
--muted: “10-year government bond yield, %”. - Source. One line at the bottom left in
--muted, starting “Source:”, with a method note after it when needed. - Series names. With the legend off, name each measure in the subtitle in its token colour:
<span style="color: var(--series-2)">Italy</span>.
Contrast
Section titled “Contrast”WCAG ratios from Measure contrast, against the light and dark
--page. Text needs 4.5:1, series 3:1; --line is checked against the 1.4 guide and --tint
against 1.15.
| Token | Light | Ratio on #fff1e5 |
Dark | Ratio on #2b2320 |
|---|---|---|---|---|
--ink |
#33302e |
11.83 | #fff1e5 |
13.90 |
--muted |
#66605c |
5.59 | #c2b6ab |
7.75 |
--line |
#ccc1b7 |
1.60 | #4f4540 |
1.66 |
--tint |
#f2dfce |
1.17 | #3a302c |
1.20 |
--series-1 |
#0f5499 |
6.90 | #6fa8ff |
6.39 |
--series-2 |
#990f3d |
7.62 | #ff7faa |
6.50 |
--series-3 |
#0d7680 |
4.84 | #33c1c9 |
7.05 |
--series-4 |
#b3530c |
4.56 | #ff9b4a |
7.36 |
On a highlighted row, --ink measures 10.12 against the light --tint and 11.57 against the dark;
--muted measures 4.78 and 6.45.
Not available
Section titled “Not available”See App limitations: no chart background, so the salmon cannot be set on the chart itself; no gridline styling; the value axis cannot move; chart text stays in Roboto; bar data labels have no text colour; no annotations in the plot; no colour for a named category value.
Use line-end labels on vertical, unstacked line charts.
Pairs well with
Section titled “Pairs well with”Related
Section titled “Related”- Theming: tokens, dark theme, fonts and chart palettes.
- Visualization operations: every operation per chart type.
- Economist style: the same finding-as-title pattern on a white ground.