

William S. Cleveland
William S. Cleveland’s approach is graphical perception: encode the comparison that matters with the task readers judge most accurately. Books: The Elements of Graphing Data (1985; revised 1994) and Visualizing Data (1993).
Use it where readers must judge values accurately: ranking, small differences, relationships and distributions. For other pages, see Choose an expert.
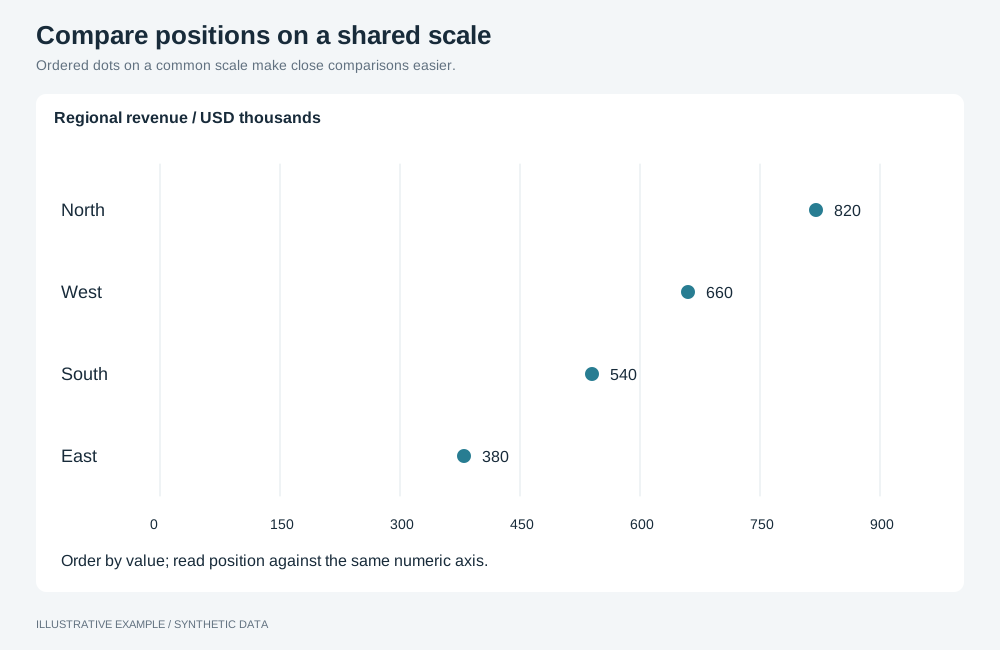
Illustrative example with synthetic data. Ordered dots on a common scale make close comparisons easier.
Encode the comparison as position on a common scale
Section titled “Encode the comparison as position on a common scale”Readers judge these tasks from most to least accurately. Put the main comparison as high as possible.
| Rank | Task | Types that use it |
|---|---|---|
| 1 | Position on a common scale | dot, scatter, line, unstacked bar |
| 2 | Position on identical, non-aligned scales | One chart repeated in a card grid |
| 3 | Length | Stacked bar segments above the first |
| 4 | Angle and slope | pie; the slope of a line |
| 5 | Area | treemap; scatter with a size measure |
| 6 | Colour | heatMap; setColoringType gradient |
- Compare parts with
setBarChartLayoutgroups(bar), so every bar starts on the common baseline. - Keep compared measures on one axis; do not move one with
changeMeasureAxis(bar, line).
Prefer dot plots when zero is not part of the comparison
Section titled “Prefer dot plots when zero is not part of the comparison”A dot marks a value by position only, so its scale need not include zero. dot takes exactly two
dimensions and one measure; see Visualization definitions. Use a bar
when the value is an amount whose zero matters.
| Check | Operation (dot) |
|---|---|
| Category labels read horizontally | setOrientation |
| Dots ordered by value | setSortingEnabled, setSortingDirection |
| One colour when the second dimension need not be told apart | setColoringType single, setColoringColor |
Order categories by value
Section titled “Order categories by value”Sort unordered categories by the measure with setSortingEnabled and setSortingDirection
(bar, dot).
Keep the natural order for months, sizes and other ordered categories; group dates with
setDimensionTemporalGrouping (Charts).
Choose the aspect ratio for slopes
Section titled “Choose the aspect ratio for slopes”The slope of a line on screen depends on the plot’s width-to-height ratio, and slopes near 45 degrees are judged most accurately. Give the chart host an explicit ratio (Keep proportions fixed inside a card) and recheck it at each reflow tier.
Chart choices
Section titled “Chart choices”| Prefer | For |
|---|---|
Sorted dot |
One measure for many categories, split by a second dimension |
Sorted bar |
Amounts whose zero matters |
line |
Change over time |
scatter |
Two measures against each other |
histogram |
Distribution of one numeric field |
| Avoid | Because |
|---|---|
pie |
Angle and area are judged less accurately than position |
Stacked bars and setLineChartType stacked |
Only the bottom series sits on the common baseline |
| A secondary measure axis | Two scales in one plot |
treemap and heatMap for precise comparison |
Area and colour rank lowest |
Pairs with card grid, compare and table-first layouts, and the Economist and explainer styles.
Not available
Section titled “Not available”A one-dimension dot plot, trellis panels, aspect-ratio banking, smoothers and quantile plots are not available; see App limitations. Fixed measure-axis ranges and logarithmic scales are supported by the axis controls.