

KPI card
A KPI card shows one measure as a number, its change against a comparison period, and optionally a trend. It sits in a card, and replaces the card’s title, subtitle and host with a label, value, change and trend row.
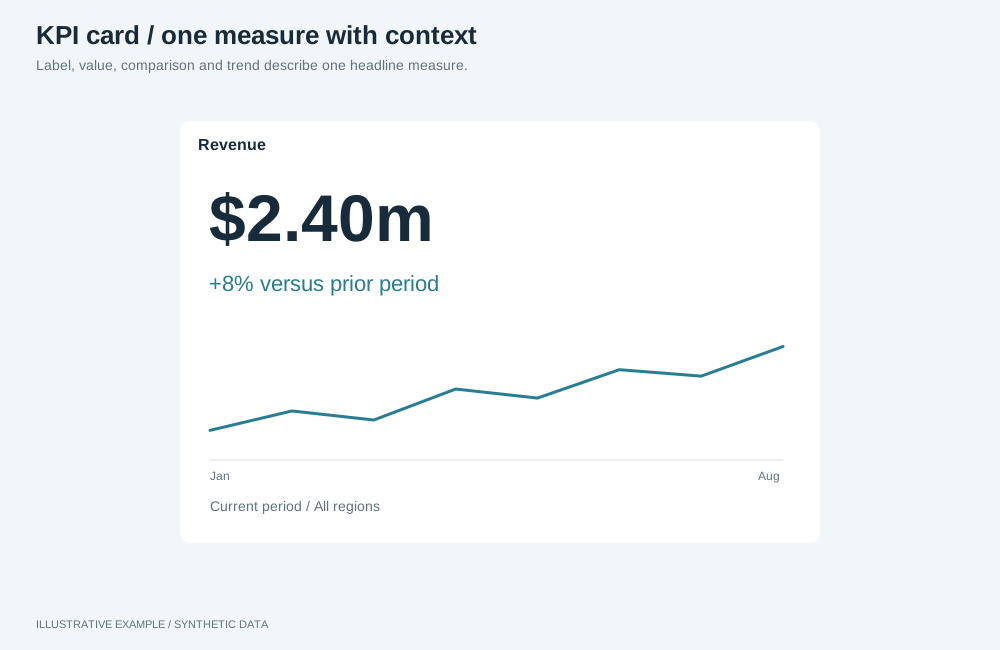
Illustrative example with synthetic data. Label, value, comparison and trend describe one headline measure.
Choose a variant
Section titled “Choose a variant”Use KPI cards for the few headline measures a page opens with. For a value per item with a trend, use a table with sparkline columns; for a breakdown, use a chart.
- Does choosing this measure change what the charts show? Use selectable.
- Do readers need the direction over recent periods? Use value, change and trend.
- Is there a meaningful comparison period? Use value and change.
- Otherwise, use value only.
| Variant | Parts | Use cases | Choose another when |
|---|---|---|---|
| Value only | Label, value | Open tickets now; headcount today | The value means little without a comparison |
| Value and change | Label, value, change | Revenue this month against last month | One comparison hides a trend |
| Value, change and trend | Label, value, change, 12-period trend | Monthly revenue with its last 12 months | The card is under 246px wide; it drops the trend |
| Selectable | Any of the above, as a toggle button | KPIs beside a chart that shows the pressed one | Readers need several measures at once |
Use one variant per row, so every card has the same rows.
Take the change from the semantic layer, like every other figure on the page: a stored change measure, such as a growth measure on a period axis, or a stored period-comparison question; see Period change on a KPI card. Do not compute it in the app from two query results; see Show only governed figures.
If the layer has neither, ask the layer owner to add one; the app can query it once the layer is published. Until then, show the comparison period’s value beside the current value, for example “LY £1.1m”, instead of a change.
Show a change only when it means something
Section titled “Show a change only when it means something”A change needs a complete prior period. Check these in every state the page can be in, including the one it opens on with nothing selected:
- Both sides cover the same length of time.
- The prior side lies wholly inside the data. A window that reaches back past the first date in the data compares a whole period with part of one, and the change looks far larger than it is.
- The current side is the figure the change sits beside. A change on a 12-month axis does not describe a total across every date.
Where a state fails any of these, leave the slot empty or say why, for example “No earlier year to compare with”. An empty change from a query means there is no comparison, so do not show it as 0%, which says nothing changed. Name the two periods from live values, such as “1–14 May 2024 against 1–14 May 2023”: a fixed label such as “same selected dates last year” is false when nothing is selected. What a comparison is about explains how these states arise, and Check what the page says how to test them. Keep the calculation in the semantic layer: the app decides whether to show a change, never what it is.
Rendering and surrounding UI
Section titled “Rendering and surrounding UI”Simple KPI cards may use the native number object or ordinary app UI. Choose the approach that fits the required value, comparison and interaction presentation; this choice needs no renderer exception. Neither approach is prescribed for every scalar KPI.
A plotted trend or sparkline is a chart, even inside a KPI card. Use an Astrato visualization for that portion; Choose a chart guides its selection and mounting support. Chart rendering policy applies if a different chart solution is needed. Icons, decorative SVG and ordinary card styling remain app presentation.
Keep trends honest
Section titled “Keep trends honest”Give a card a trend when the direction over recent periods changes how its number is read. For a list of items, prefer a sparkline column in a table to a separate chart per item.
- Draw every trend in a set over the same period, grain and date field, and state the window once.
- Show no axes, gridlines or labels. Keep the value and its change as text beside the trend.
- Use one scale rule across the set, and say whether the marks share a scale.
- Use the accent colour for a neutral trend. Keep good and bad colours for a stated direction.
- With too few periods or gaps in the data, show no trend and say so where a reader would look.
- Let the trend load, refresh and follow filters with its figure.
Markup
Section titled “Markup”This example illustrates the app UI approach with synthetic figures. When using this approach, bind the value and change to live results.
<article class="kpi" data-object-id="kpi-revenue"> <h3 class="kpi-label">Revenue</h3> <p class="kpi-value">$1.24M</p> <p class="kpi-delta" data-direction="up"> <span class="kpi-change"><span aria-hidden="true">▲</span> +4.1%</span> <span class="kpi-compare">vs last year</span> </p> <!-- Optional trend variant: mount an Astrato chart in a .kpi-trend host. --></article>- The sign in the text carries the direction; the arrow is
aria-hiddenand colour repeats it. See Deltas and indicators. data-directionisup,down,flat(“No change”, no arrow) ornone(“No comparison”).- For a plotted trend, give the chart host the
kpi-trendclass and follow Mounting objects. Derive any trend annotation from live results. - Selectable: make the card a
<button class="kpi" aria-pressed="false">with<span>parts, in arole="group"named for what it controls. Behaviour is in Metric switcher.
The card reads the card tokens, --muted, --delta-up,
--delta-down and --accent from the style.
:root {  /* 1 + 12 + 18 + 34 + 18 + 12 + 1 = 96: border, padding, label, value, change, padding, border */  --kpi-pad: 12px;  --kpi-label-h: 18px;  --kpi-value-h: 34px;  --kpi-delta-h: 18px;}
.kpi {  display: grid;  grid-template-columns: minmax(0, 1fr) minmax(0, 40%);  grid-template-rows: var(--kpi-label-h) var(--kpi-value-h) var(--kpi-delta-h);  column-gap: 12px;  align-content: start;  min-width: 0;  min-height: 0;  margin: 0;  padding: var(--kpi-pad);  box-sizing: border-box;  background: var(--surface);  border: var(--panel-border);  border-radius: var(--radius);  box-shadow: var(--panel-shadow);  /* Resets for the button variant */  color: inherit;  font: inherit;  text-align: start;  container-type: inline-size;}.kpi-label,.kpi-value,.kpi-delta {  display: block;  grid-column: 1;  margin: 0;  overflow: hidden;  white-space: nowrap;  text-overflow: ellipsis;}.kpi-label {  grid-column: 1 / -1;  line-height: var(--kpi-label-h);  color: var(--muted);}.kpi-value {  line-height: var(--kpi-value-h);  font-size: clamp(20px, 11cqi, 30px);  font-variant-numeric: tabular-nums;}.kpi-delta {  line-height: var(--kpi-delta-h);  font-variant-numeric: tabular-nums;}.kpi-delta[data-direction='up'] .kpi-change {  color: var(--delta-up);}.kpi-delta[data-direction='down'] .kpi-change {  color: var(--delta-down);}.kpi-compare {  color: var(--muted);}
.kpi-trend {  grid-area: 2 / 2 / 4 / 3;  width: 100%;  height: 100%;}/* Without a trend, the figures take the full width. */.kpi:not(:has(.kpi-trend)) > * {  grid-column: 1 / -1;}/* The query measures the content box: a card under 220 + 2 × 12 + 2 = 246px drops the trend. */@container (width < 220px) {  .kpi-trend {    display: none;  }  .kpi > * {    grid-column: 1 / -1;  }}
button.kpi[aria-pressed='true'] { box-shadow: inset 0 0 0 2px var(--accent);}button.kpi:focus-visible { outline: 2px solid var(--accent); outline-offset: 2px;}- Fixed rows keep every card the same height, including while loading or failed. Show “—” as the value and the state in the change row; see Object states.
- The sum assumes a 1px
--panel-border. With--panel-border: 0, add 1px to--kpi-pad. - Keep the change text short, such as “vs LY”, because it truncates first.
Mount a number object
Section titled “Mount a number object”The number visualization draws a value and one comparison
value. Its definition takes one measure; add the comparison with addMeasure and the
number-comparison role. Set the main-number size intentionally: this example uses a 30px
maximum, with the comparison at 40% of that size. The number can shrink to fit its host;
inspect the result at your target widths.
import { createDefaultVSpec, type createVisualizationRuntime } from '@astrato-io/visualizations';import { compileVisualizationDefinition } from '@astrato-io/visualizations/definitions';import { applyRuntimeOperations } from '@astrato-io/visualizations/operations';
declare const runtime: ReturnType<typeof createVisualizationRuntime>;declare const availableFields: Parameters<typeof compileVisualizationDefinition>[0]['availableFields'];declare const dataBinding: Parameters<typeof runtime.createInstance>[0]['dataBinding'];declare const host: HTMLElement; // a visible host with a non-zero width and height// availableFields entries, looked up by name. `revenueChange` is a stored change measure.declare const revenue: { fieldKey: string };declare const revenueChange: { fieldKey: string; kind: 'measure' | 'calculation' };
const isRecord = (value: unknown): value is Record<string, unknown> =>  typeof value === 'object' && value !== null && !Array.isArray(value);
async function mountRevenueKpi(): Promise<void> {  const compilation = await compileVisualizationDefinition({    definition: { version: 1, type: 'number', data: { measure: { ref: 'revenue', fieldKey: revenue.fieldKey } } },    availableFields,    baseVSpec: createDefaultVSpec('number'),  });  if (!compilation.success) throw new Error(JSON.stringify(compilation.issues, null, 2));
  runtime.createInstance({    id: 'kpi-revenue',    type: 'number',    groupId: 'dashboard',    vSpec: compilation.vSpec,    dataBinding: { ...dataBinding, queryContext: { objectId: 'kpi-revenue' } },  });
  const applied = await applyRuntimeOperations({    runtime,    instanceId: 'kpi-revenue',    availableFields,    operationRequests: [      // sourceKind is the entry's kind: a stored measure is listed as 'measure' or 'calculation'.      {        id: 'comparison',        name: 'addMeasure',        payload: { sourceKind: revenueChange.kind, key: revenueChange.fieldKey, role: 'number-comparison' },      },      { id: 'number-size', name: 'setNumberFontSize', payload: 30 }, // pixels      { id: 'position', name: 'setComparisonPosition', payload: 'bottom' },      { id: 'comparison-size', name: 'setComparisonRelativeFontSizePercentage', payload: 40 },    ],  });  if (!isRecord(applied.results)) throw new Error('Unexpected KPI operation results');  const refused = Object.values(applied.results).filter((result) => !isRecord(result) || result.success !== true);  if (refused.length > 0) console.error('[kpi-revenue] mounted without some settings', JSON.stringify(refused));
  await runtime.mount(host, 'kpi-revenue');}
addMeasure takes the stored item’s own kind as sourceKind. A stored measure is listed in
availableFields as measure or calculation, whatever the layer calls it, and the operation
refuses the other value with “Selected item … is a calculation, not a measure” or the reverse. Pass
the entry’s kind rather than a fixed value.
In @astrato-io/visualizations 0.6.5 a number object draws an empty value as 0, in its format, so
a missing comparison reads as 0%. For a change that can be empty, draw your own card,
which shows “No comparison”.
dataBinding and the instance id are as in Instance identity.
Place the label in the card’s HTML above the host. Apply these operations after creating the
instance and before mounting. Without a stored change measure, use the comparison period’s stored
value as the comparison. Let errors thrown by mountRevenueKpi reach your
object error state. A refused result costs only its own setting, so
log it and keep the figure; a resolved batch alone does not confirm success. See
Check operation results and
first-render readiness.
For chart portions, inspect current definition and operation references before declaring a feature unsupported; historical App limitations do not verify a current gap.
Draw your own card
Section titled “Draw your own card”If ordinary app UI fits the KPI presentation, the following example supplies its current and comparison values in one query. It is an available approach, not the default for every KPI. A plotted trend is a separate Astrato chart; keep its mounting and data binding on the supported path.
The example queries each KPI’s stored value and stored change measure in one query. Without a change measure, query the comparison period’s value instead and show it as text, as described at the top of this page. When the layer has only the plain measure, send it twice, once with each period’s range as a date filter, in two queries; see Periods and date ranges. A layer that holds one date, a snapshot, has no comparison: show the value alone.
import type { AstratoAppRuntime } from '@astrato-io/app-runtime';
declare const app: AstratoAppRuntime; // from createAstratoApp()// changeKey: a stored change measure, such as a growth measure on a period axis.declare const kpis: readonly { id: string; currentKey: string; changeKey: string }[];// The applied VALUE selections as query filters.declare function totalsFilters(applied: readonly unknown[]): unknown[];declare function render(id: string, current: unknown, change: unknown): void;declare function markFailed(error: unknown): void;
const rowsOf = (result: unknown): unknown[][] => {  const data = (result as { response?: { data?: unknown } } | null)?.response?.data;  if (typeof data !== 'object' || data === null) return [];  return Object.values(data).filter(Array.isArray);};
let latest = 0;
const refreshKpis = async (applied: readonly unknown[]) => { const request = ++latest; const { semanticLayerId } = app.dataBinding; try { const totals = await app.client.services.engine.getData({ semanticLayerId, query: { dimensions: [], calculations: kpis.flatMap((kpi) => [{ itemKey: kpi.currentKey }, { itemKey: kpi.changeKey }]), filters: totalsFilters(applied), }, }); if (request !== latest) return; // superseded by a later change const totalsRow = rowsOf(totals)[0] ?? []; kpis.forEach((kpi, index) => { render(kpi.id, totalsRow[2 * index], totalsRow[2 * index + 1]); }); } catch (error) { if (request === latest) markFailed(error); }};- Call
refreshKpisas in Re-query your own objects only on applied changes, and buildtotalsFiltersfrom that section’stoQueryFilter. - Columns come back in the order requested; validate them as in Reading the answer.
- When the change measure takes date parameters, send them with the query; see Period picker.
- Give each card
data-object-id, so the object menu serves it.
Format the stored change with one formatter in the app’s locale. A growth change is a ratio,
where 0.176 is +17.6%; see Period axes and comparisons.
const LOCALE = 'en-GB'; // the app's one localeconst percent = new Intl.NumberFormat(LOCALE, {  style: 'percent',  minimumFractionDigits: 1,  maximumFractionDigits: 1,  signDisplay: 'exceptZero',});
type Direction = 'up' | 'down' | 'flat' | 'none';
const describeChange = (change: number | null | undefined): { direction: Direction; text: string } => {  // An empty change means the query found nothing to compare with, not that nothing changed.  if (change === undefined || change === null || !Number.isFinite(change)) {    return { direction: 'none', text: 'No comparison' };  }  // Flat when the change rounds to 0.0%, so the arrow agrees with the text.  if (Math.round(change * 1000) === 0) return { direction: 'flat', text: 'No change' };  return { direction: change > 0 ? 'up' : 'down', text: percent.format(change) };};
A percentage of a zero or negative base is not meaningful. For a measure whose comparison value can
be zero or negative, and for rates, store a diff change instead and show it as a difference.