

What the Map View canvas is for
The Semantic Model → Map View tab is the picture of your model: each table you have brought in, drawn as a box of its fields, with a line for every join between them. The editor opens on it because it answers the first question about a model you did not build — what is in here, and what is joined to what.
It is also where the structural work happens: tables arrive here, joins are drawn here, and a measure or dimension can be started from the field it reads.
What you are looking at
Section titled “What you are looking at”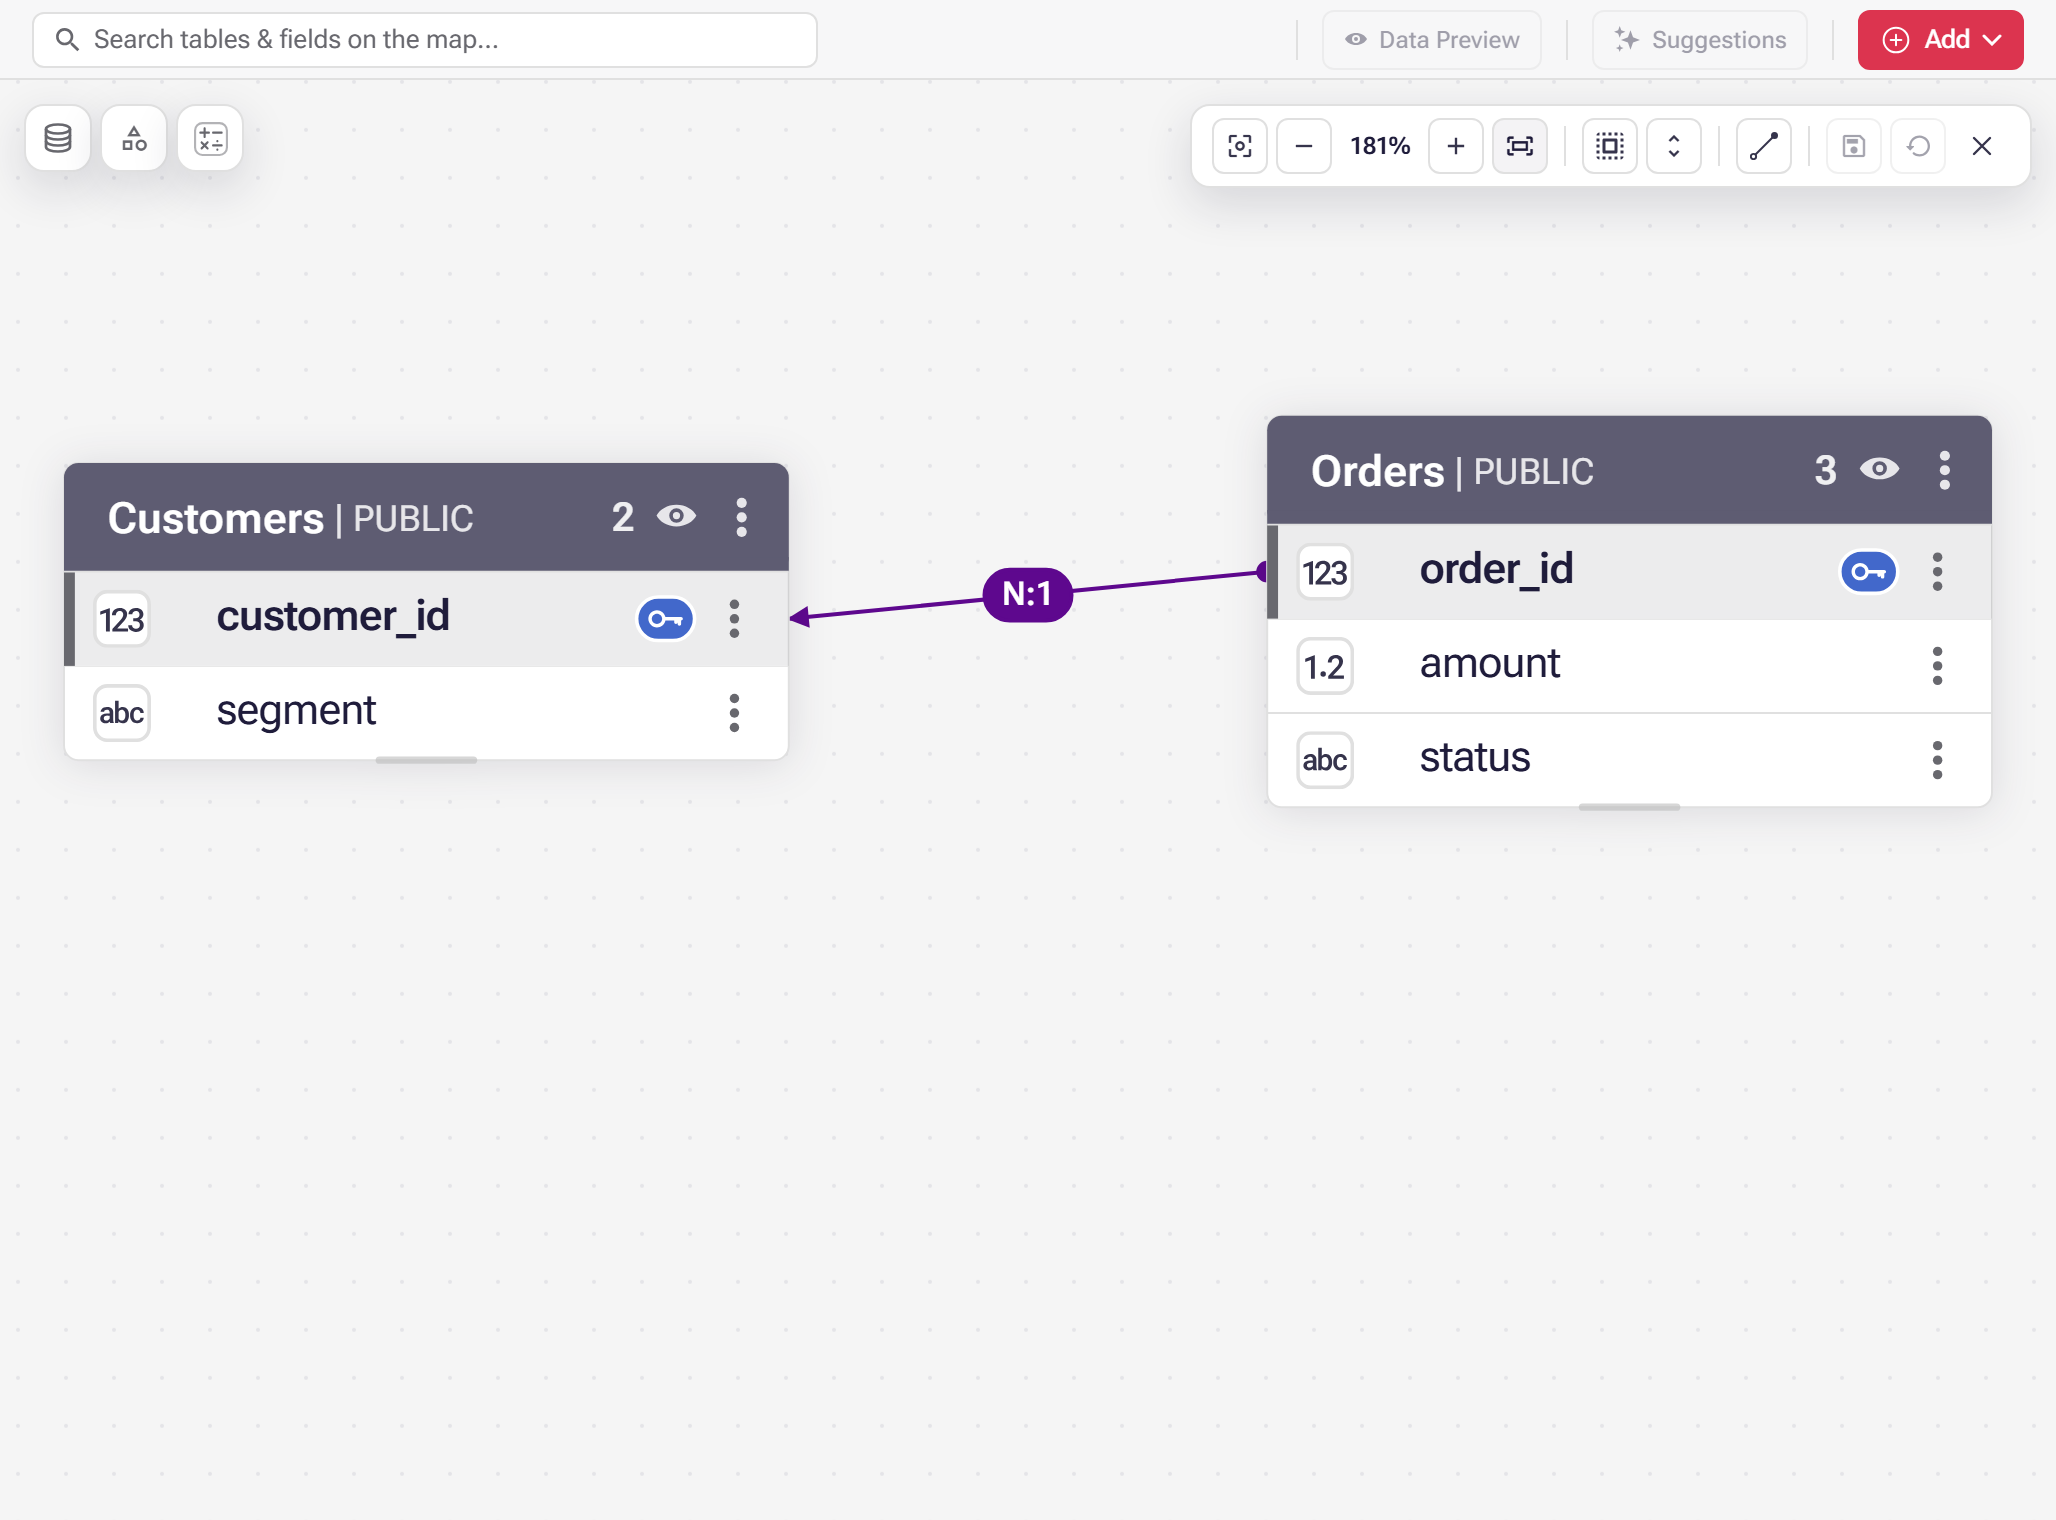
Map View draws each table as a box of its fields, with a line for every join between them, labelled with its cardinality. The three buttons at the top left open the database browser, the dimensions and the measures.
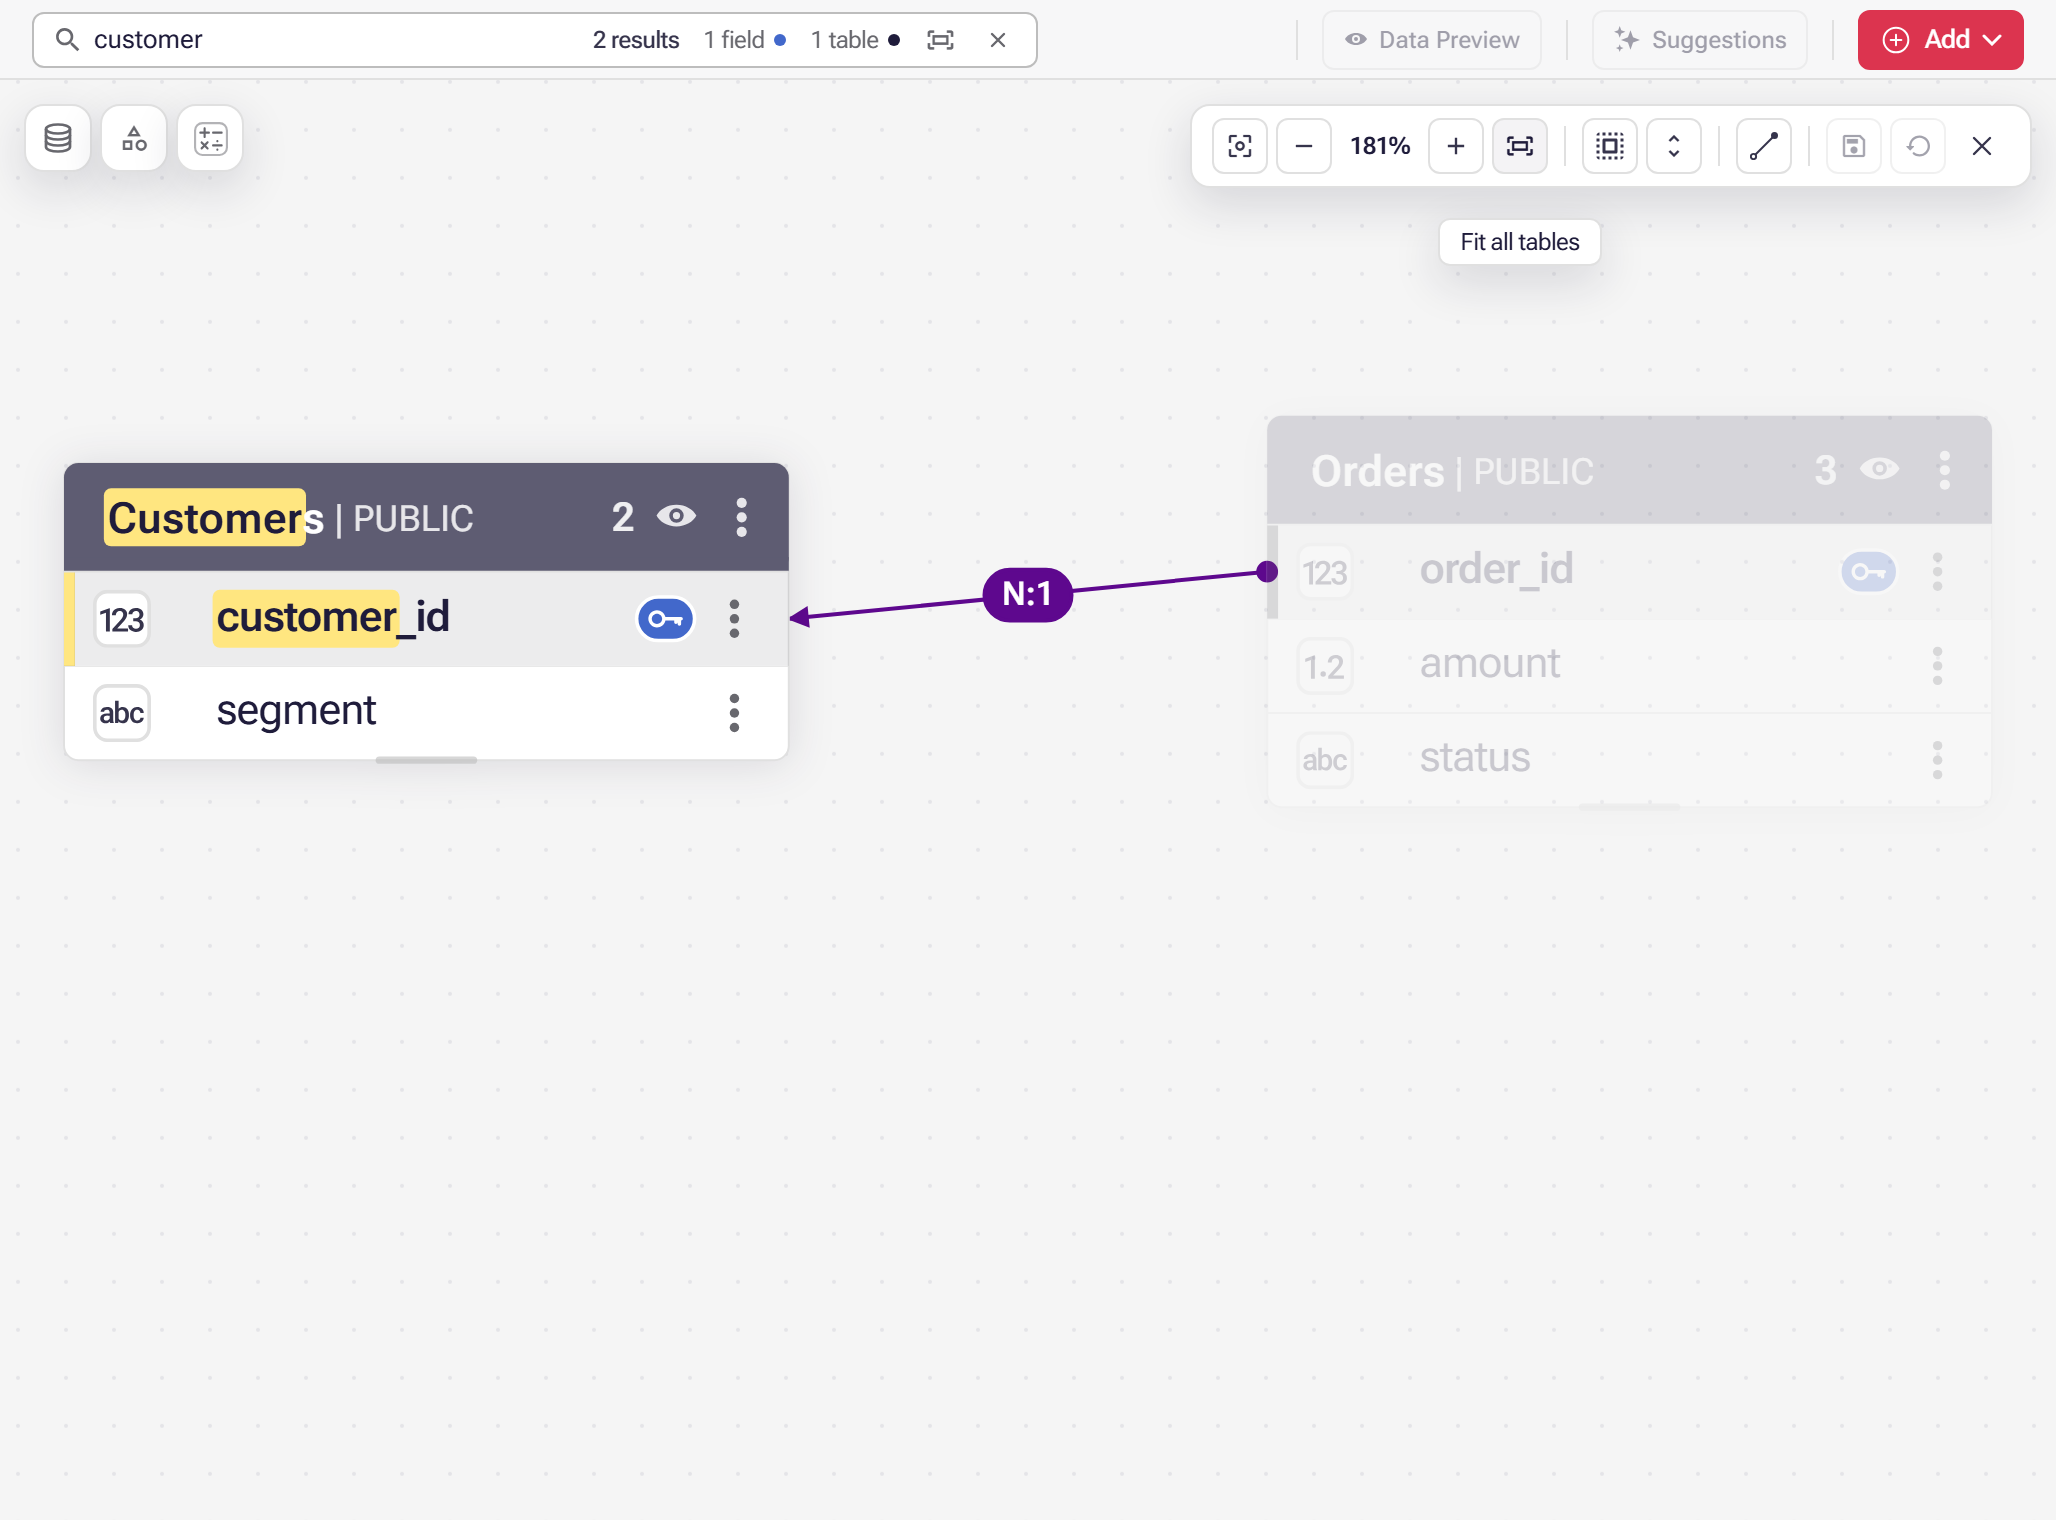
Searching dims everything that does not match and counts the fields and tables that do; Fit matching tables, or Enter, brings them into view.
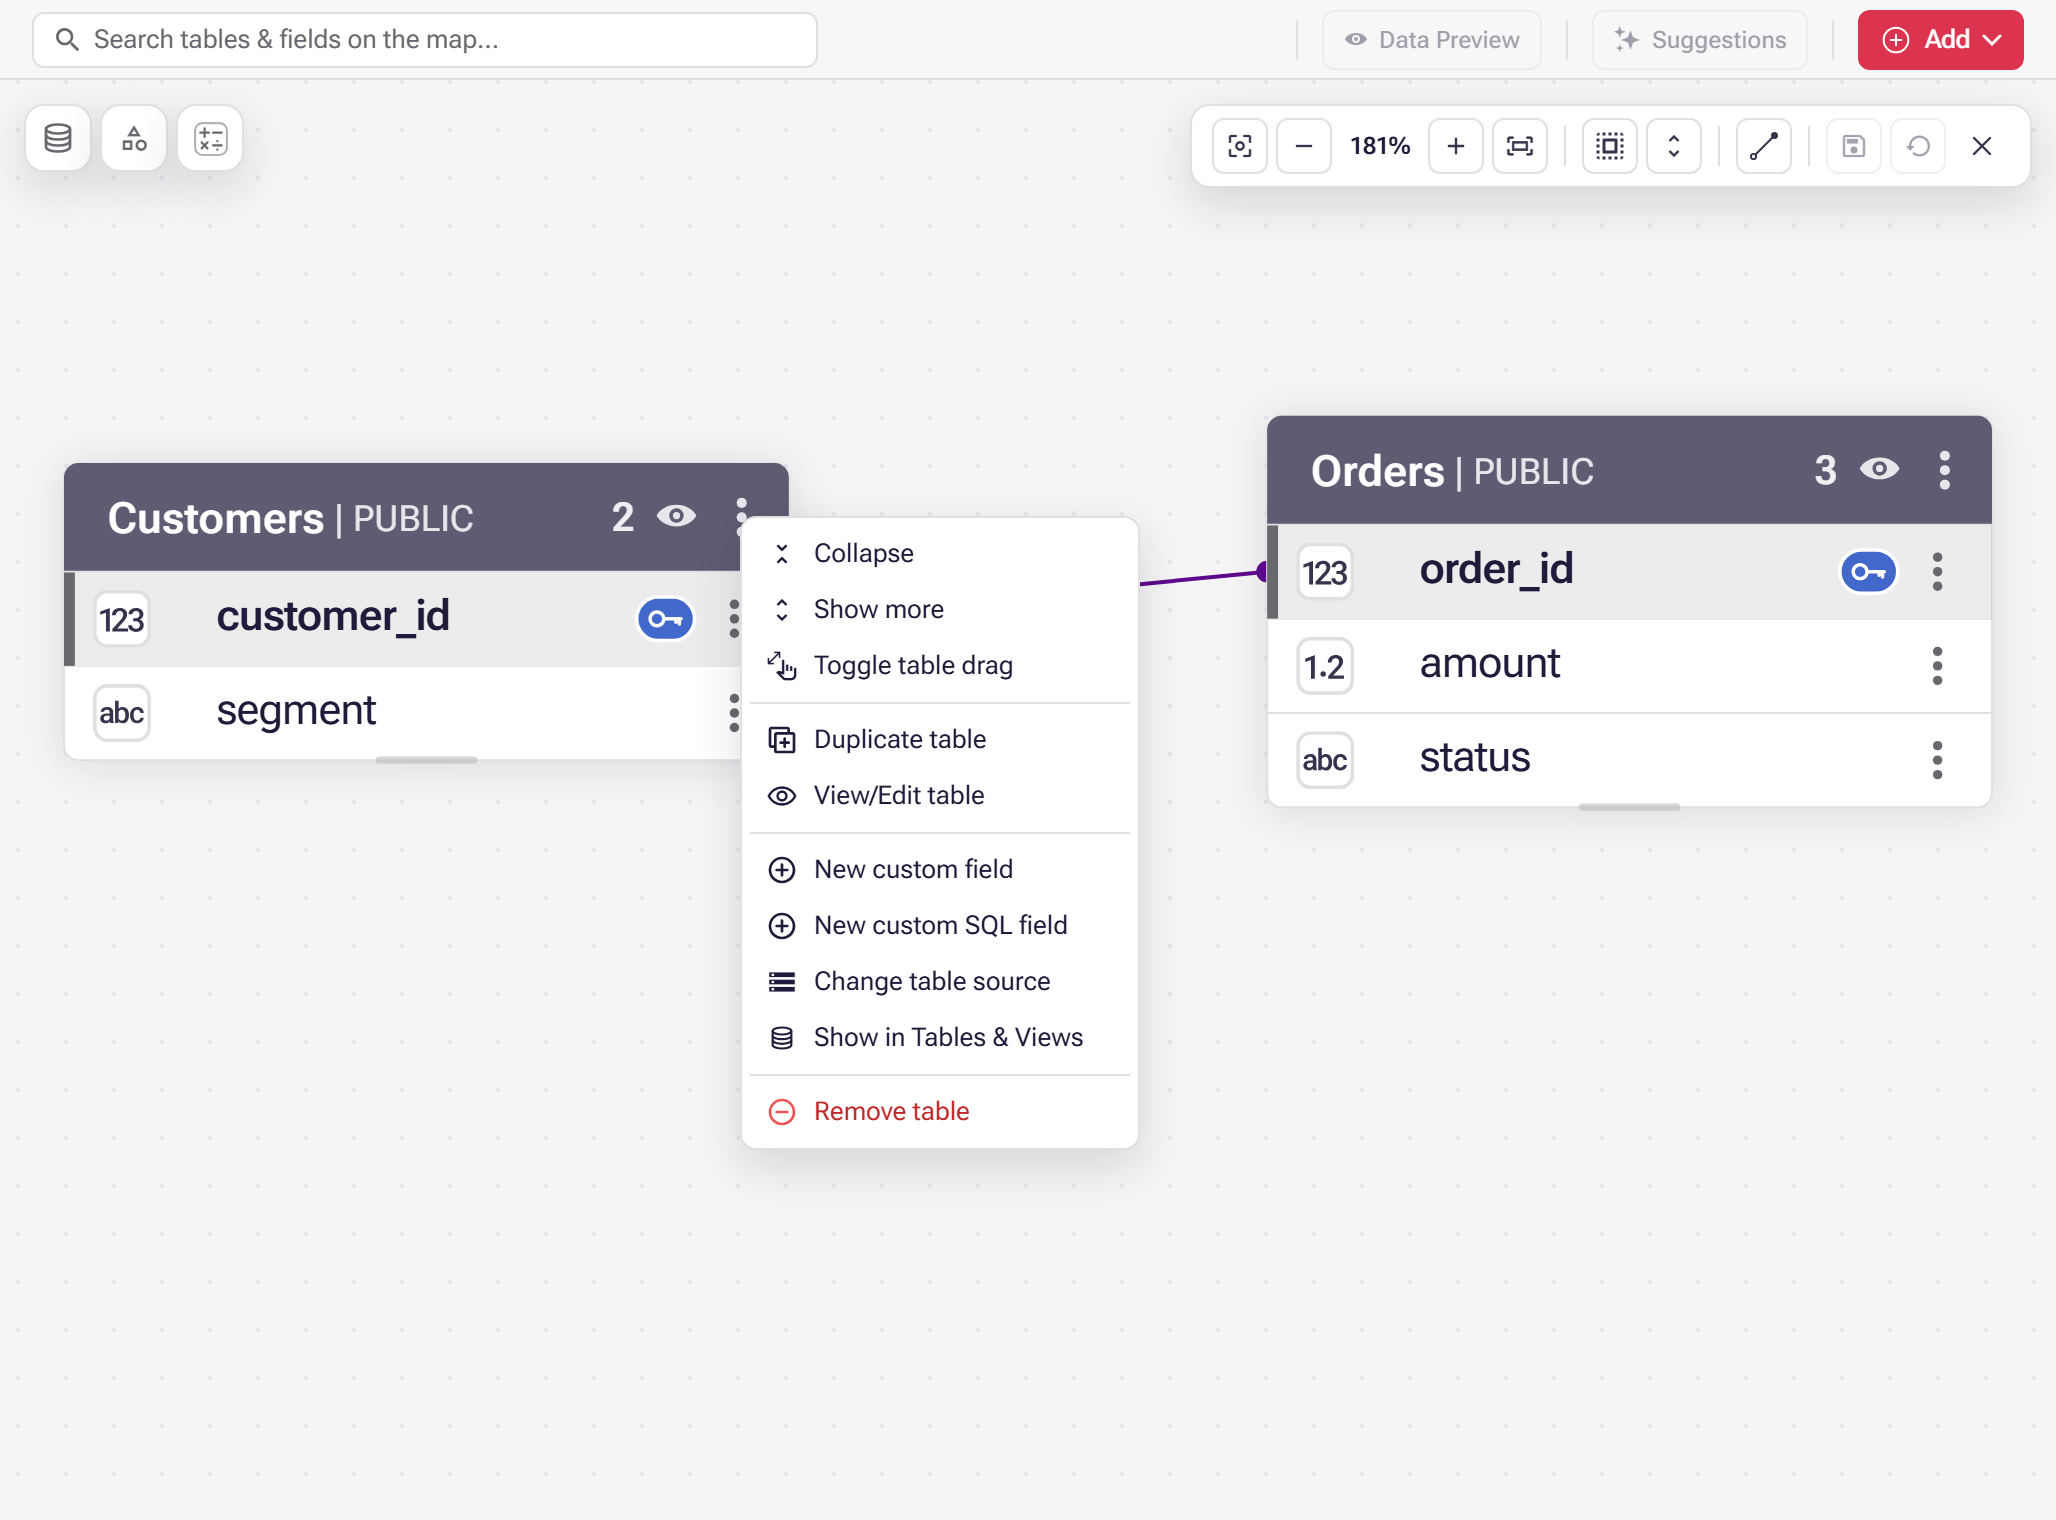
Table actions on a box header opens the rest of what you can do to that table, from how much of it is drawn to changing its source or removing it.
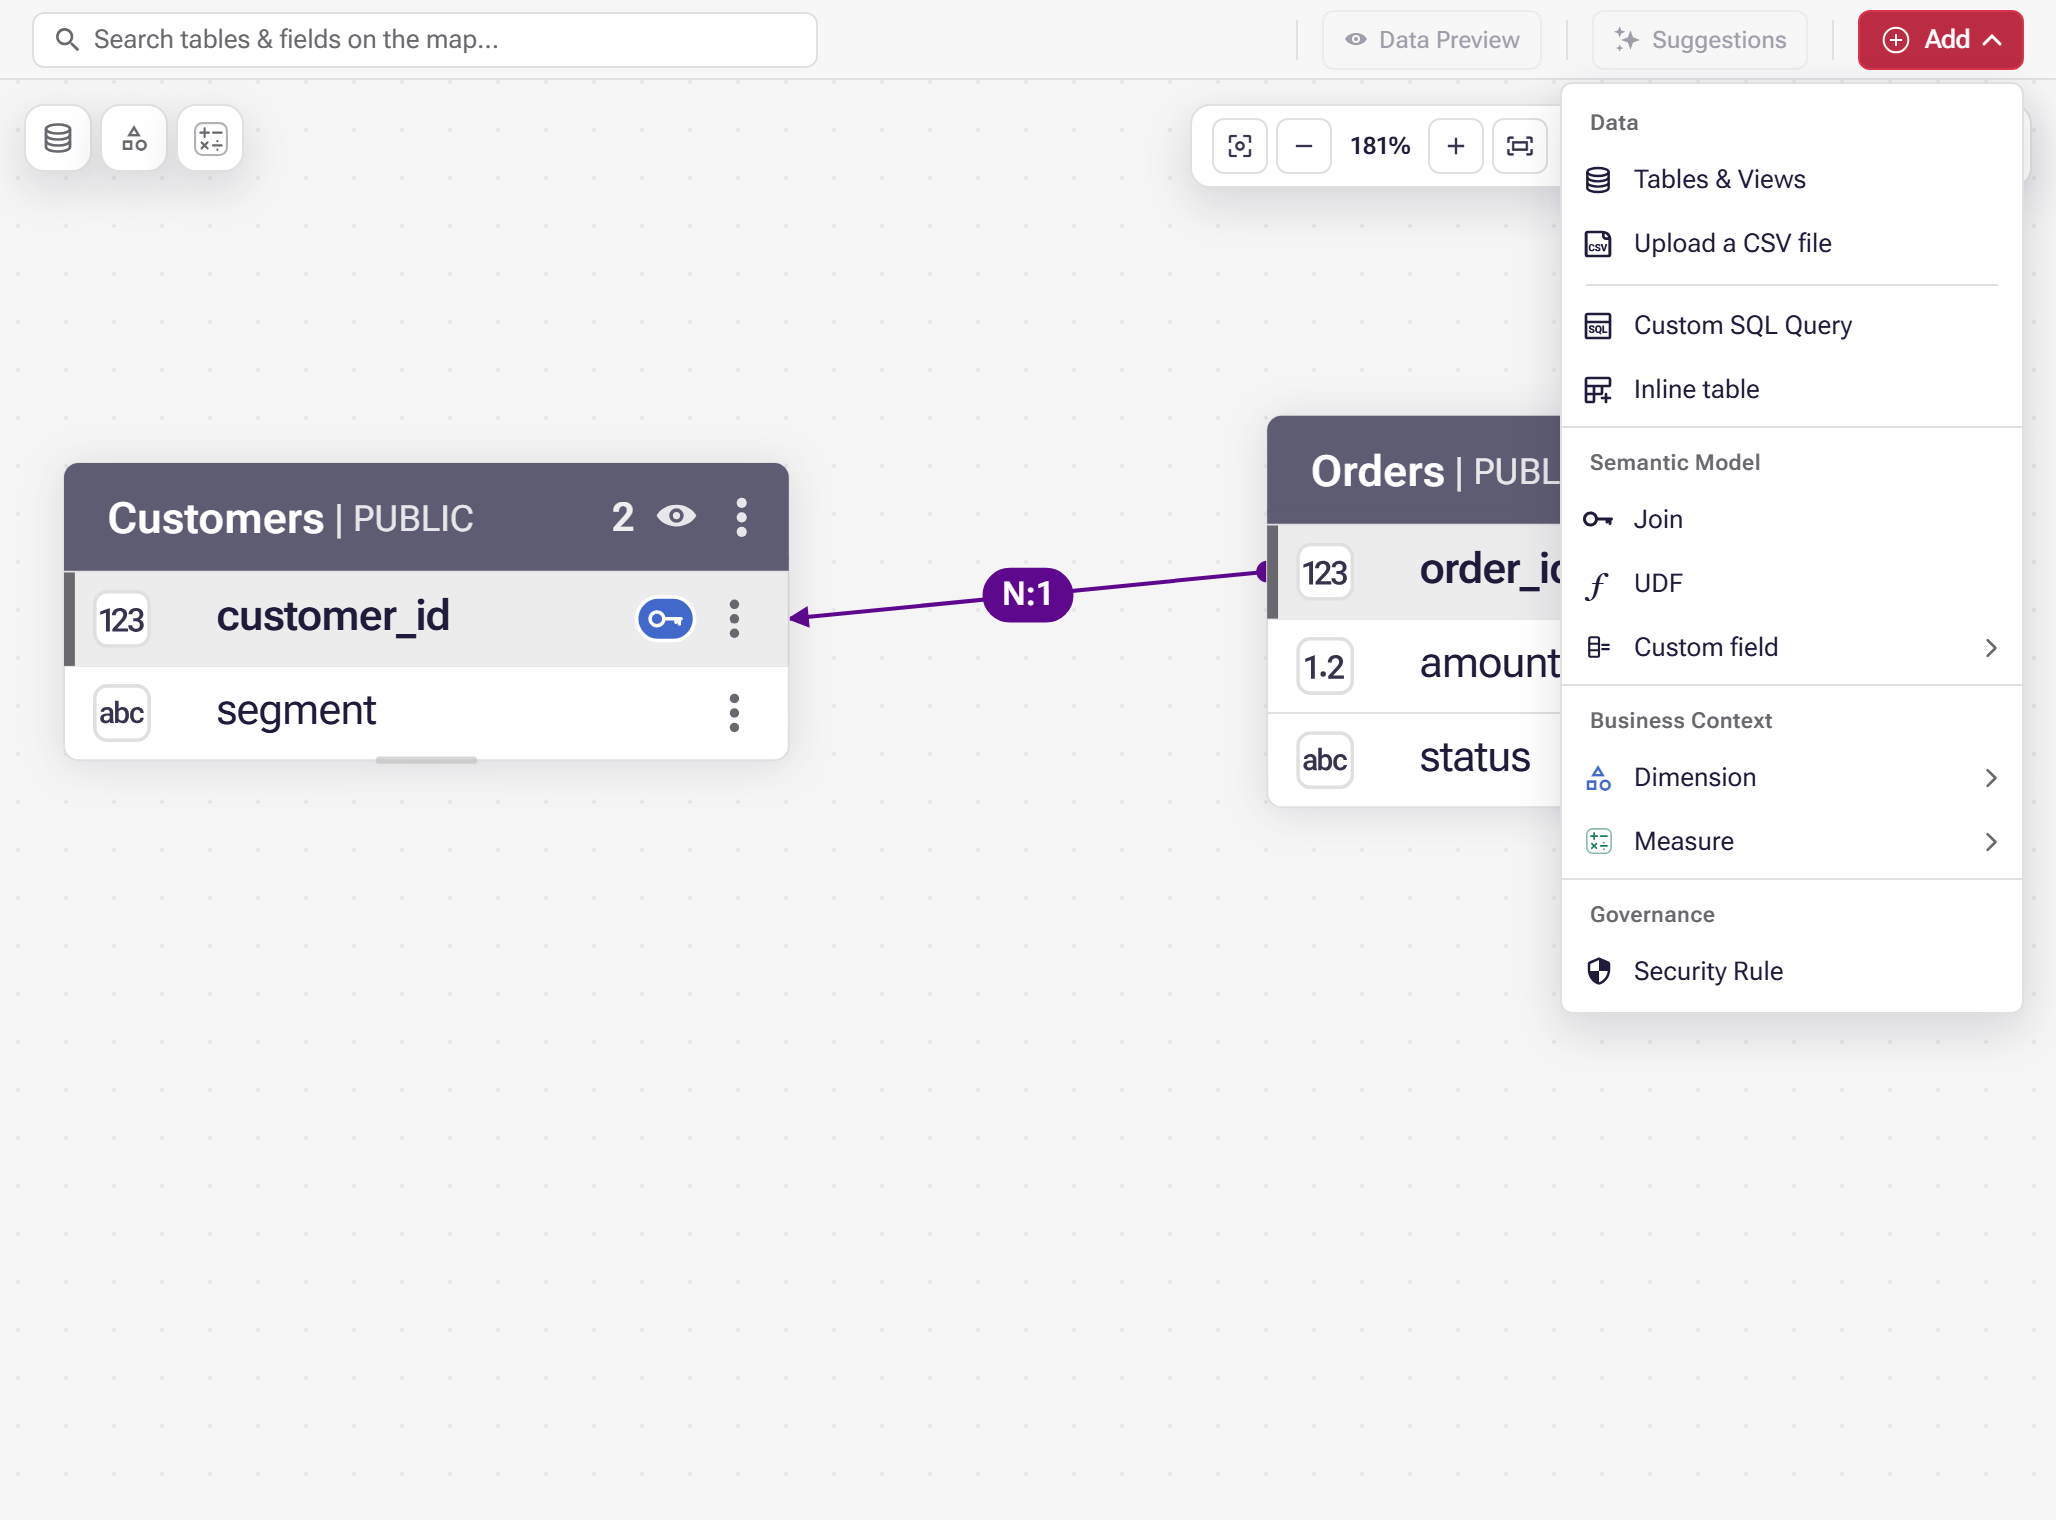
Add is the one way into everything the model can hold, in four sections: data to bring in, the semantic model, business context, and governance.
A table box carries the table’s name and its fields, with key fields marked and small badges showing where a field is already used — as a dimension, in a measure, in a pre-filter, or under a security rule. Select a badge to open the thing that uses the field. Select a table to open its details, select a join line to open the join, and select empty canvas to clear the selection.
A layer with nothing in it yet says No tables yet and offers Add data, which opens the same database list.
Bring tables and model items in
Section titled “Bring tables and model items in”Add opens one menu for everything that can go into the model, in four sections.
- Data — Tables & Views opens the database browser, Upload a CSV file turns a file into a table, and Custom SQL Query and Inline table are the two kinds of data kept in the model itself rather than read from your warehouse.
- Semantic Model — Join, UDF, and Custom field, which first asks which table the field belongs to.
- Business Context — Dimension and Measure, each opening a list of the kinds you can create.
- Governance — Security Rule.
The menu only offers what your connection supports. Custom field is left out where the data source cannot carry one, so a shorter menu is not a broken one. Whichever editor opens, it submits with Create.
Security Rule is the odd one out: it opens no editor. It shows Security rules are set on each table, because a rule is a condition on a table’s pre-filter rather than an object of its own — see Restrict rows with a security rule.
Three buttons float over the canvas. Browse tables & views opens the database list; the two beside it browse the dimensions and measures already in the layer, each with a count.
Draw a join
Section titled “Draw a join”Drag from a field in one table and drop it on a field in another. The canvas hints as you drag, and if the drop is refused it says why rather than quietly doing nothing. Dragging a whole table onto another asks for join suggestions between the two instead.
Suggestions reads your model and proposes measures, dimensions and joins; Get suggestions from your data covers what it offers.
Find something on a large map
Section titled “Find something on a large map”The search box above the canvas matches tables and fields, dims everything that does not match, and counts what it found. Fit matching tables, or Enter, brings the matches into view.
When part of the model is off screen, a minimap appears over the canvas; drag inside it to move your viewport.
Arrange the map
Section titled “Arrange the map”The toolbar above the canvas holds how the map is drawn. Reading left to right: Reset zoom to 100%, Zoom out, the zoom percentage — which you can select and type an exact value into — Zoom in, Fit all tables, and then Auto-layout (star schema), which rearranges every table into a star around its facts.
The toolbar starts open. Close at its right puts it away, and Layout settings brings it back; whichever you chose is remembered for that semantic layer. The minimap carries its own Fit all and zoom buttons only while the toolbar is closed, so the two never offer the same control twice.

The display mode applies to every table at once — Expand all, Collapse all or Keys only — and Join line style draws the lines as Straight, Curved, Elbow or Step.
Moving a table is a change to the model. Positions are stored in the layer, so your arrangement is part of the draft and reaches everyone else when you publish. Save current layout saves a version you can come back to, and Reset layout to previous saved state puts every table back where it was when you opened the layer or last saved a layout — which is also the way back from an Auto-layout (star schema) you did not want.
Look at the rows
Section titled “Look at the rows”Data Preview opens a panel of sample rows along the bottom. Select a table on the canvas, or the Preview data button on its header, to fill it.
Data Preview reads the published model, not your draft. While your draft holds changes that have not been published, the panel says Publish to preview and offers Publish and preview. Like Suggestions, it is available only for a connected Astrato semantic layer.
What a table’s menu offers
Section titled “What a table’s menu offers”Table actions on a table’s header opens the rest of what you can do to it: Collapse, Show more and Show all fields for how much of the table is drawn; Toggle table drag, which pins it where it is and then reads Unlock table drag; Duplicate table, View/Edit table and Show in lineage; New custom field and New custom SQL field; Change table source; Show in Tables & Views, which opens the database list at that table; and Remove table.
A field has the same idea in Field actions, or on right-click: Add dimension, Add measure, Show in lineage and Remove field. Show in lineage appears only where that table or field is in the lineage graph.
Next: Working in the Semantic Layer Editor, for how your edits are saved and how they reach your workbooks.