

KPI-led layout
A KPI-led page shows headline numbers first and the charts that explain them second. Reflow rules, grid traps and the shared tokens are in Layout and responsiveness.
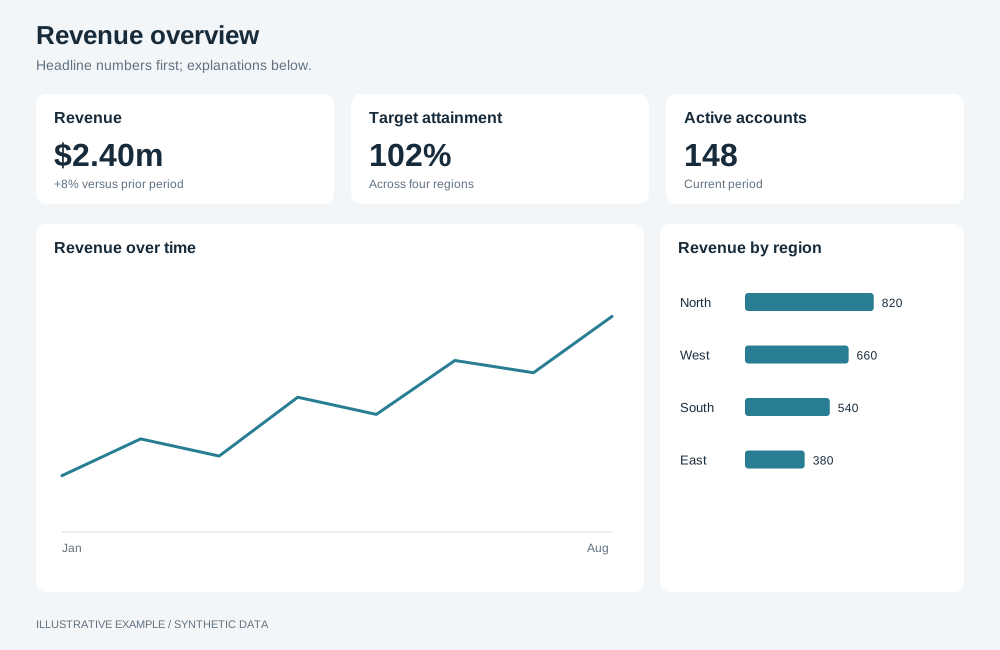
Illustrative example with synthetic data. Headline numbers first; explanations below.
When to use a KPI-led layout
Section titled “When to use a KPI-led layout”Use it when readers first ask how the numbers stand, then why: executive summaries, periodic reviews and operational overviews.
| The page is mainly | Use instead |
|---|---|
| One item at a time, picked from a list | Master–detail |
| Many identical metric or item cards | Card grid |
| Rows of records to read, sort or export | Table-first |
| Places | Map-led |
| An argument read top to bottom | Long-form |
| Live status on a wall display | Ops wall |
Choose a variant
Section titled “Choose a variant”- Does each KPI have charts that explain only that KPI? Use subject columns.
- Does selecting a KPI change what the rest of the page shows? Use column.
- Does one chart answer the main question? Use hero.
- Otherwise, use grid.
| Variant | Layout | Use cases | Choose another variant when |
|---|---|---|---|
| Grid | KPIs in a row, then rows of equal charts | Sales overview: revenue, orders, margin and customers over trend, region and category | One chart matters more than the rest; more than about six charts |
| Hero | KPIs, then one large chart with smaller charts beside it | Revenue against target over time, with top regions and products beside it | The primary chart needs the full width |
| Column | KPIs stacked on the left, detail on the right | Call centre: selecting calls, wait time or abandonment shows it by team and hour | Readers need every KPI’s detail at once |
| Subject columns | One column per subject, KPI on top, its charts below | HR: headcount, salary, satisfaction and performance, each with its own breakdowns | Charts combine subjects; more than four or five subjects |
Shared structure
Section titled “Shared structure”- Use 3, 4 or 6 KPIs: four fold 4 → 2 and six fold 6 → 3 → 2 in complete rows.
- Order the KPIs in the same order as the charts they introduce.
- The KPI row takes its content height; the chart rows share the rest.
- Size overview detail through the shared defaults.
- Give
.boardthe fixed height from Bands above the board, which subtracts--above-board. Each variant setsheight: autobelow its scrolling threshold.
.board { display: grid; gap: var(--gap);}.band { display: grid; gap: var(--gap); min-height: 0;}.band--kpis { grid-template-columns: repeat(4, minmax(0, 1fr));}@media (width < 1280px) { .band--kpis { grid-template-columns: repeat(2, minmax(0, 1fr)); }}┌──────┬──────┬──────┬──────┐│ KPI │ KPI │ KPI │ KPI │├──────┴──────┼──────┴──────┤│ Chart A │ Chart B │├─────────┬───┴─────┬───────┤│ Chart C │ Chart D │Chart E│└─────────┴─────────┴───────┘.board--grid { grid-template-rows: auto minmax(0, 1fr) minmax(0, 1fr);}.band--two { grid-template-columns: repeat(2, minmax(0, 1fr));}.band--three { grid-template-columns: repeat(3, minmax(0, 1fr));}
/* 64 + 2 × 16 + 96 + 2 × 16 + 2 × 252 = 728 */@media (width < 1280px), (height < 728px) { .board--grid { height: auto; grid-template-rows: none; } .board--grid .band:not(.band--kpis) { grid-auto-rows: minmax(var(--chart-min), auto); }}@media (width < 1280px) { .band--three { grid-template-columns: repeat(2, minmax(0, 1fr)); } /* Three charts in two columns: the first spans the row, so no row is incomplete. */ .band--three > :first-child { grid-column: 1 / -1; }}@media (width < 700px) { .band--two, .band--three { grid-template-columns: minmax(0, 1fr); }}| Width | KPIs | Charts | Height |
|---|---|---|---|
| 1280px and wider | 4 across | 2, then 3 across | Fits the window from 728px tall |
| 700–1279px | 2 across | 2 across; the first of three spans the row | Scrolls |
| Under 700px | 2 across | 1 across | Scrolls |
┌──────┬──────┬──────┬──────┐│ KPI │ KPI │ KPI │ KPI │├──────┴──────┴──┬───┴──────┤│ │ Side 1 ││ Hero ├──────────┤│ │ Side 2 │└────────────────┴──────────┘.board--hero { grid-template-rows: auto minmax(0, 1fr);}.band--hero { grid-template-columns: minmax(0, 2fr) minmax(0, 1fr); grid-template-rows: repeat(2, minmax(0, 1fr));}.band--hero > .hero { grid-row: 1 / -1;}
/* 64 + 2 × 16 + 96 + 16 + (2 × 252 + 16) = 728 */@media (width < 1280px), (height < 728px) { .board--hero { height: auto; grid-template-rows: none; } /* The hero keeps the height of two chart rows and a gap. */ .band--hero { grid-template-rows: minmax(calc(2 * var(--chart-min) + var(--gap)), auto) minmax(var(--chart-min), auto); }}@media (width < 1280px) { .band--hero { grid-template-columns: repeat(2, minmax(0, 1fr)); } .band--hero > .hero { grid-column: 1 / -1; grid-row: auto; }}@media (width < 700px) { .band--hero { grid-template-columns: minmax(0, 1fr); grid-template-rows: none; grid-auto-rows: minmax(var(--chart-min), auto); } .band--hero > .hero { min-height: calc(2 * var(--chart-min) + var(--gap)); }}| Width | Hero | Smaller charts |
|---|---|---|
| 1280px and wider | Left two-thirds | Stacked on the right |
| 700–1279px | Full width | 2 across below |
| Under 700px | Full width | 1 across below |
Column
Section titled “Column”┌──────┬────────────────────┐│ KPI │ Detail main │├──────┤ ││ KPI ├──────────┬─────────┤├──────┤ Detail B │Detail C ││ KPI │ │ │└──────┴──────────┴─────────┘Make each KPI a <button> with aria-pressed, so the selected one is announced and reachable by
keyboard.
.board--column {  grid-template-columns: minmax(0, 1fr) minmax(0, 3fr);}.kpi-stack {  display: grid;  grid-template-rows: repeat(4, minmax(0, 1fr));  gap: var(--gap);  min-height: 0;}.detail {  display: grid;  grid-template-columns: repeat(2, minmax(0, 1fr));  grid-template-rows: repeat(2, minmax(0, 1fr));  gap: var(--gap);  min-height: 0;}.detail > :first-child {  grid-column: 1 / -1;}
/* Width: two 320px detail charts, 15 for a classic scrollbar: (2 × 320 + 16) × 4/3 + 2 × 16 + 16 + 15 ≈ 938. Height: 64 + 2 × 16 + 2 × 252 + 16 = 616. */@media (width < 939px), (height < 616px) { .board--column { height: auto; } .detail { grid-template-rows: none; grid-auto-rows: minmax(var(--chart-min), auto); }}@media (width < 939px) { .board--column { grid-template-columns: minmax(0, 1fr); } .kpi-stack { grid-template-rows: none; grid-template-columns: repeat(4, minmax(0, 1fr)); }}@media (width < 700px) { .kpi-stack { grid-template-columns: repeat(2, minmax(0, 1fr)); } .detail { grid-template-columns: minmax(0, 1fr); }}| Width | KPIs | Detail |
|---|---|---|
| 939px and wider | Stacked in the left quarter | Right three-quarters |
| 700–938px | 4 across above the detail | Full width |
| Under 700px | 2 across | 1 across |
Subject columns
Section titled “Subject columns”┌──────┬──────┬──────┬──────┐│ KPI │ KPI │ KPI │ KPI │├──────┼──────┼──────┼──────┤│chart │chart │chart │chart │├──────┼──────┼──────┼──────┤│chart │chart │chart │chart │└──────┴──────┴──────┴──────┘Mark up each subject as one element containing its KPI and its charts, so visual, reading and keyboard order agree at every width:
<div class="board board--subjects"> <section class="subject" aria-labelledby="revenue-title"> <!-- KPI, then this KPI's charts --> </section> <!-- one section per subject --></div>.board--subjects { grid-template-columns: repeat(4, minmax(0, 1fr)); /* Repeats for each row of subjects, so the rule serves 4, 2 and 1 columns. */ grid-auto-rows: auto minmax(0, 1fr) minmax(0, 1fr);}/* subgrid puts every subject on the board's rows, so a KPI that wraps grows its whole row and the charts stay aligned across columns. */.subject { display: grid; grid-row: span 3; grid-template-rows: subgrid; min-height: 0;}
/* 64 + 2 × 16 + 96 + 2 × 16 + 2 × 252 = 728 */@media (width < 1375px), (height < 728px) { .board--subjects { height: auto; grid-auto-rows: auto minmax(var(--chart-min), auto) minmax(var(--chart-min), auto); }}/* Four columns at --chart-min-w: 4 × 320 + 3 × 16 + 2 × 16 + 15 = 1375 */@media (width < 1375px) { .board--subjects { grid-template-columns: repeat(2, minmax(0, 1fr)); }}@media (width < 700px) { .board--subjects { grid-template-columns: minmax(0, 1fr); }}| Width | Subjects |
|---|---|
| 1375px and wider | 4 across |
| 700–1374px | 2 across; scrolls |
| Under 700px | 1 across; scrolls |