

Add a filter to a chart
This page shows how to add a filter to a Data App in App Builder, so that choosing a value narrows what a chart shows. You do it by asking Nash: App Builder has no drag-and-drop palette, and Nash writes the filter into the app for you. You then try the filter yourself in Preview.
This page is for App Builder. If you are writing the app’s code yourself, see Filters and selections and the Interactivity guide instead. If you are filtering a workbook, see Using Filters - Filtering in Astrato, which describes the workbook editor.
Before you start
Section titled “Before you start”-
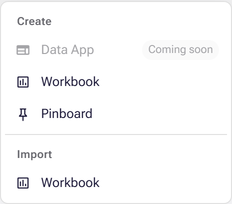
You have App Builder. It is in Private Preview and off by default. To check, open Analytics → Library and select Create: if Data App is greyed out with Coming soon, or missing, App Builder is not on for you, and this page’s steps cannot be followed. See Check which preview features you have for how to ask for it.
-
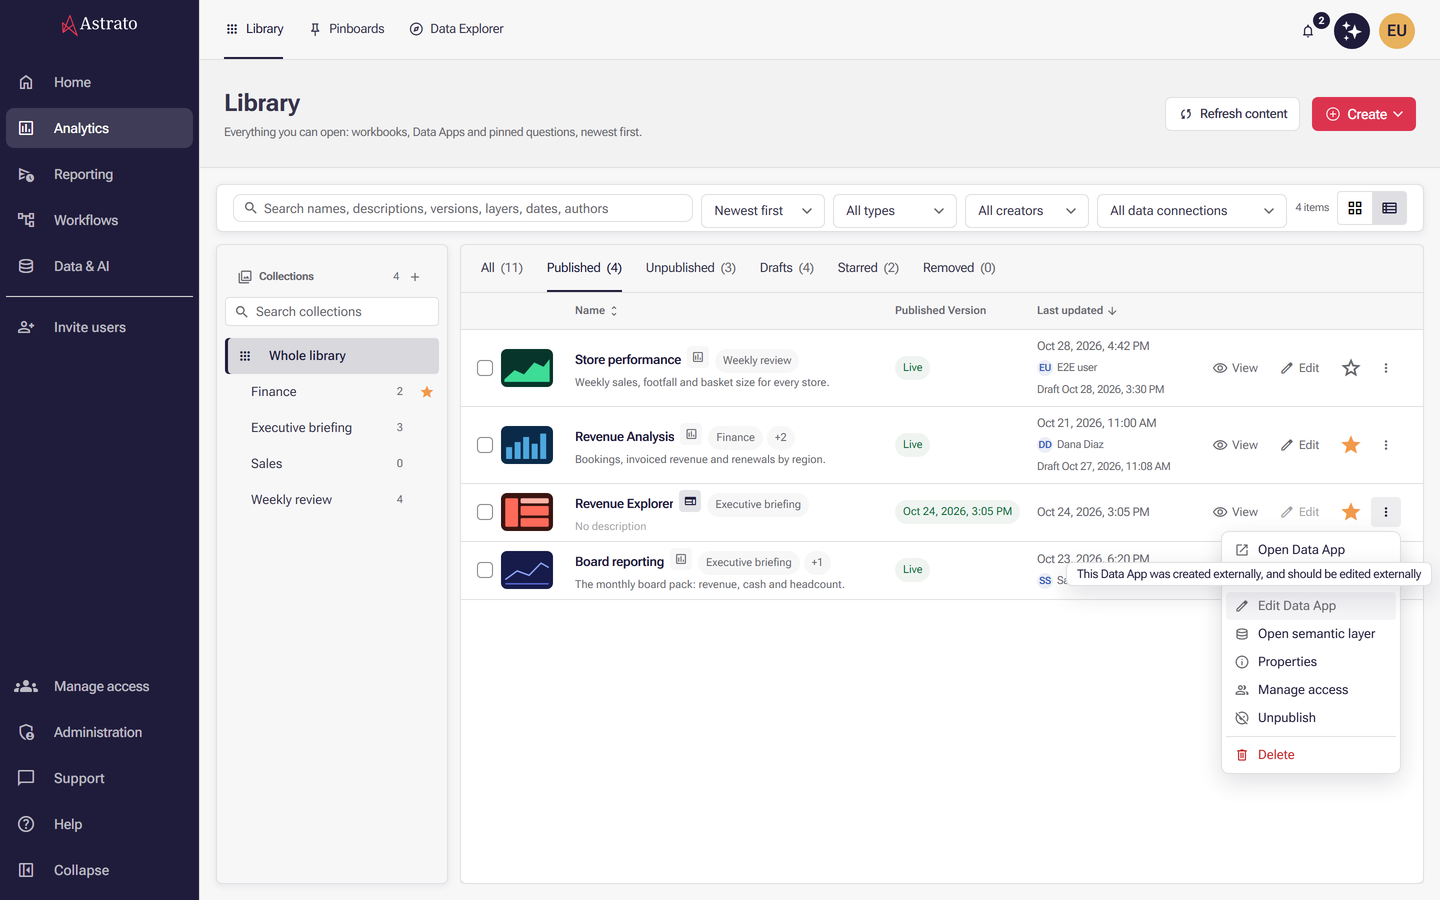
You can open the app in App Builder. An app you created yourself opens from Drafts in the Library, whatever your role, because an app is private to its creator until it is published. To open a published app with Edit Data App, your role must be Owner, Admin, Creator or Designer, you need Manage permission on that app, and the app must have been made in App Builder. For an app made outside App Builder, Edit Data App is greyed out with the hint This Data App was created externally, and should be edited externally. See Roles and Manage Data Apps.
-
To publish the change in step 4, you need publication Create and Publish permissions for an app’s first publish, or Publish permission on an app that is already published. Without them you can still add the filter and try it in Preview.
-
You have a Data App open in App Builder with at least one chart that shows data. If you do not have one yet, follow Your first Data App.
-
The field you want to filter by is in the app’s semantic layer and is published. The preview reads published dimensions and measures only, so publish the layer after adding a new field. See Semantic layer publishing.
-
The field comes from the same view as the chart’s data, or from a view joined to it. A filter on a field that is not connected to the chart is ignored by that chart.
To check before you start, open the semantic layer on Semantic Model → Map View. The table that holds your field and the table the chart reads must be the same box, or have a join line between them.
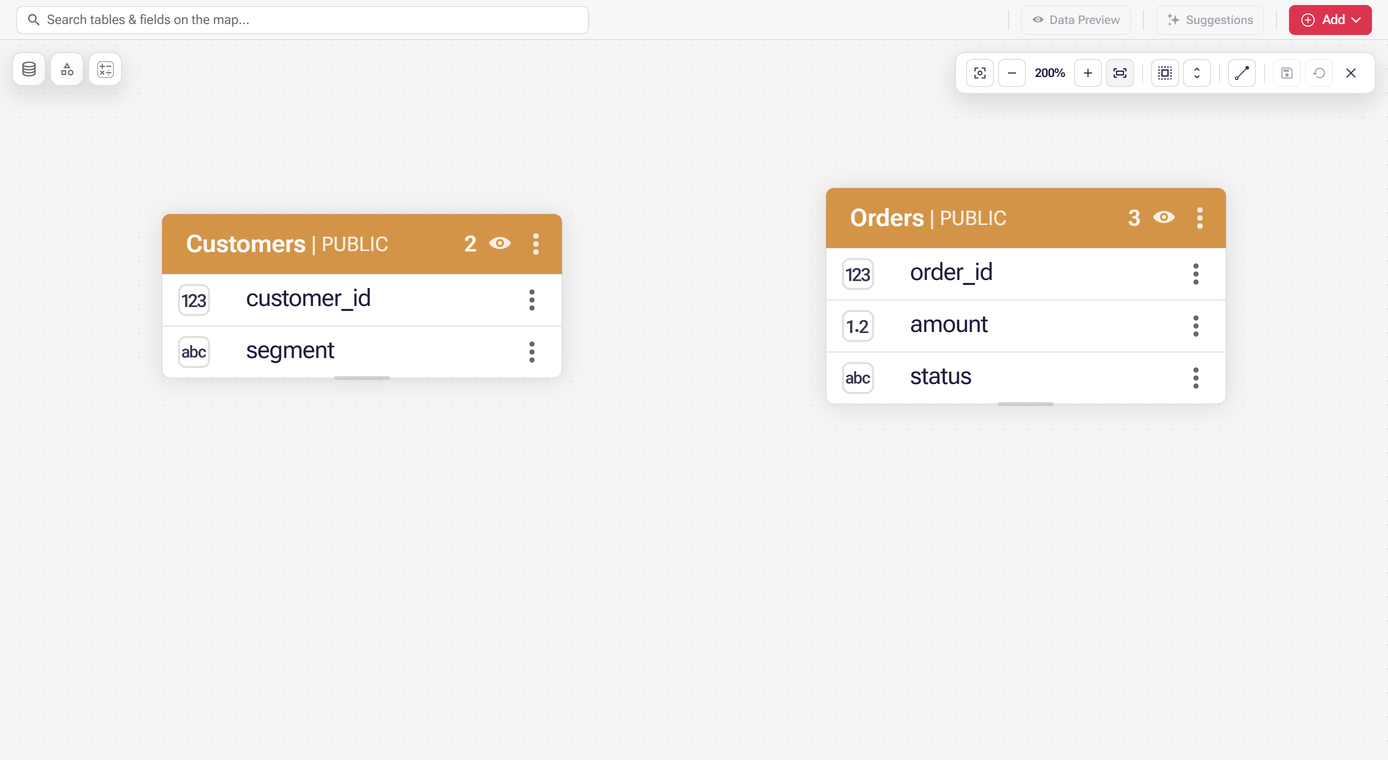
Not joined: two boxes with nothing between them. A filter on a field of one table does not change a chart that reads the other.
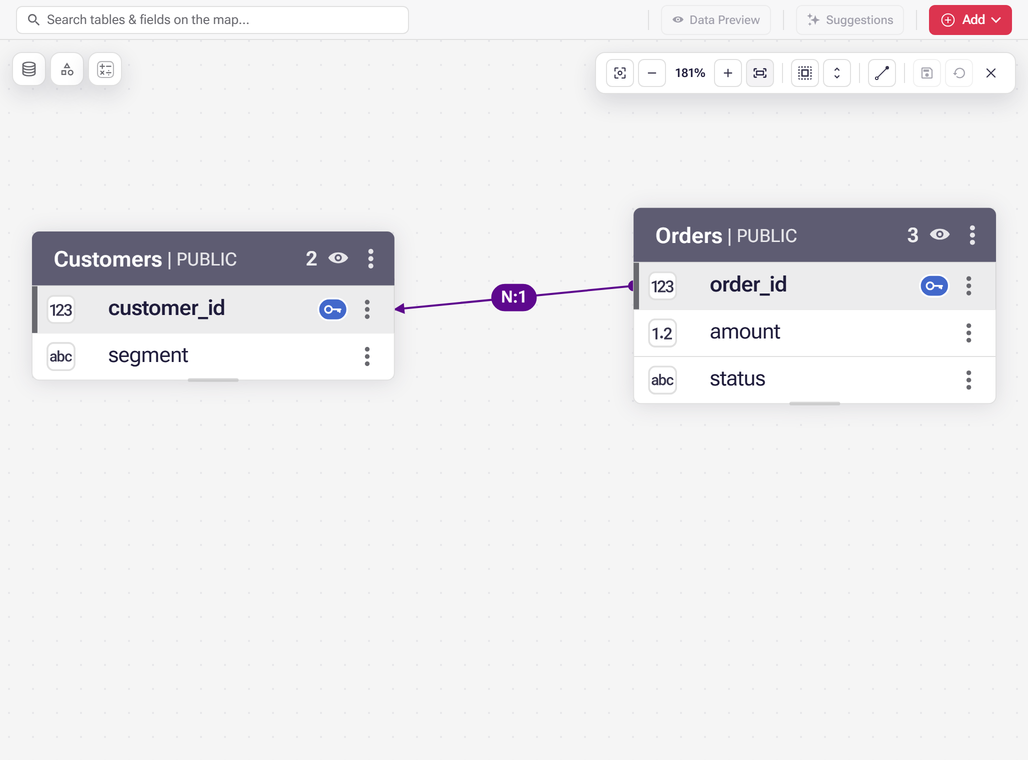
Joined: a line runs between the two boxes, labelled with its cardinality (here N:1), and the fields that make the join are marked with a key. A chart that reads one of these tables can follow a filter on a field of the other.
See What the Map View canvas is for. If you do not know which table a chart reads, ask Nash, for example:
Which table does the Revenue by month chart read? Is Region in that table or in a table joined to it?
1. Open your app
Section titled “1. Open your app”-
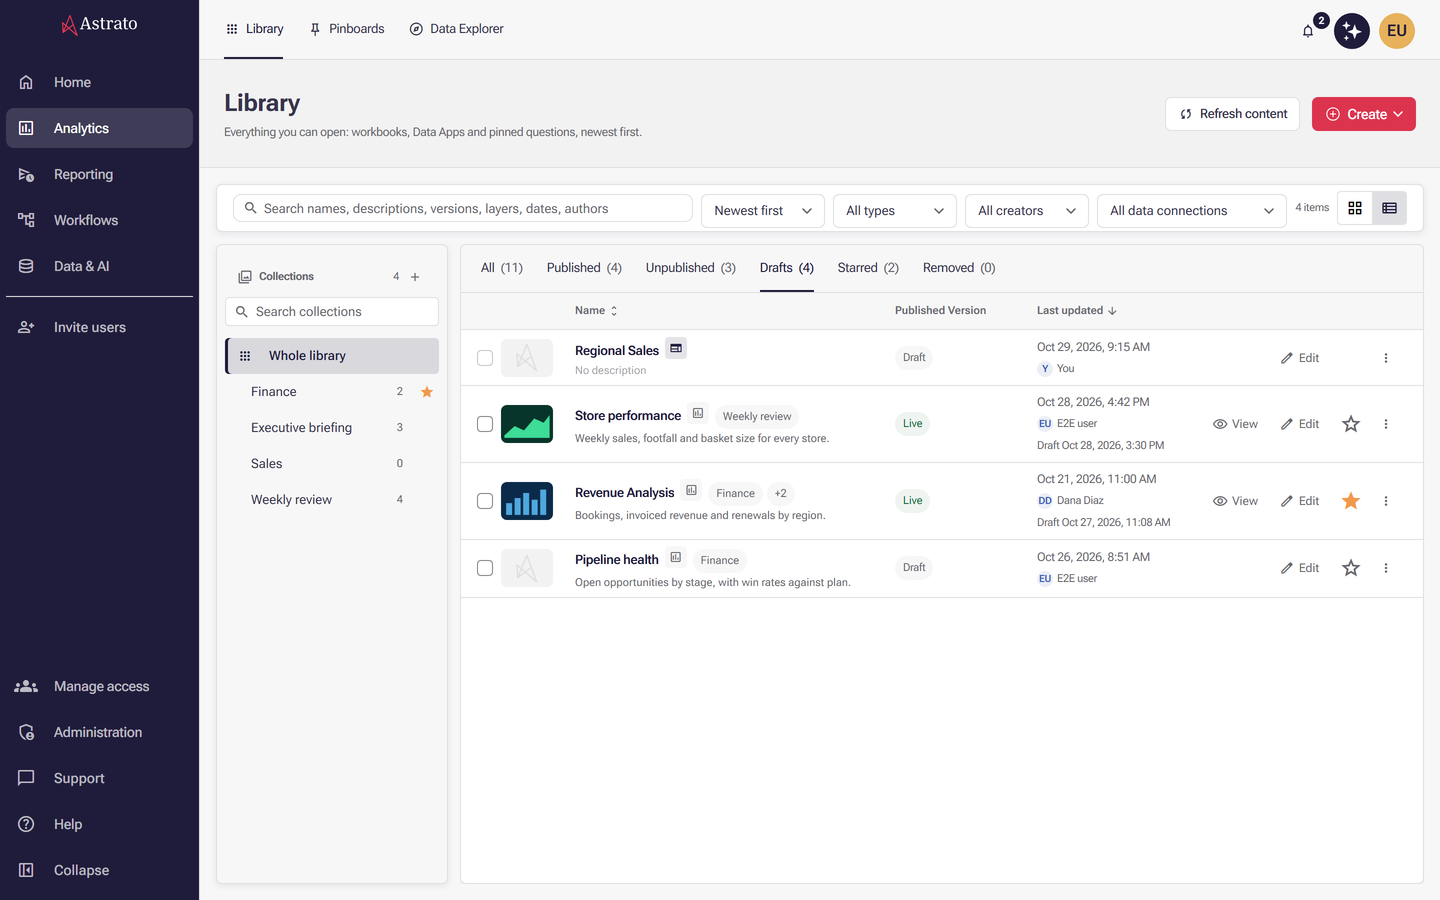
Open Analytics → Library.
-
Select Drafts to see apps you have not published yet, or All to see every app.
-
Choose your app. It opens in App Builder, with the Nash panel beside the preview.
-
Make sure Preview is selected, not Source files, and that the chart you want to filter shows data. Both tabs are at the left of the toolbar above the app; Publish is at the right end.

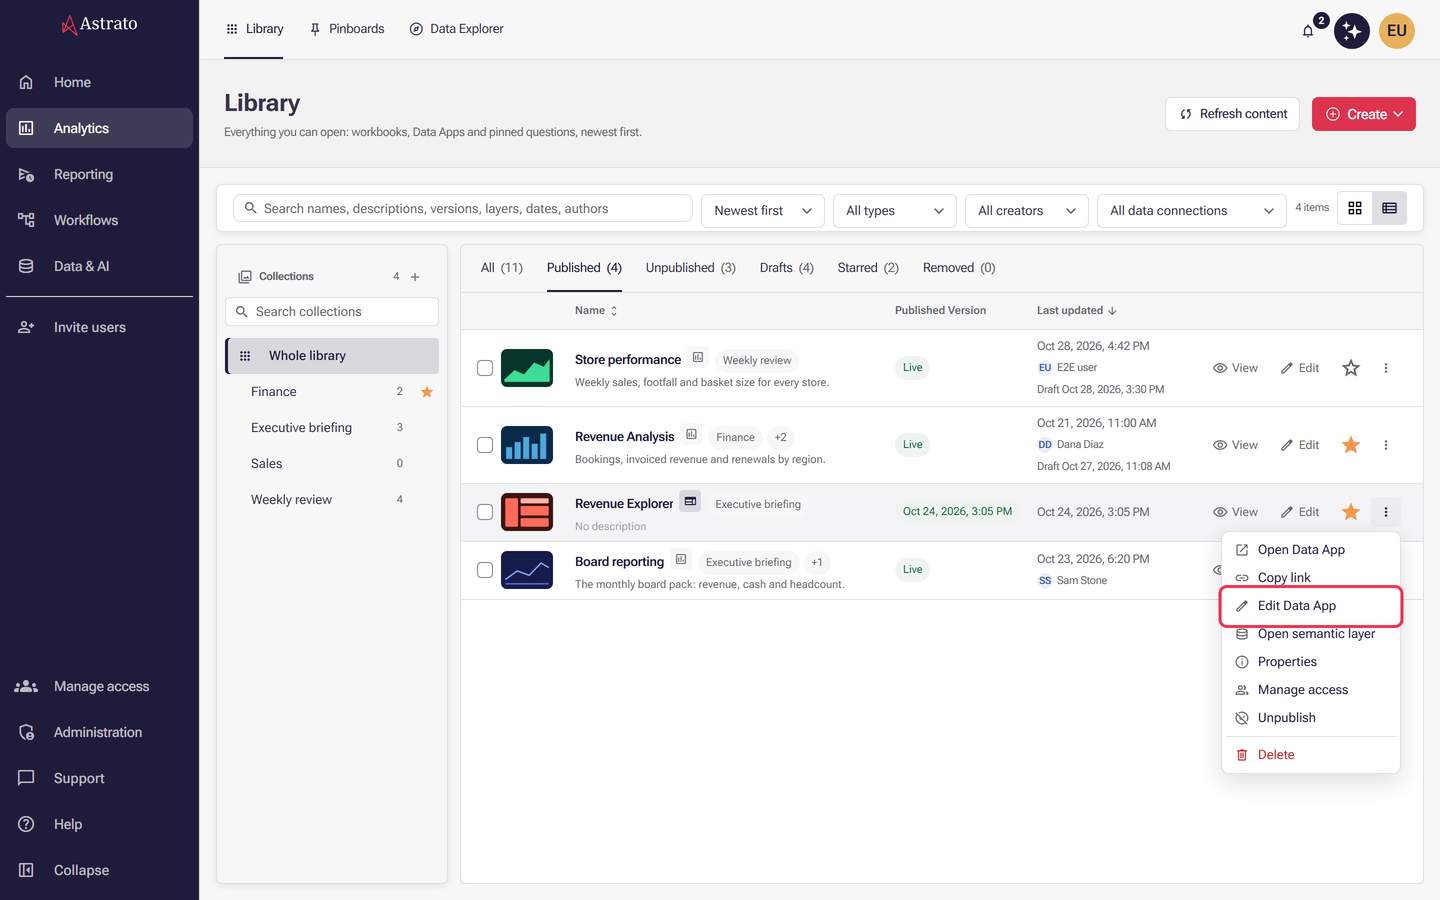
For an app that is already published, select Edit Data App from the three-dot menu at the end of its row to open its project. See Manage Data Apps.
2. Ask Nash for the filter
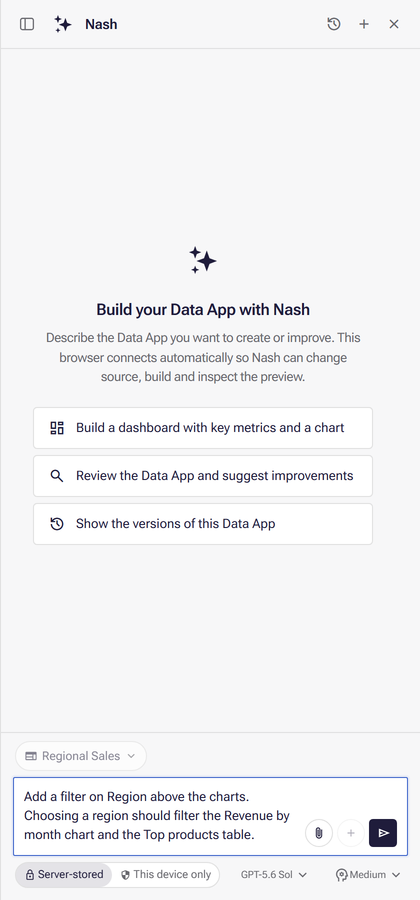
Section titled “2. Ask Nash for the filter”In the Nash panel, say which field to filter by and which charts it should change. Use the field’s name as it appears in your semantic layer. For example:
Add a filter on Region above the charts. Choosing a region should filter the Revenue by month chart and the Top products table.
You can also say:
- When the choice takes effect. “Apply the choice straight away” filters as soon as a reader picks a value. “Let readers pick several values, then select Apply” keeps the choice waiting until they confirm it.
- Which charts should not follow it, if some charts must always show every row.
- How the filter looks, such as a drop-down list or a list of values, and whether readers can search the values.
Send the message. Nash changes the app, builds a new preview and checks it. Its activity list shows each build and inspection, and its closing summary says which pages it checked.
3. Try the filter
Section titled “3. Try the filter”When Nash has finished:
- Find the new filter in Preview. It is usually in a row under the app’s header, but Nash chooses the layout, so it can be somewhere else.
- Open it and choose one value, for example one region.
- If Discard and Apply appear in the bar of selections, select Apply. Until you do, matching points are highlighted but the charts are not filtered.
What success looks like
Section titled “What success looks like”Nash writes a new filter each time you ask, so two people asking the same thing can get filters that look different and sit in different places. That is not a failure. The test is one thing: choosing a value changes the charts you named, and clearing it brings every row back. Where the filter sits, how it looks and how the bar of selections is drawn can all differ from what this page describes.
What you usually see:
- The charts you named redraw with only the rows for the value you chose. Totals and figures that follow the filter change to match.
- A bar near the top of the page shows a chip with the field name and your choice, such as Region: West. Select × on the chip to remove that choice, or Clear all to remove every choice.
- With nothing chosen, the bar shows a short hint, such as Nothing selected.
Clicking a bar or a slice of a chart is a selection too: it selects that value, appears in the same bar, follows the same Apply rule and is cleared the same way. Nash gives every chart it adds a way to clear such a click.
Preview ready in the header means only that the app built. It does not prove the filter works, so always try it as in step 3.

Change what Nash made
Section titled “Change what Nash made”If the filter works but is not what you wanted, ask Nash in the same conversation. Name the filter and say what to change. For example:
- To move it: “Move the Region filter to the top of the page, above the charts.”
- To change how it looks: “Make the Region filter a drop-down list that readers can search.”
- To link a chart that ignores it: “The Top products table does not change when I choose a region. Make it follow the Region filter.”
- To stop a chart following it: “Keep the Revenue by month chart showing every region, whatever is chosen in the Region filter.”
Then try the filter again as in step 3.
If the chart does not change
Section titled “If the chart does not change”| What you see | Likely cause | What to do |
|---|---|---|
| Discard and Apply are showing and the chart is unchanged | Your choice is waiting to be applied | Select Apply. |
| The chip shows your choice, but one chart keeps showing every row | The filter’s field is not connected to that chart’s view, or the chart is not linked to the filter | Paste this into Nash, with your own names: “The Top products table does not change when I choose a region. Make it follow the Region filter, and check that Region is connected to the table’s data.” If the views are not joined, draw a join in the semantic layer and publish it. |
| The chart becomes empty | No row matches every filter and selection on the page | Select Clear all, then choose again. See Filters or selections exclude every row. |
| The field is missing, or the filter lists no values | The field is not published in the semantic layer, or is named differently | Publish the layer, then ask Nash again using the field’s exact name. See The semantic layer was never published. |
| A notice at the bottom of the preview reports errors | The app hit an error while it ran | Select Show details to read it, then ask Nash to fix it. Nash sees the same errors when it checks the preview. |
| Your choice disappeared | Reload preview is a clean start: it opens the app with no selections | Choose the value again. To keep a default choice, ask Nash to set one when the app opens. |
If you are still stuck, describe in Nash exactly what you chose and what the chart showed. See also My chart is empty or shows an error.
4. Publish the change
Section titled “4. Publish the change”The filter reaches people who use the published app only when you publish. Select Publish at the right end of the toolbar. In the Publish app dialog, choose a collection or No collection if it offers the choice, then select Publish there. When it finishes, the header reads Published source version and the version number. If the app published but could not join the collection, the header reads Published, but could not add it to the collection; add it with Manage collections in its property panel. See Publishing from App Builder.
To check the filter shipped, open the app as its readers do: in Analytics → Library, select View in the app’s row, or Open Data App from its three-dot menu.
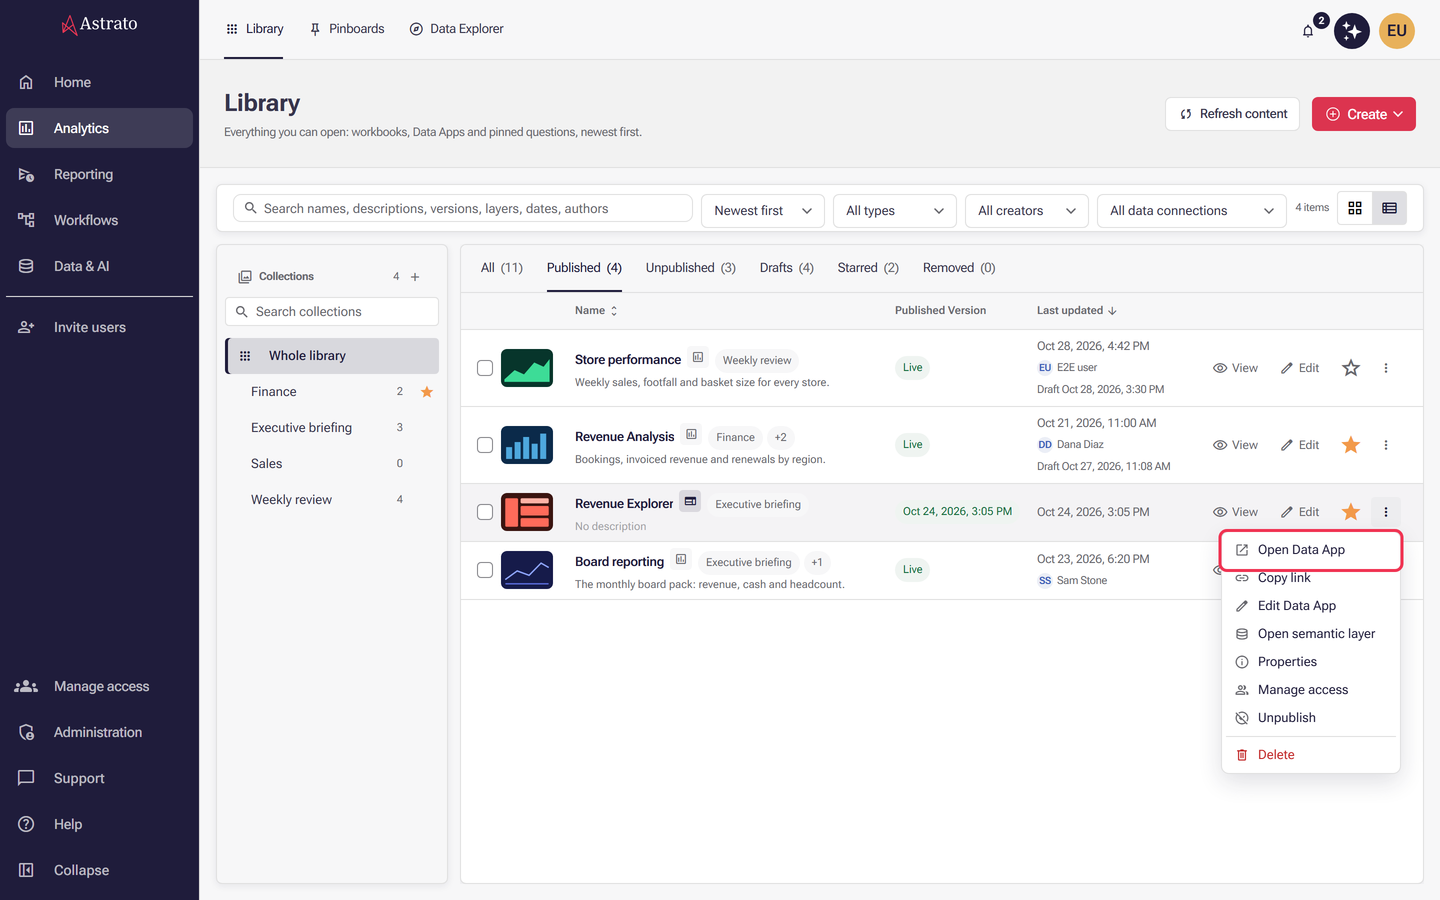
Choose a value in the filter and check that the same charts change as they did in Preview. If the published app has no filter, go back to App Builder. If publishing failed, App Builder shows the reason: resolve it and select Publish again. When the reason is a missing permission, ask an administrator for the publish permissions listed in Before you start. If Publish is not in the toolbar at all, this tab is probably not the one editing the app: only the browser that holds editing shows it. See Publishing from App Builder.
Two things called “filter bar”
Section titled “Two things called “filter bar””The docs use “filter bar” for two different things:
- Filter Bar under workbooks describes the filter bar of the workbook editor, with its New button and settings panels. It does not apply to Data Apps.
- Filter bar under app components is the developer pattern a Data App uses: a row of filters under the header with the bar of selections below it. Nash follows it when it adds filters. You need it only if you edit the app’s code yourself.
What next
Section titled “What next”- Your first Data App: build and publish an app from a data connection.
- Data Apps - Nash App Builder UI: everything about the preview, versions and publishing.
- My chart is empty or shows an error: what to check when a chart shows no data.
- Filters and selections: how filters work underneath, for developers.