Define a measure in Business Context
A measure is a number your organisation agrees on — revenue, orders, average order value. Other tools call it a metric or a KPI. Defining it once here, and publishing it, means every workbook, Data App and Nash answer on this semantic layer uses the same one.
Before you start
Section titled “Before you start”- You need a data connection and a semantic layer on it. See Create a semantic layer.
- The table that holds the number must already be in the layer. On the editor’s Map tab, select Add, then Tables & Views, and add it. A measure can only aggregate a field of a table the layer uses.
- You need edit access to the layer.
- Open the layer in the editor. In Data & AI → Semantic Layers, select the layer’s row; see Find a semantic layer if the list is long. Then select Business Context in the tab bar, then Measures in the row of sub-tabs beneath it. If you are new to this tab, What Business Context is for explains it.
Create a measure
Section titled “Create a measure”This is the common case: one number that adds up a column, such as total revenue from an order amount. It takes a minute.
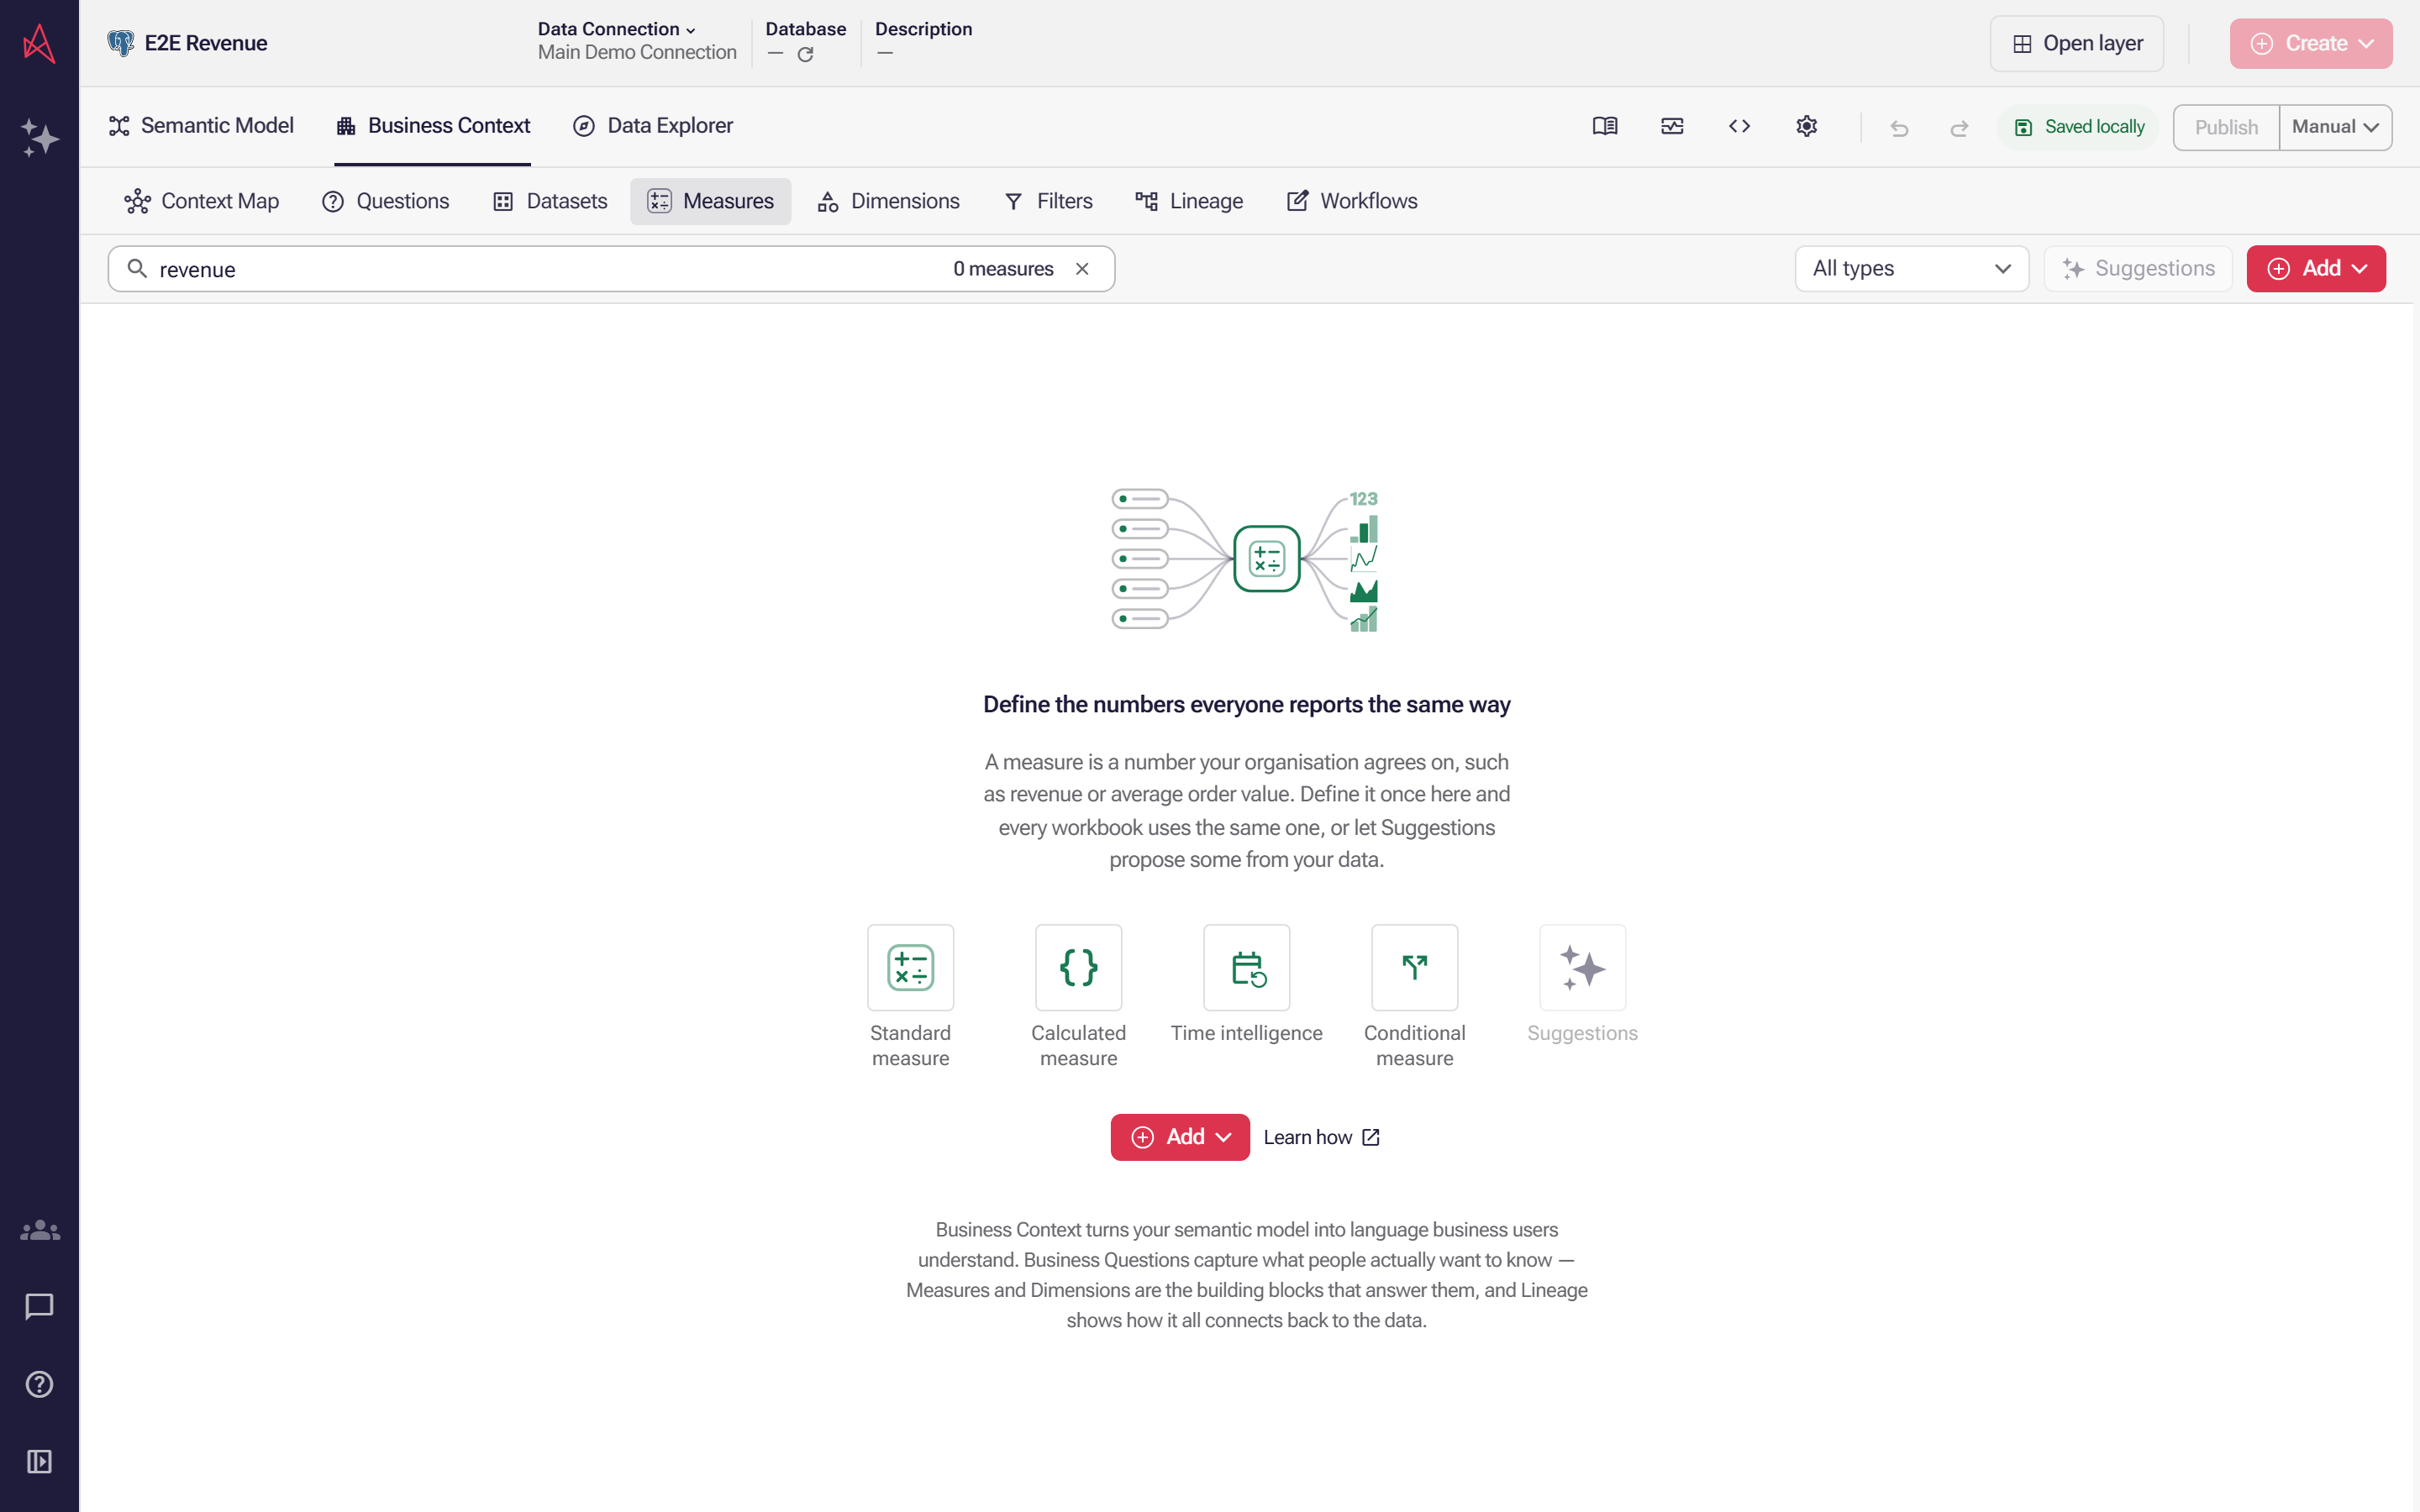
Before you add a measure, type its name, such as revenue, in Search measures… on the Measures sub-tab of Business Context. If one is listed, use it rather than defining the number a second time.
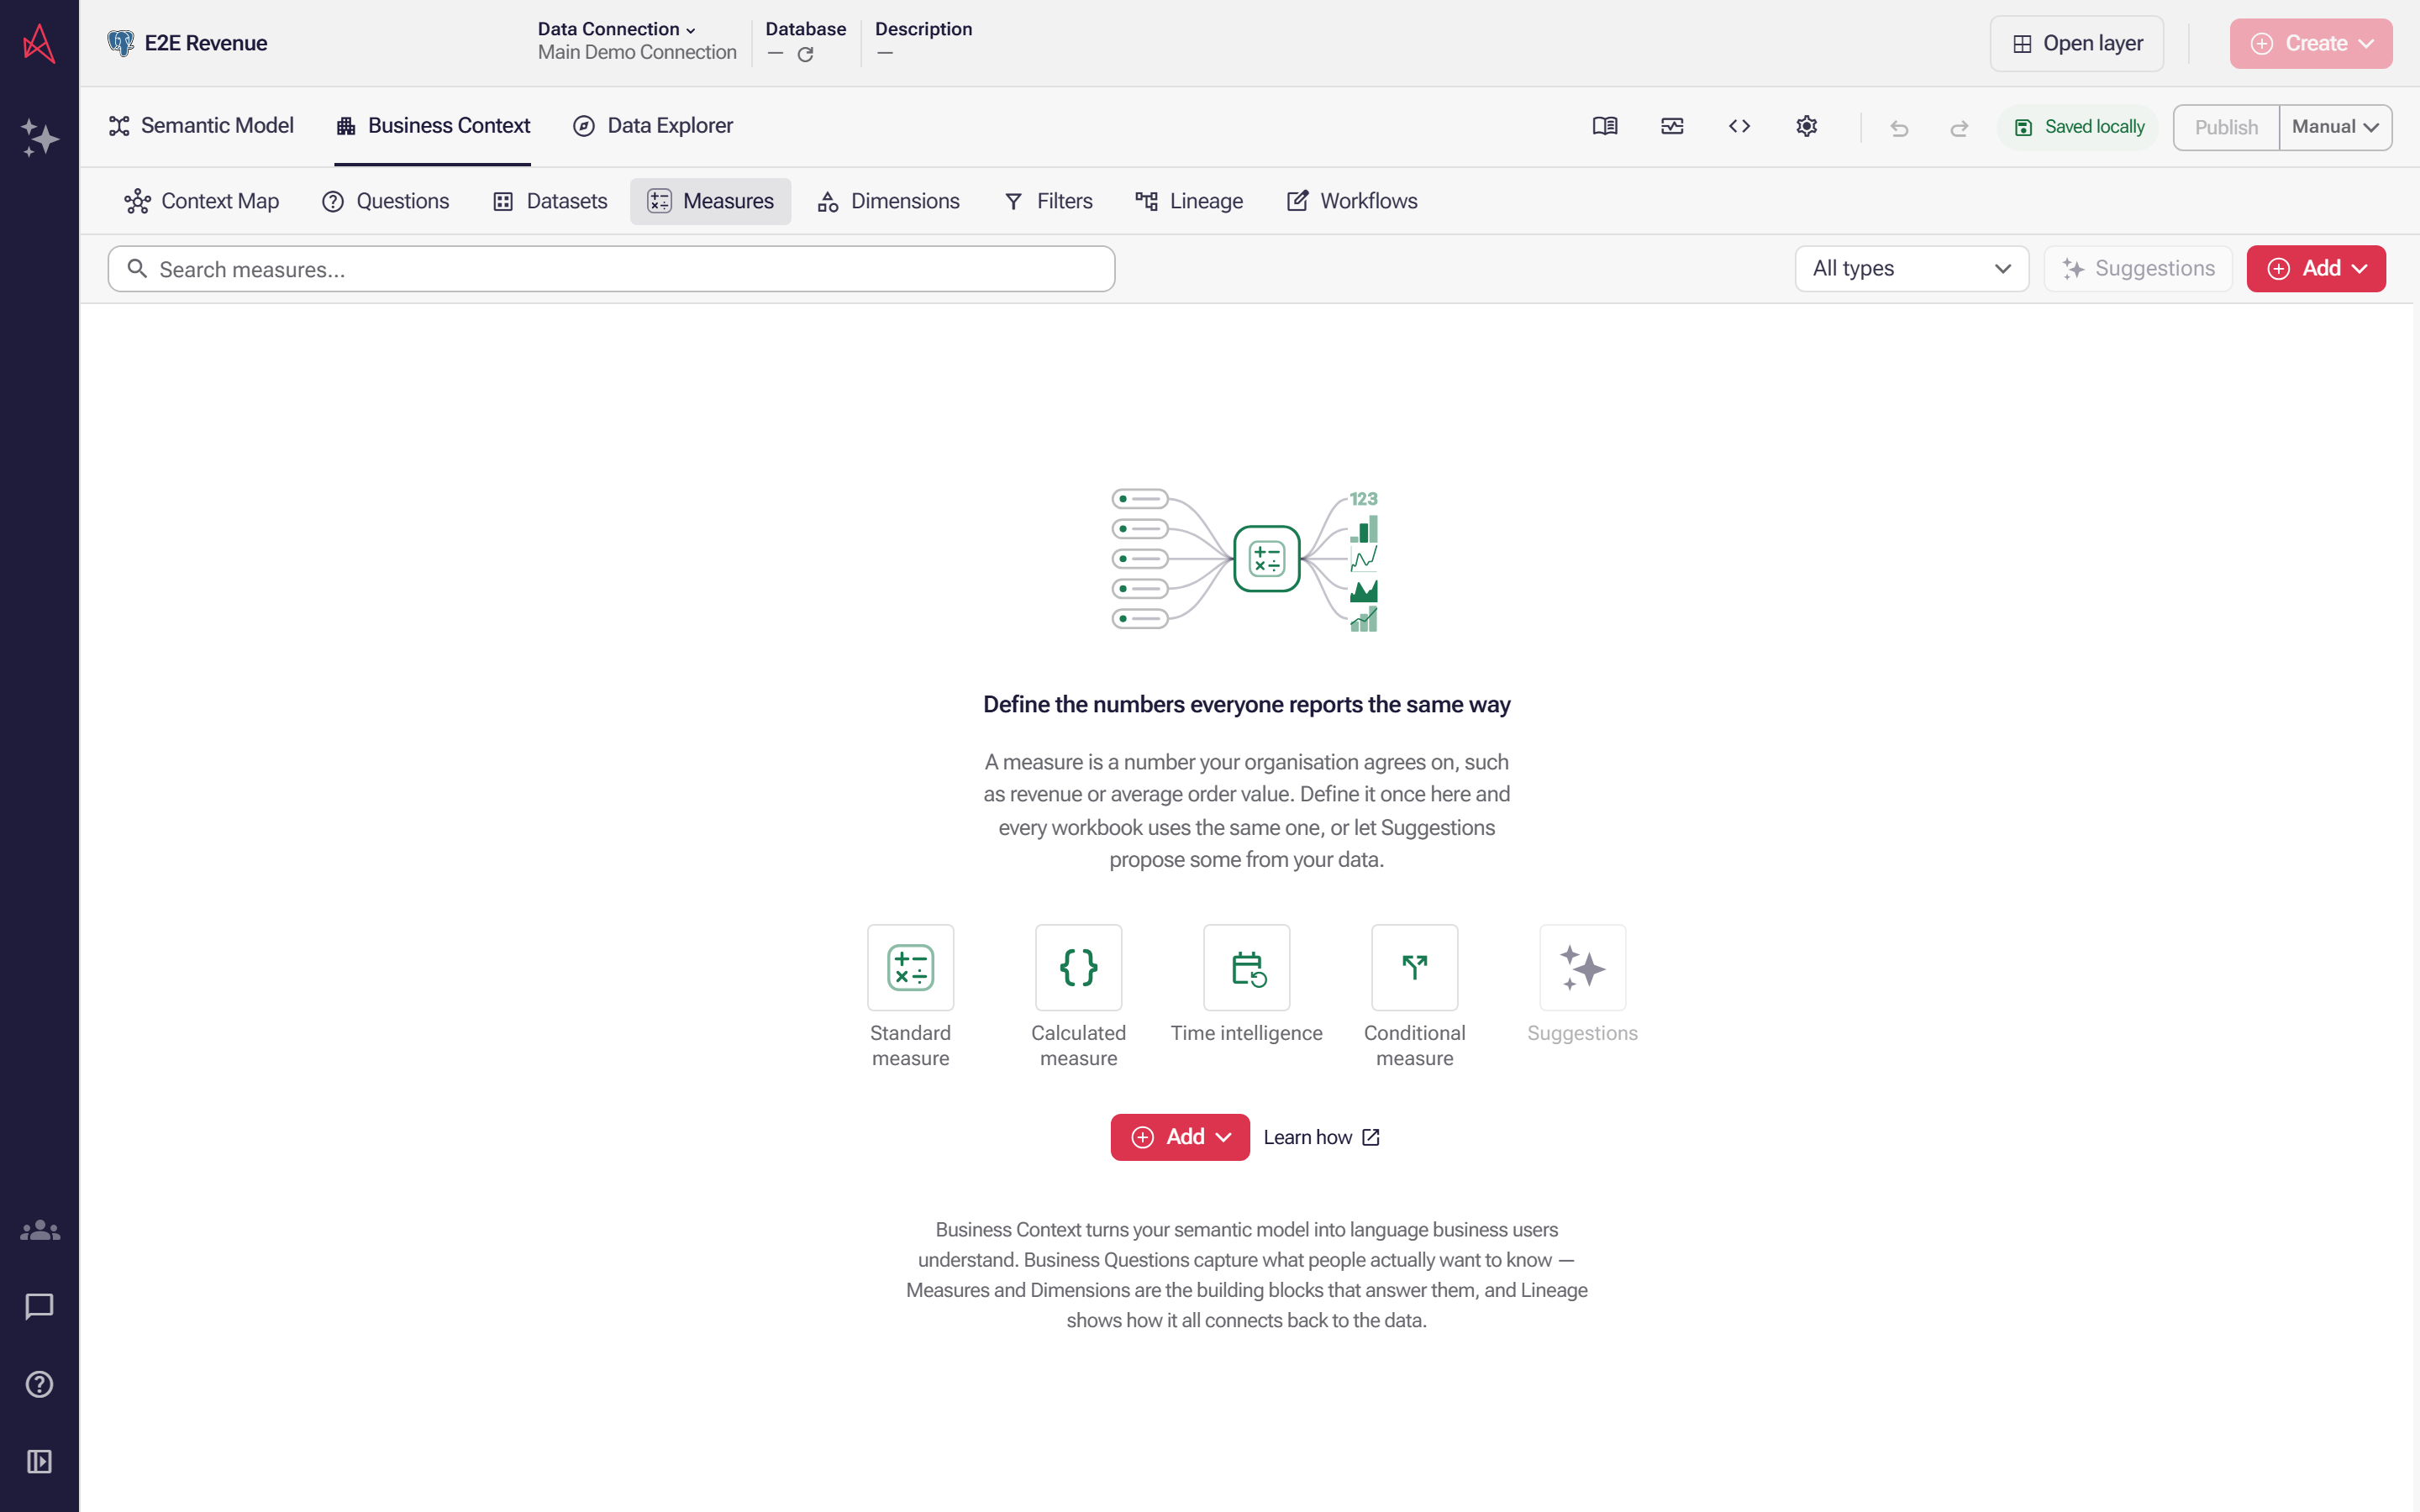
Nothing matches, so select Add. A new layer starts with no measures, so this is where you make the first one.
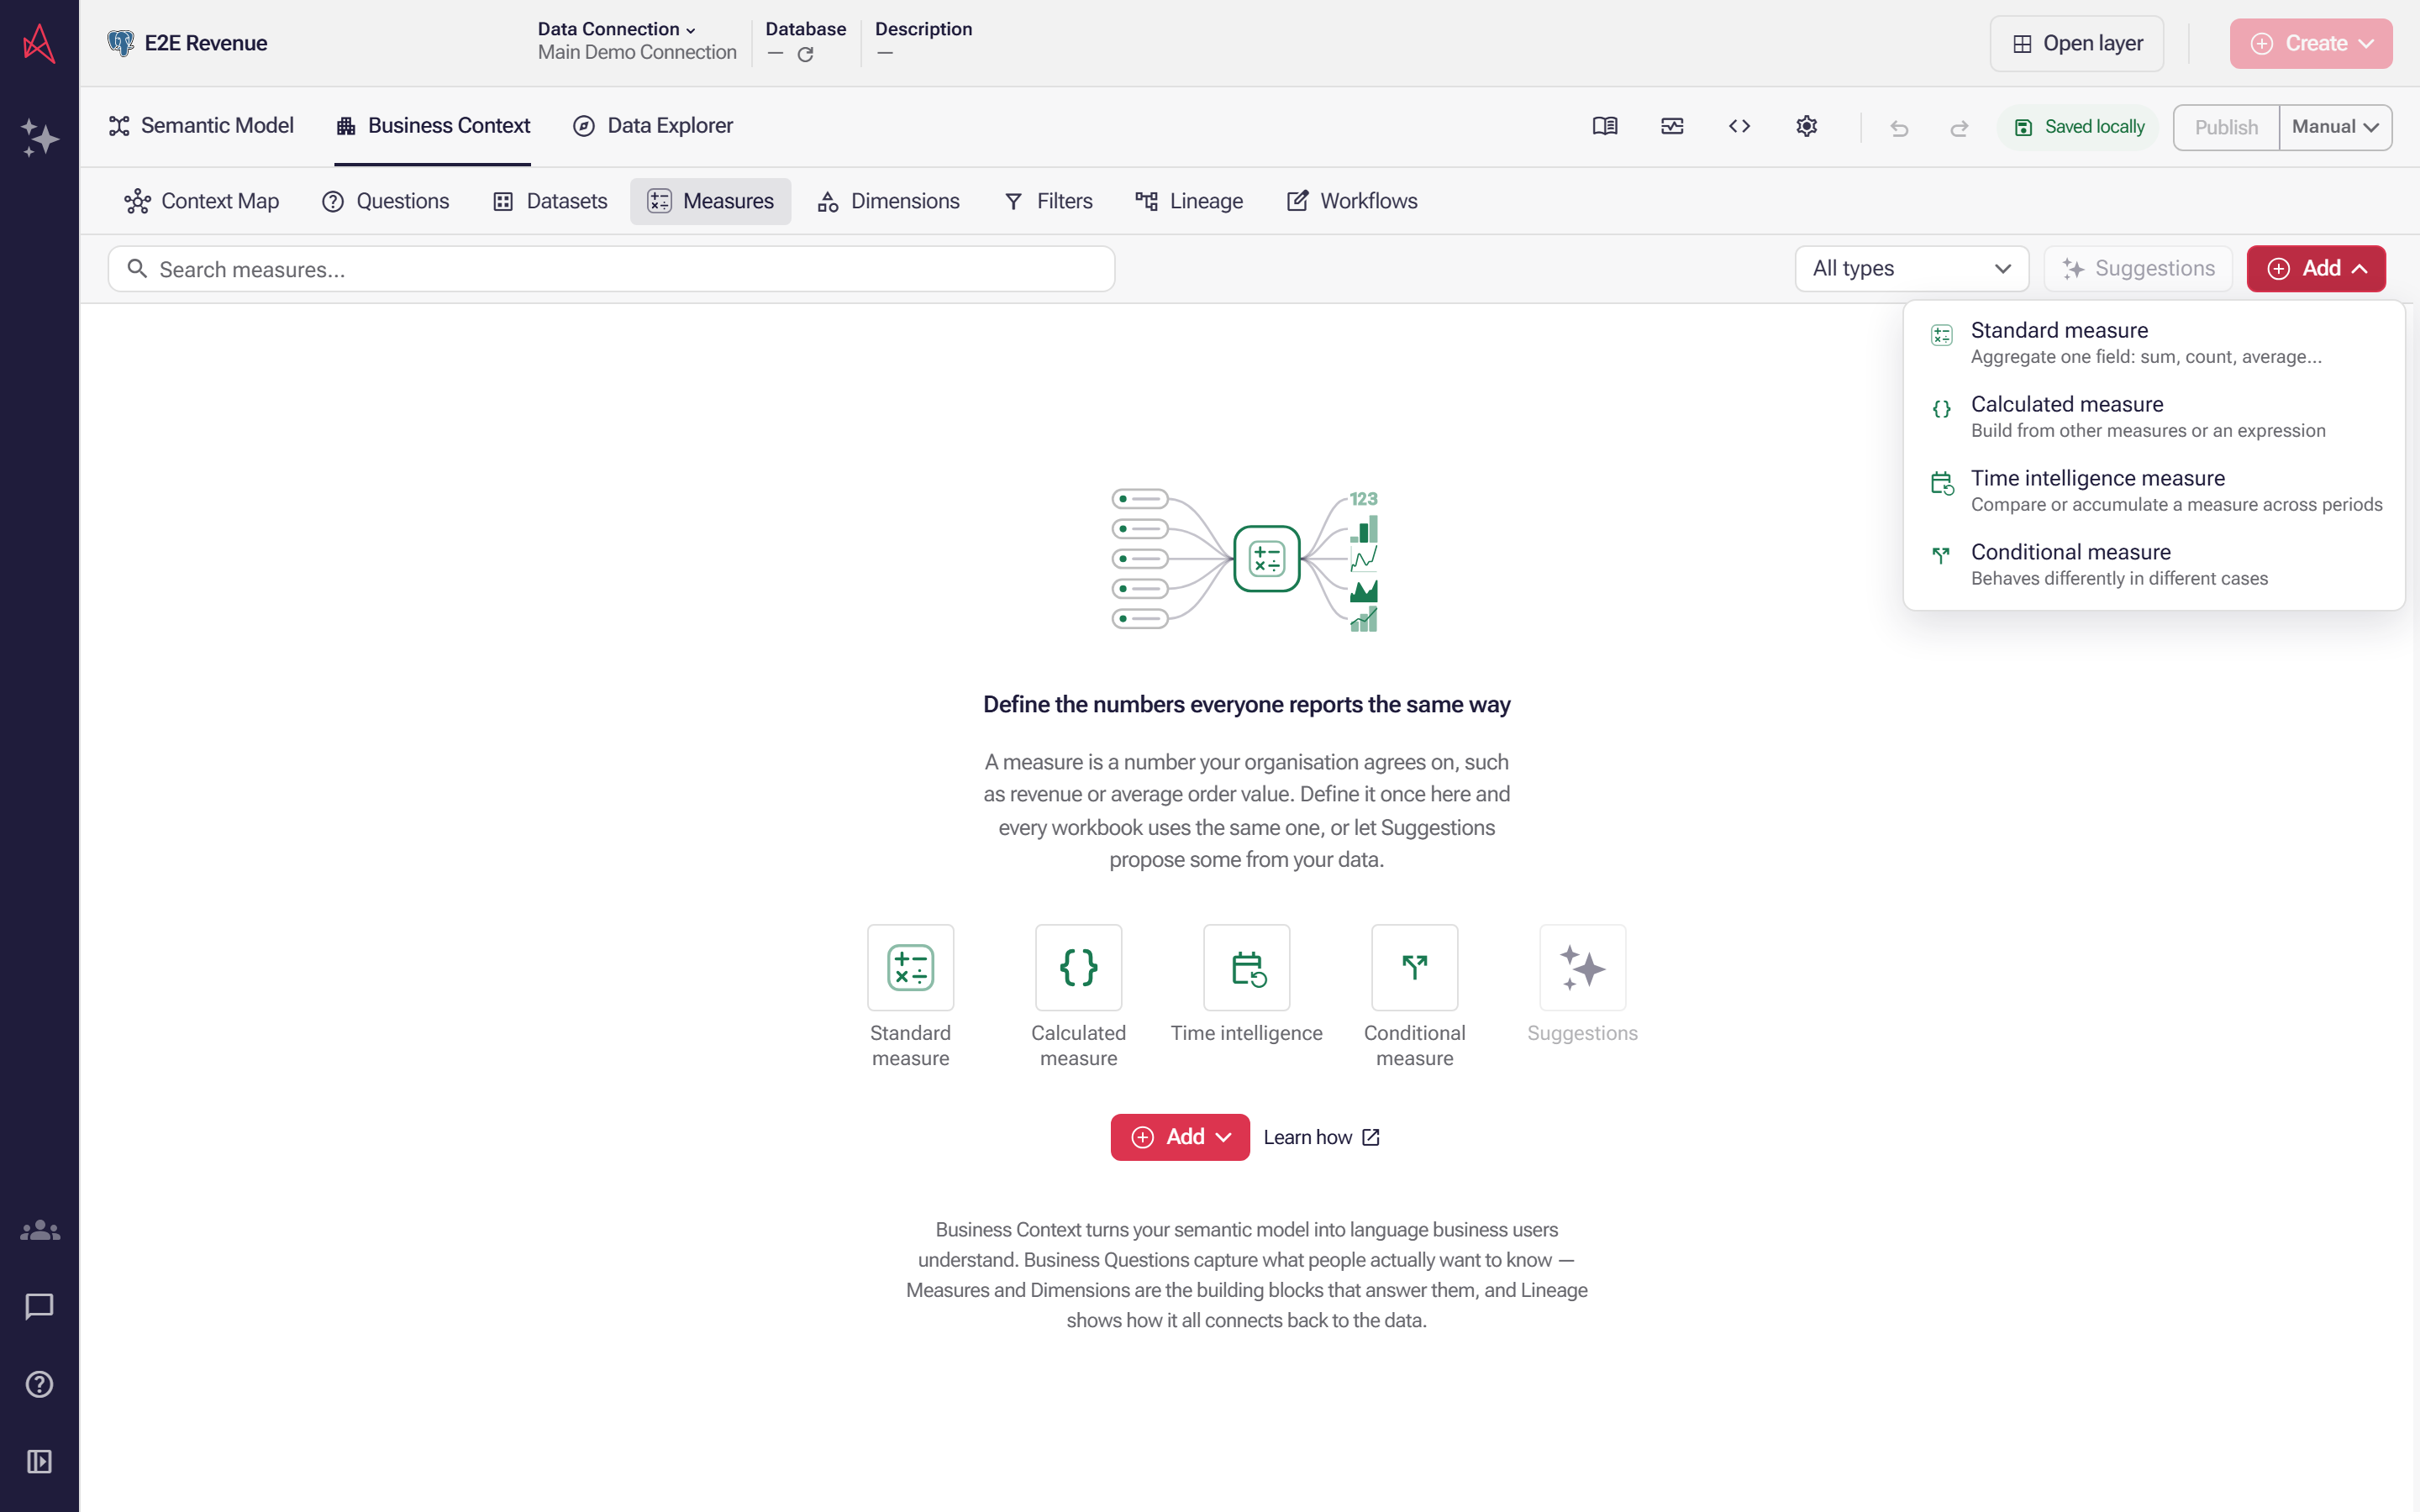
Select Standard measure. Each kind in the menu carries a line on what it is for, so you choose the shape before you name anything.
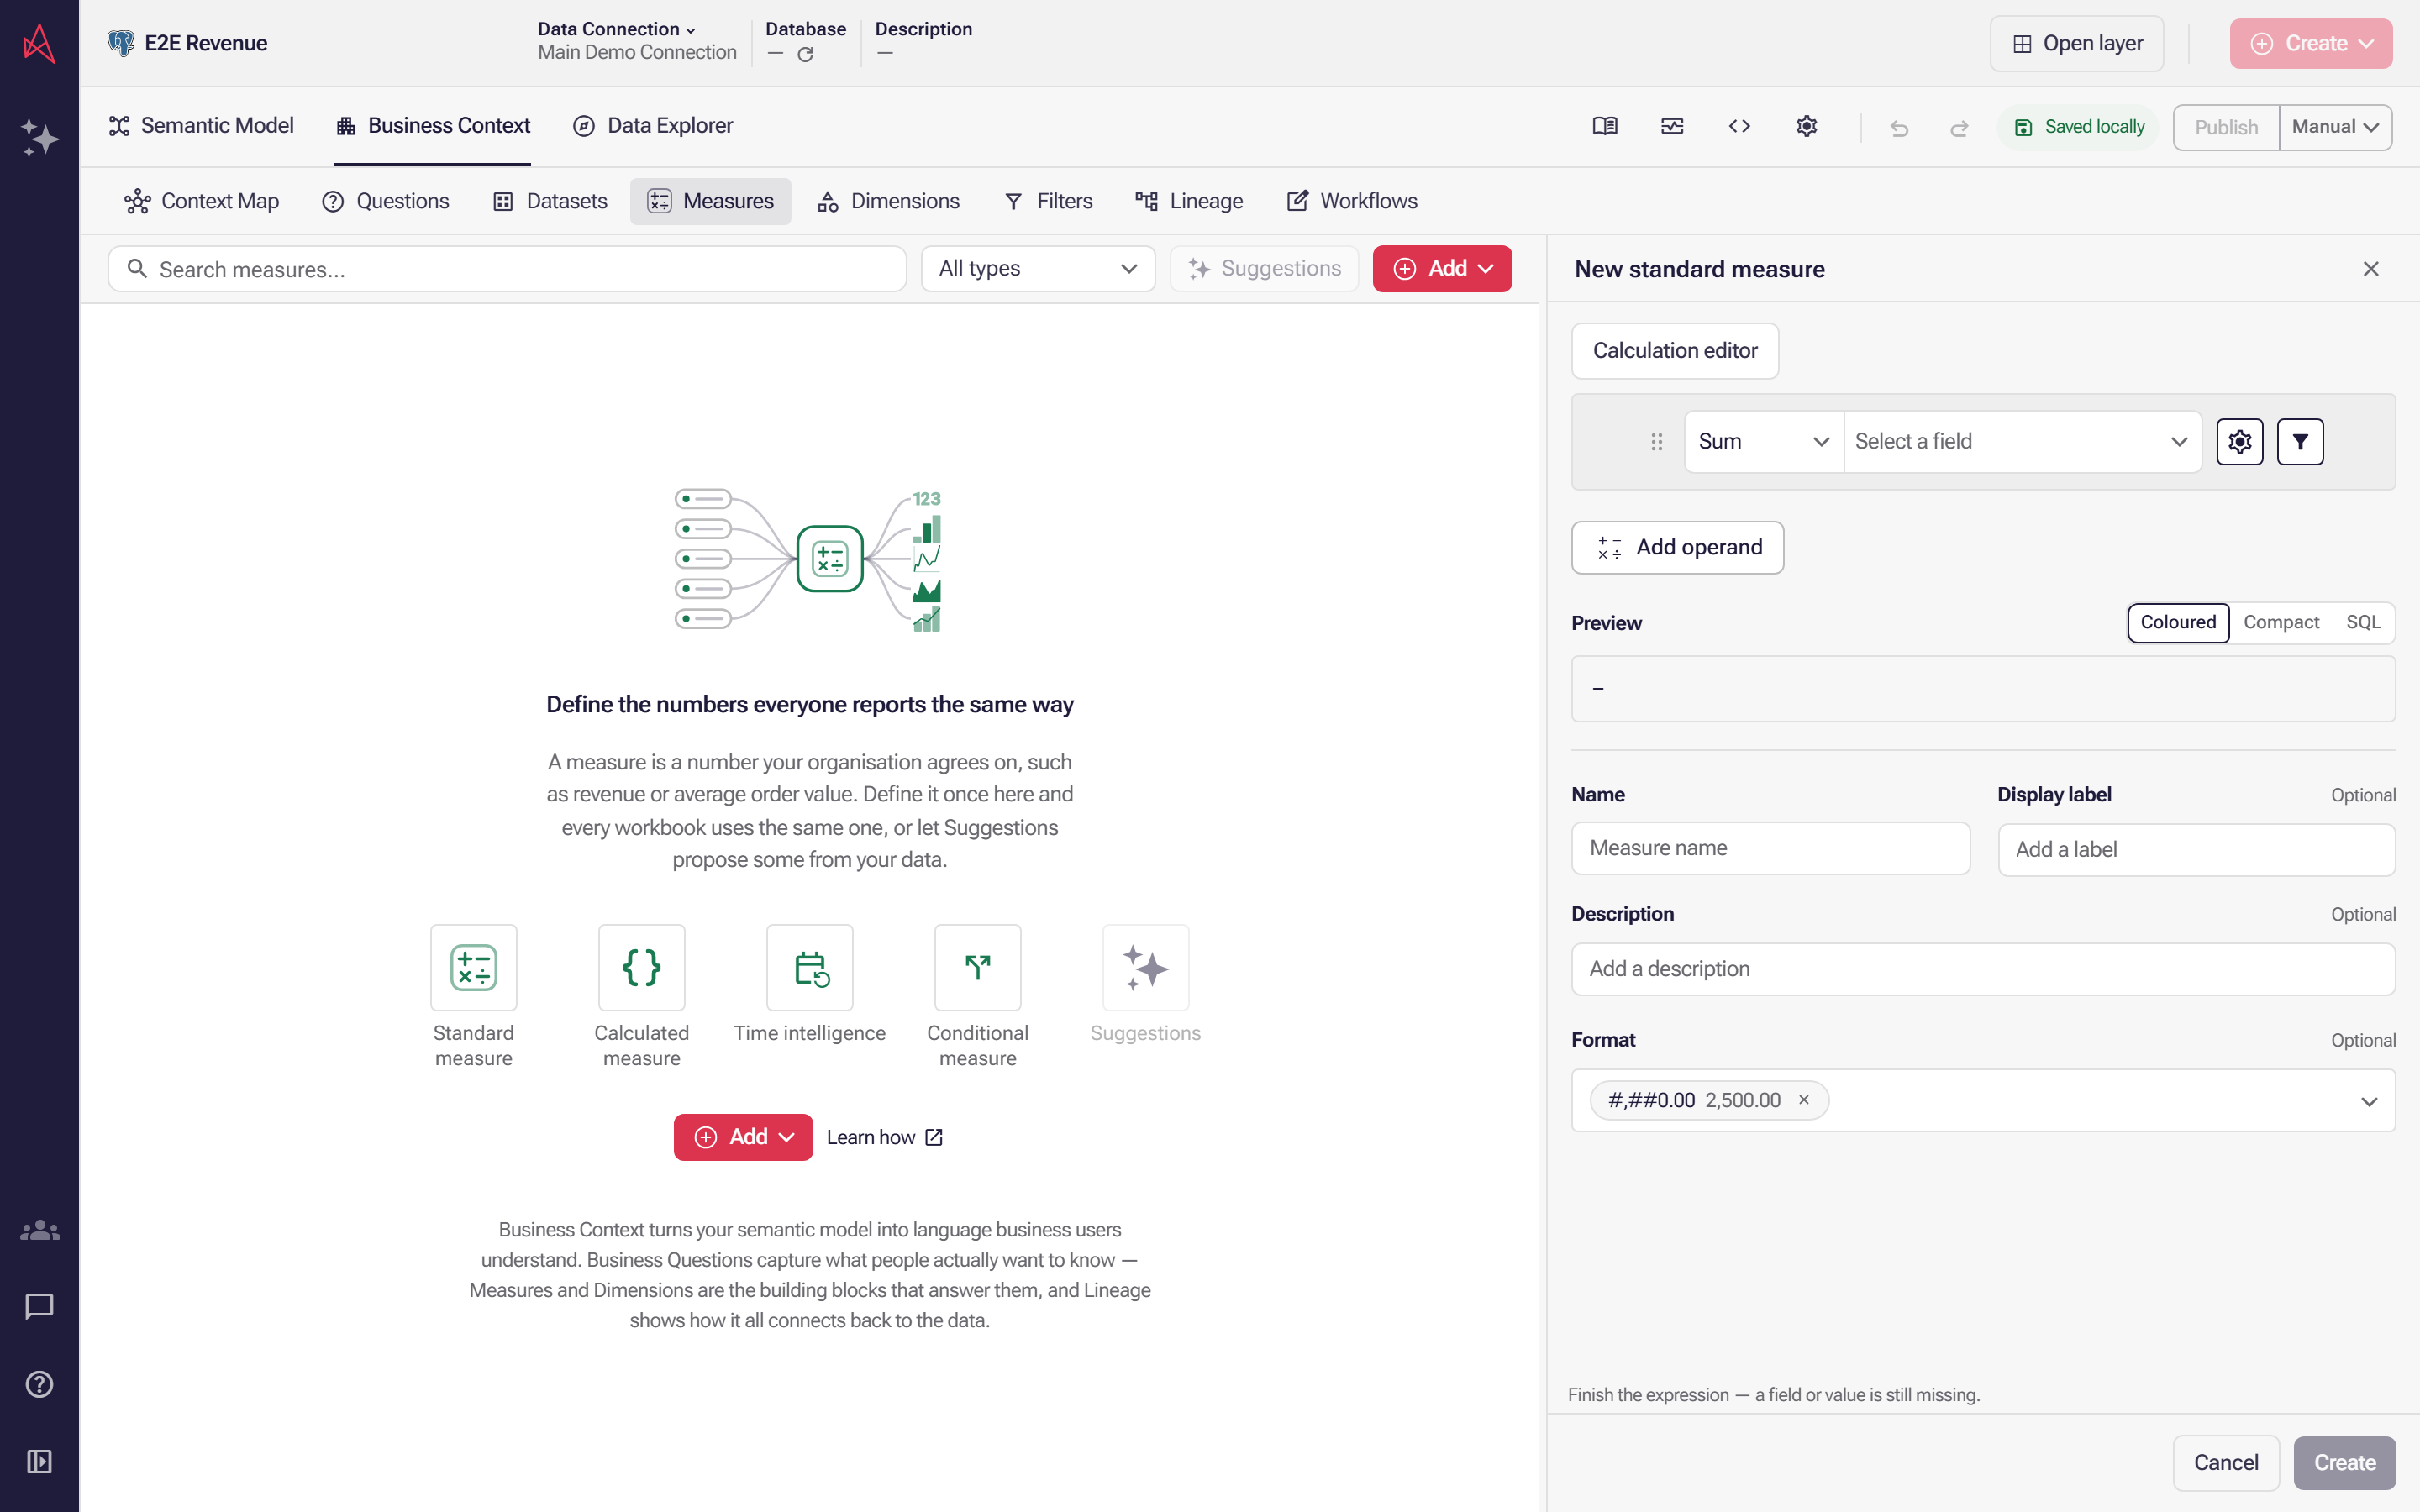
A panel titled New standard measure opens on the right. Create is unavailable until the measure has a field and a name, so start with Select a field.
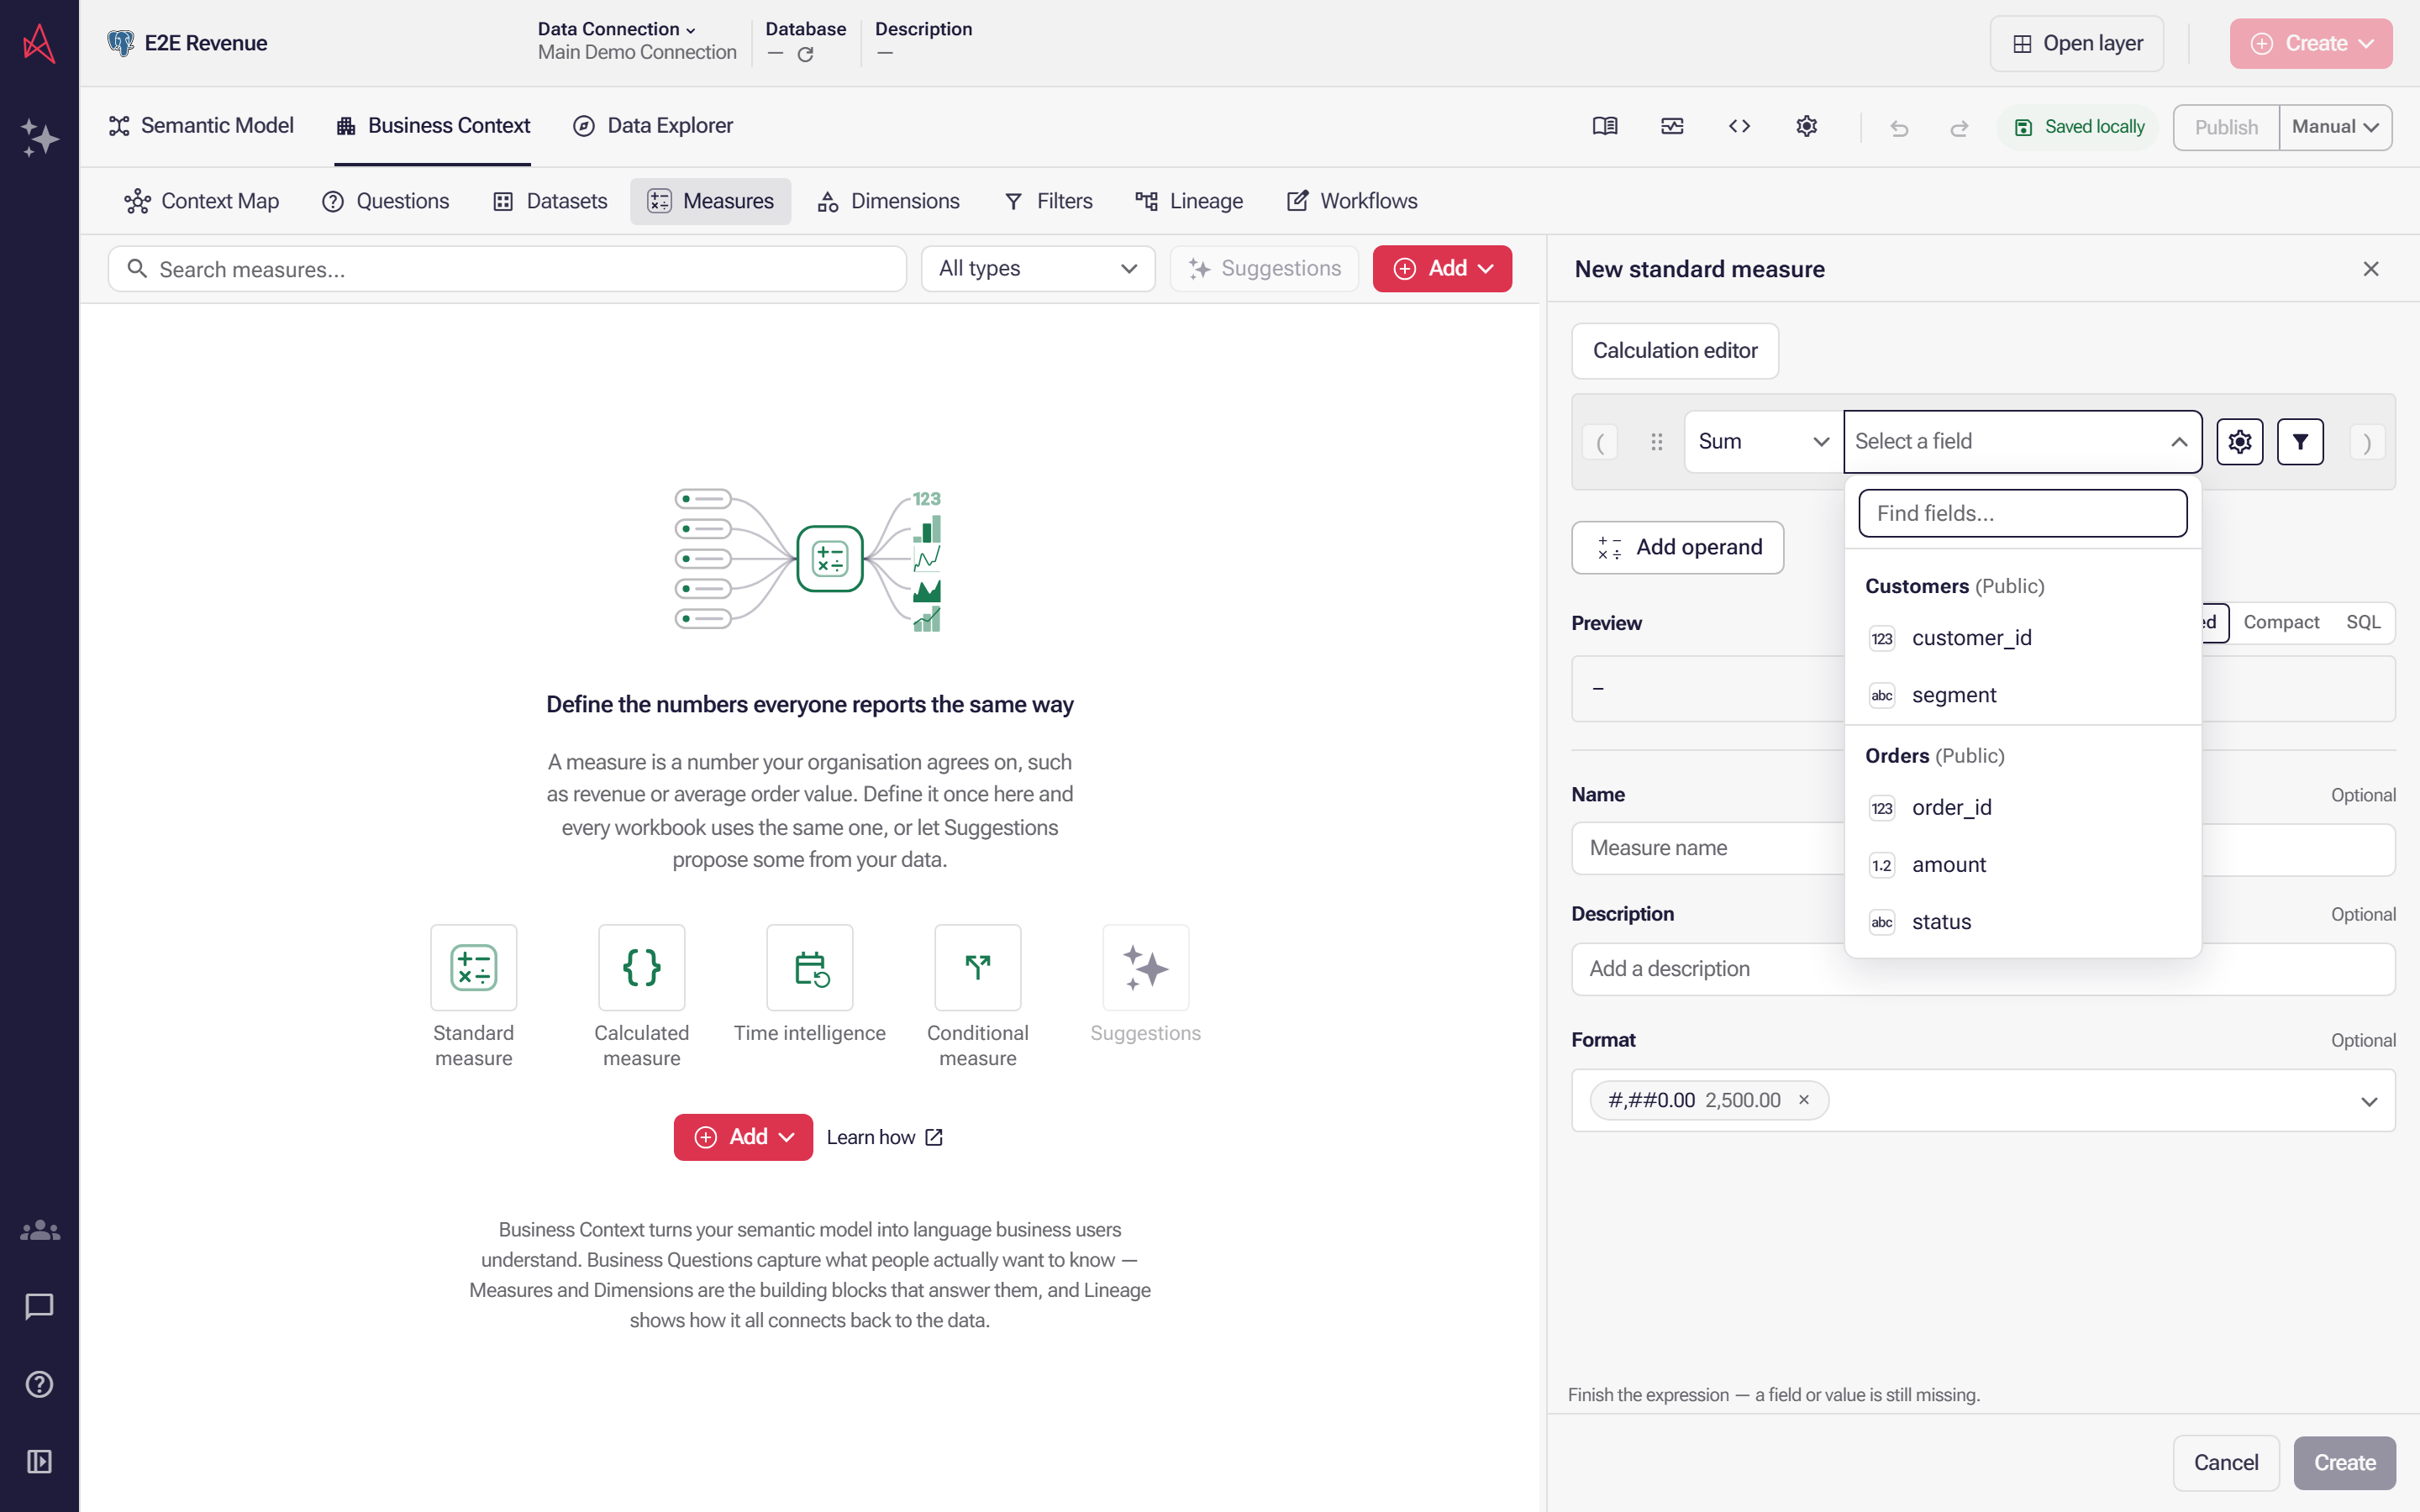
Pick the column to add up, such as amount. The picker lists every field you can aggregate, grouped by table, with a search box for a wide model.
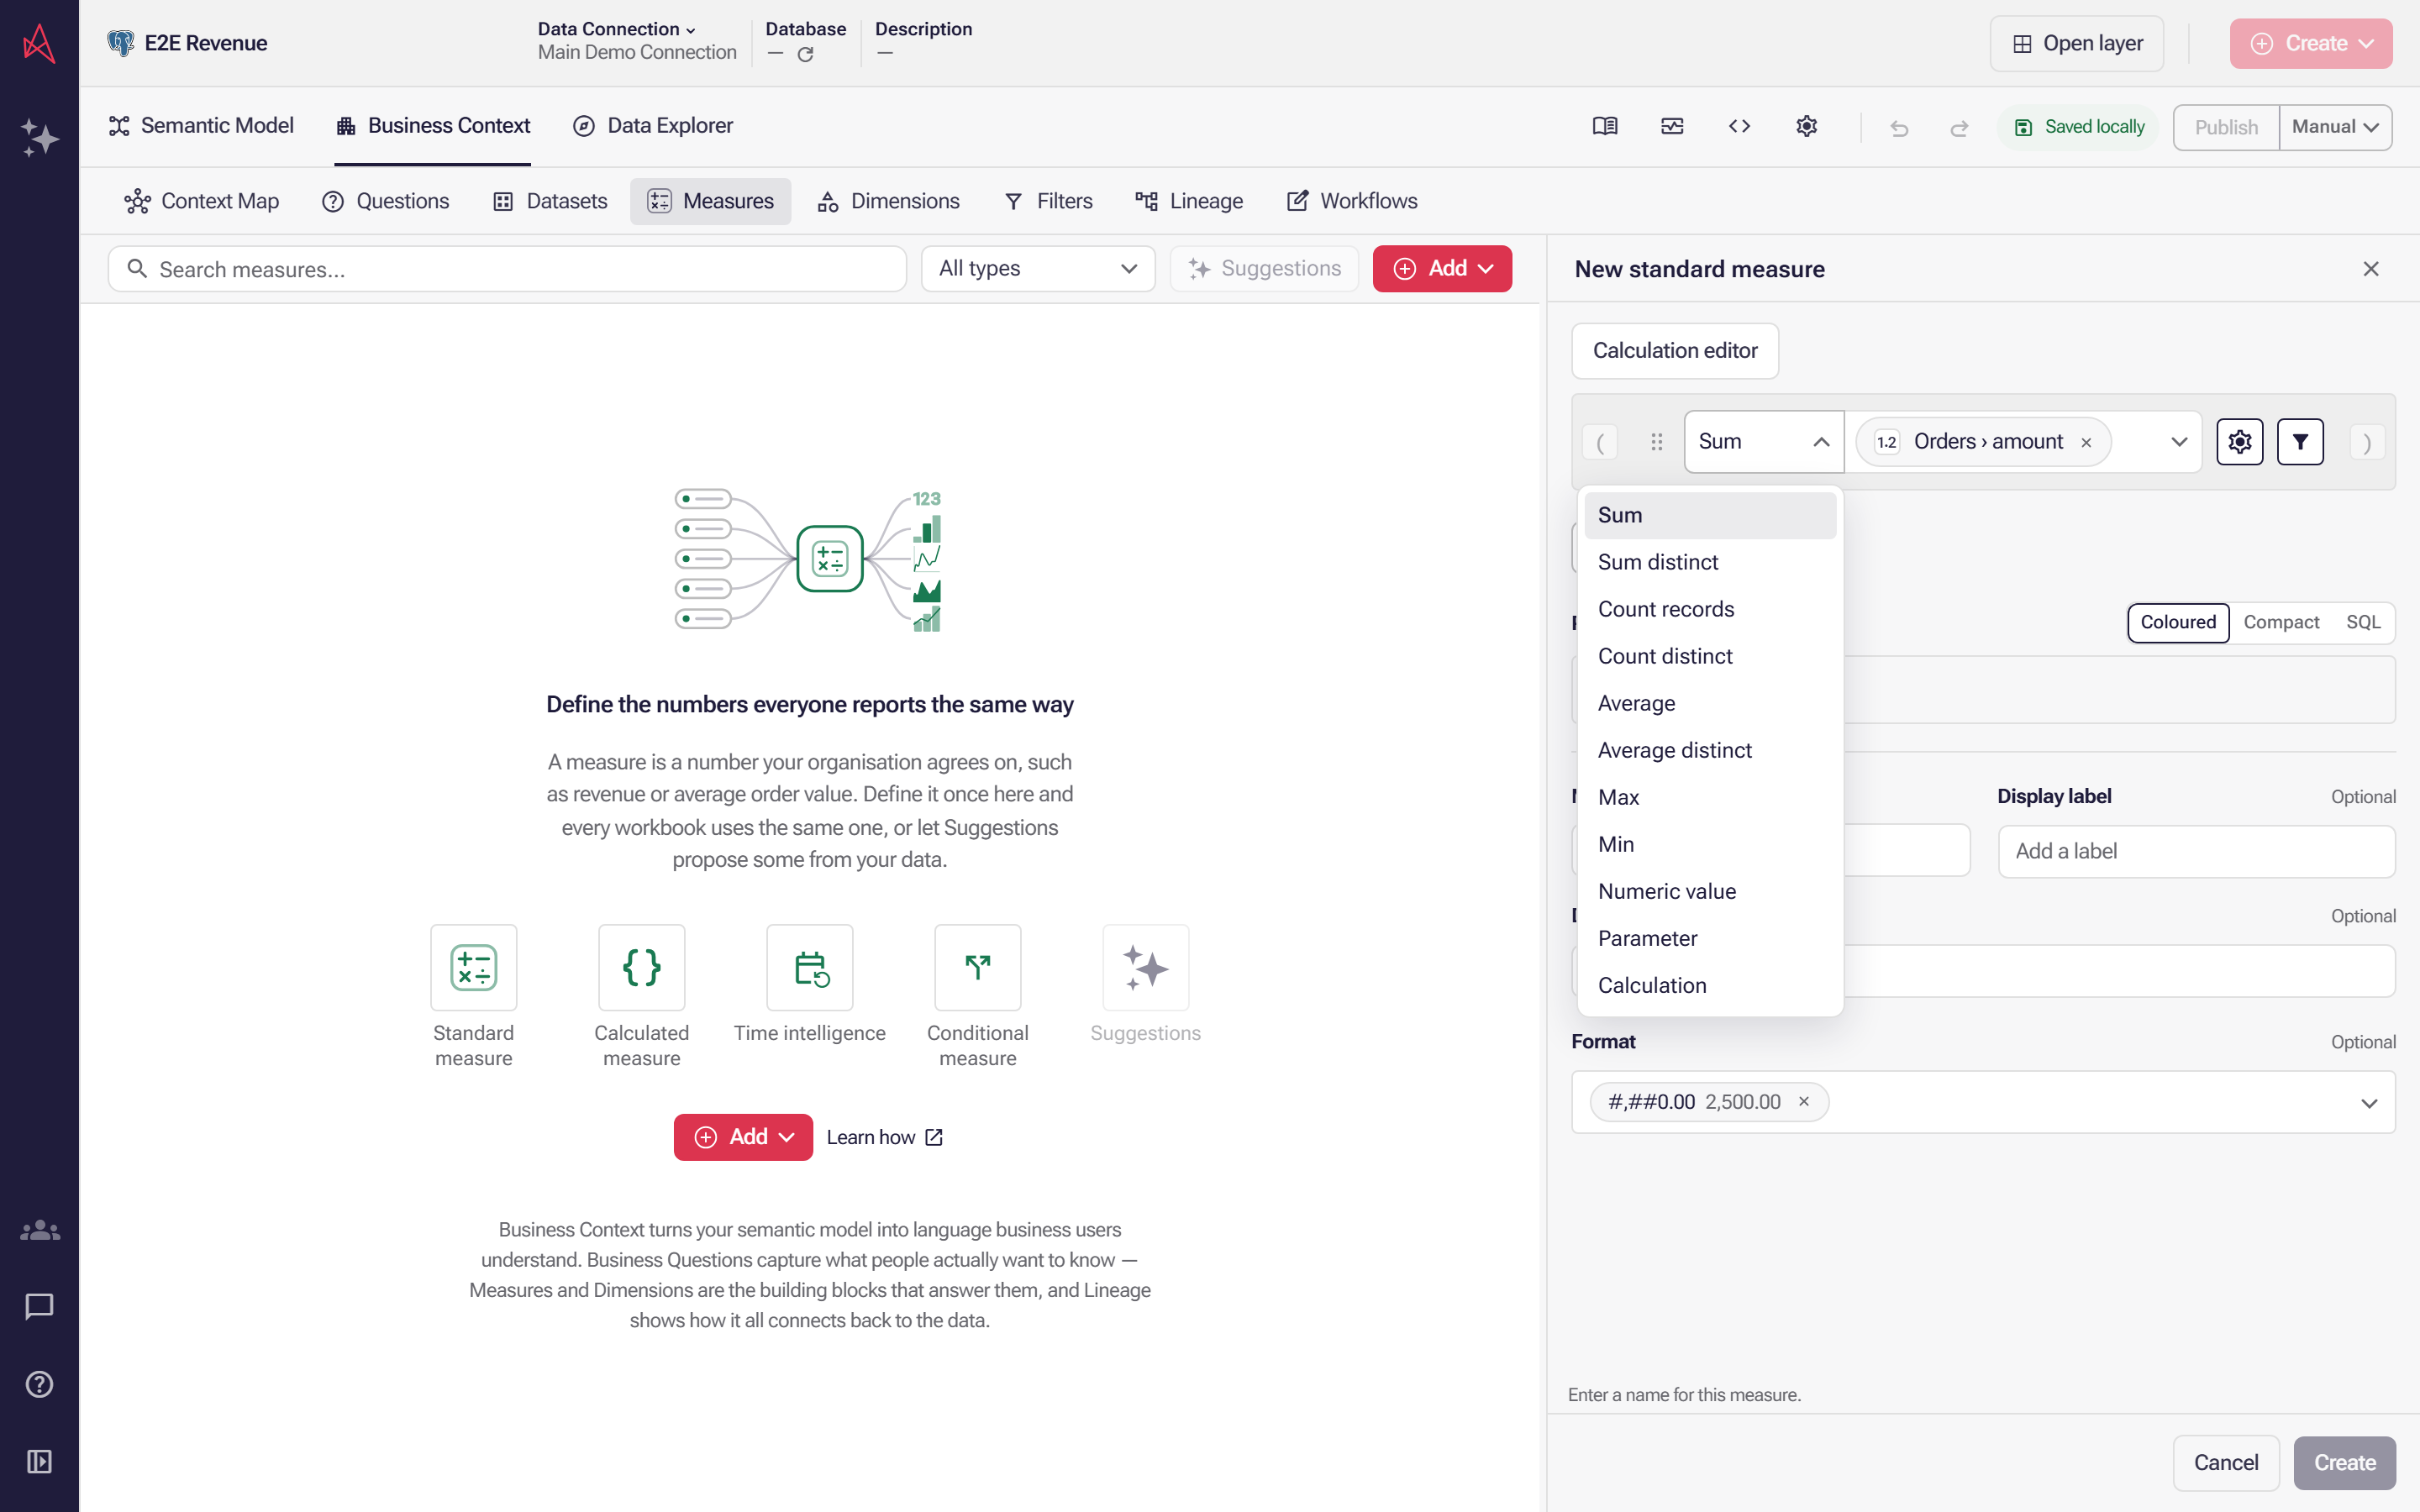
Check the aggregation, the picker to the left of the field. A standard measure starts on Sum, which is what total revenue needs. To count orders or take an average, choose Count records or Average instead.
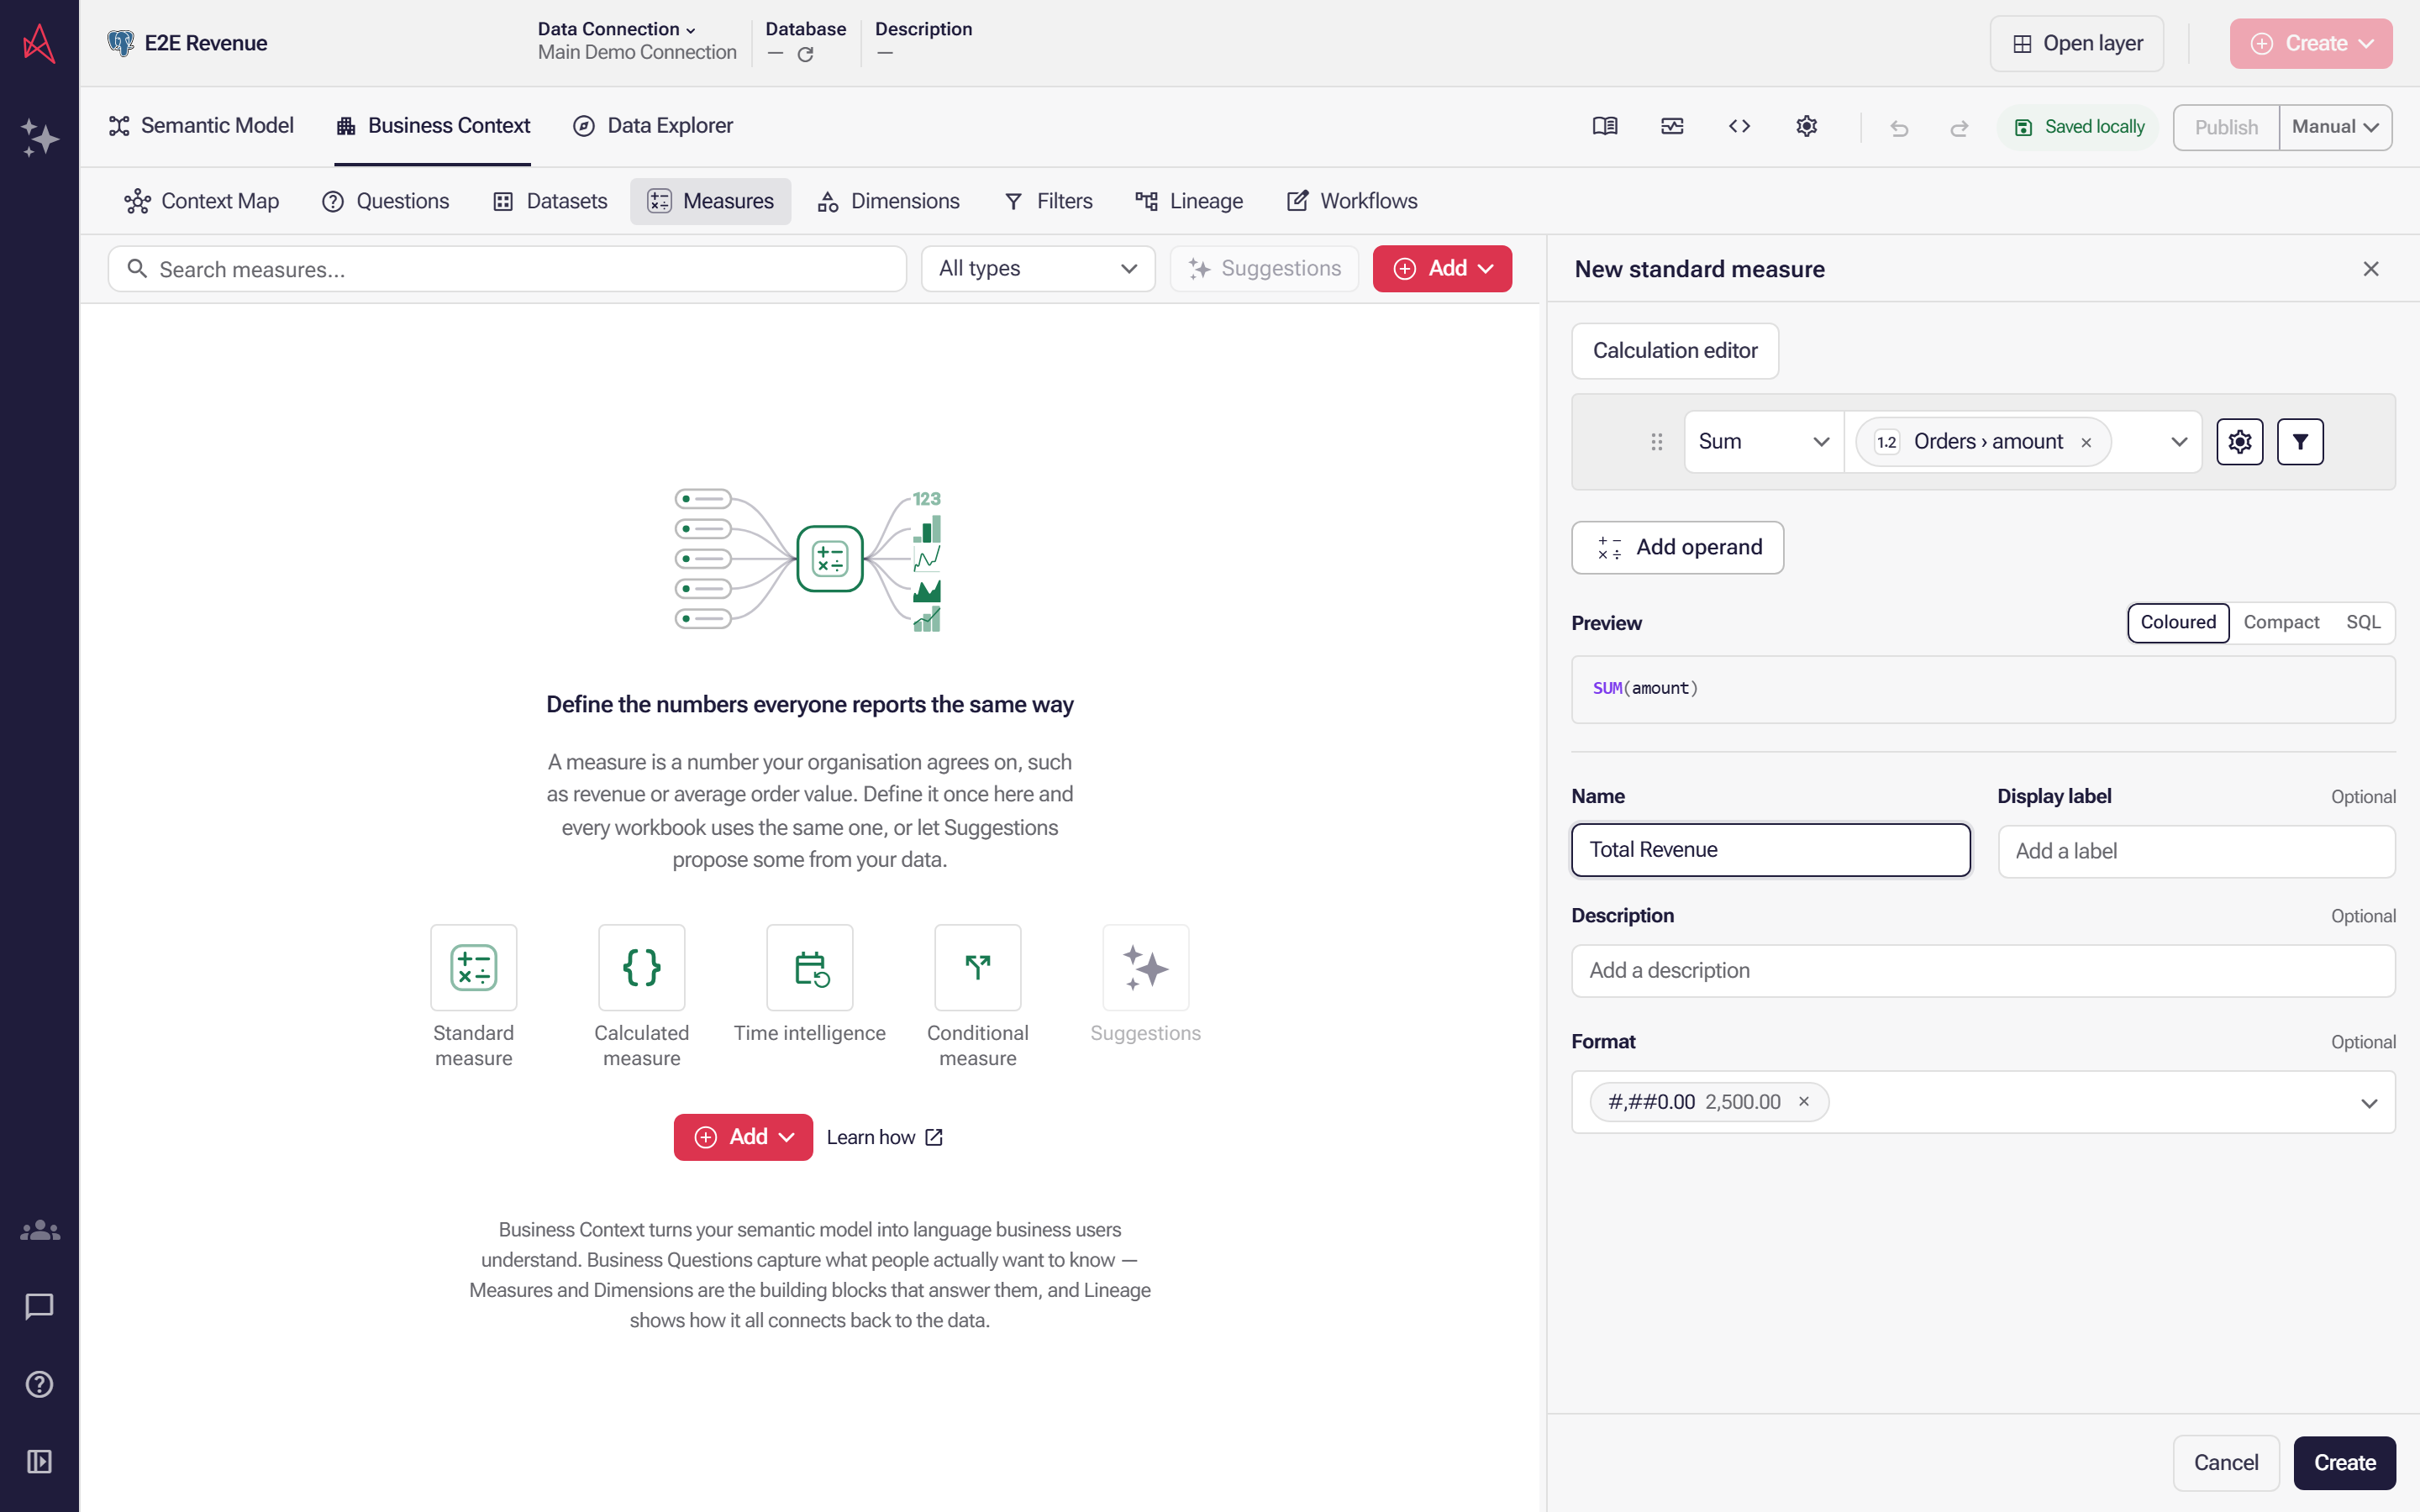
Enter the name people will look for, such as Total Revenue, because it is what they see in every list. Create is now available.
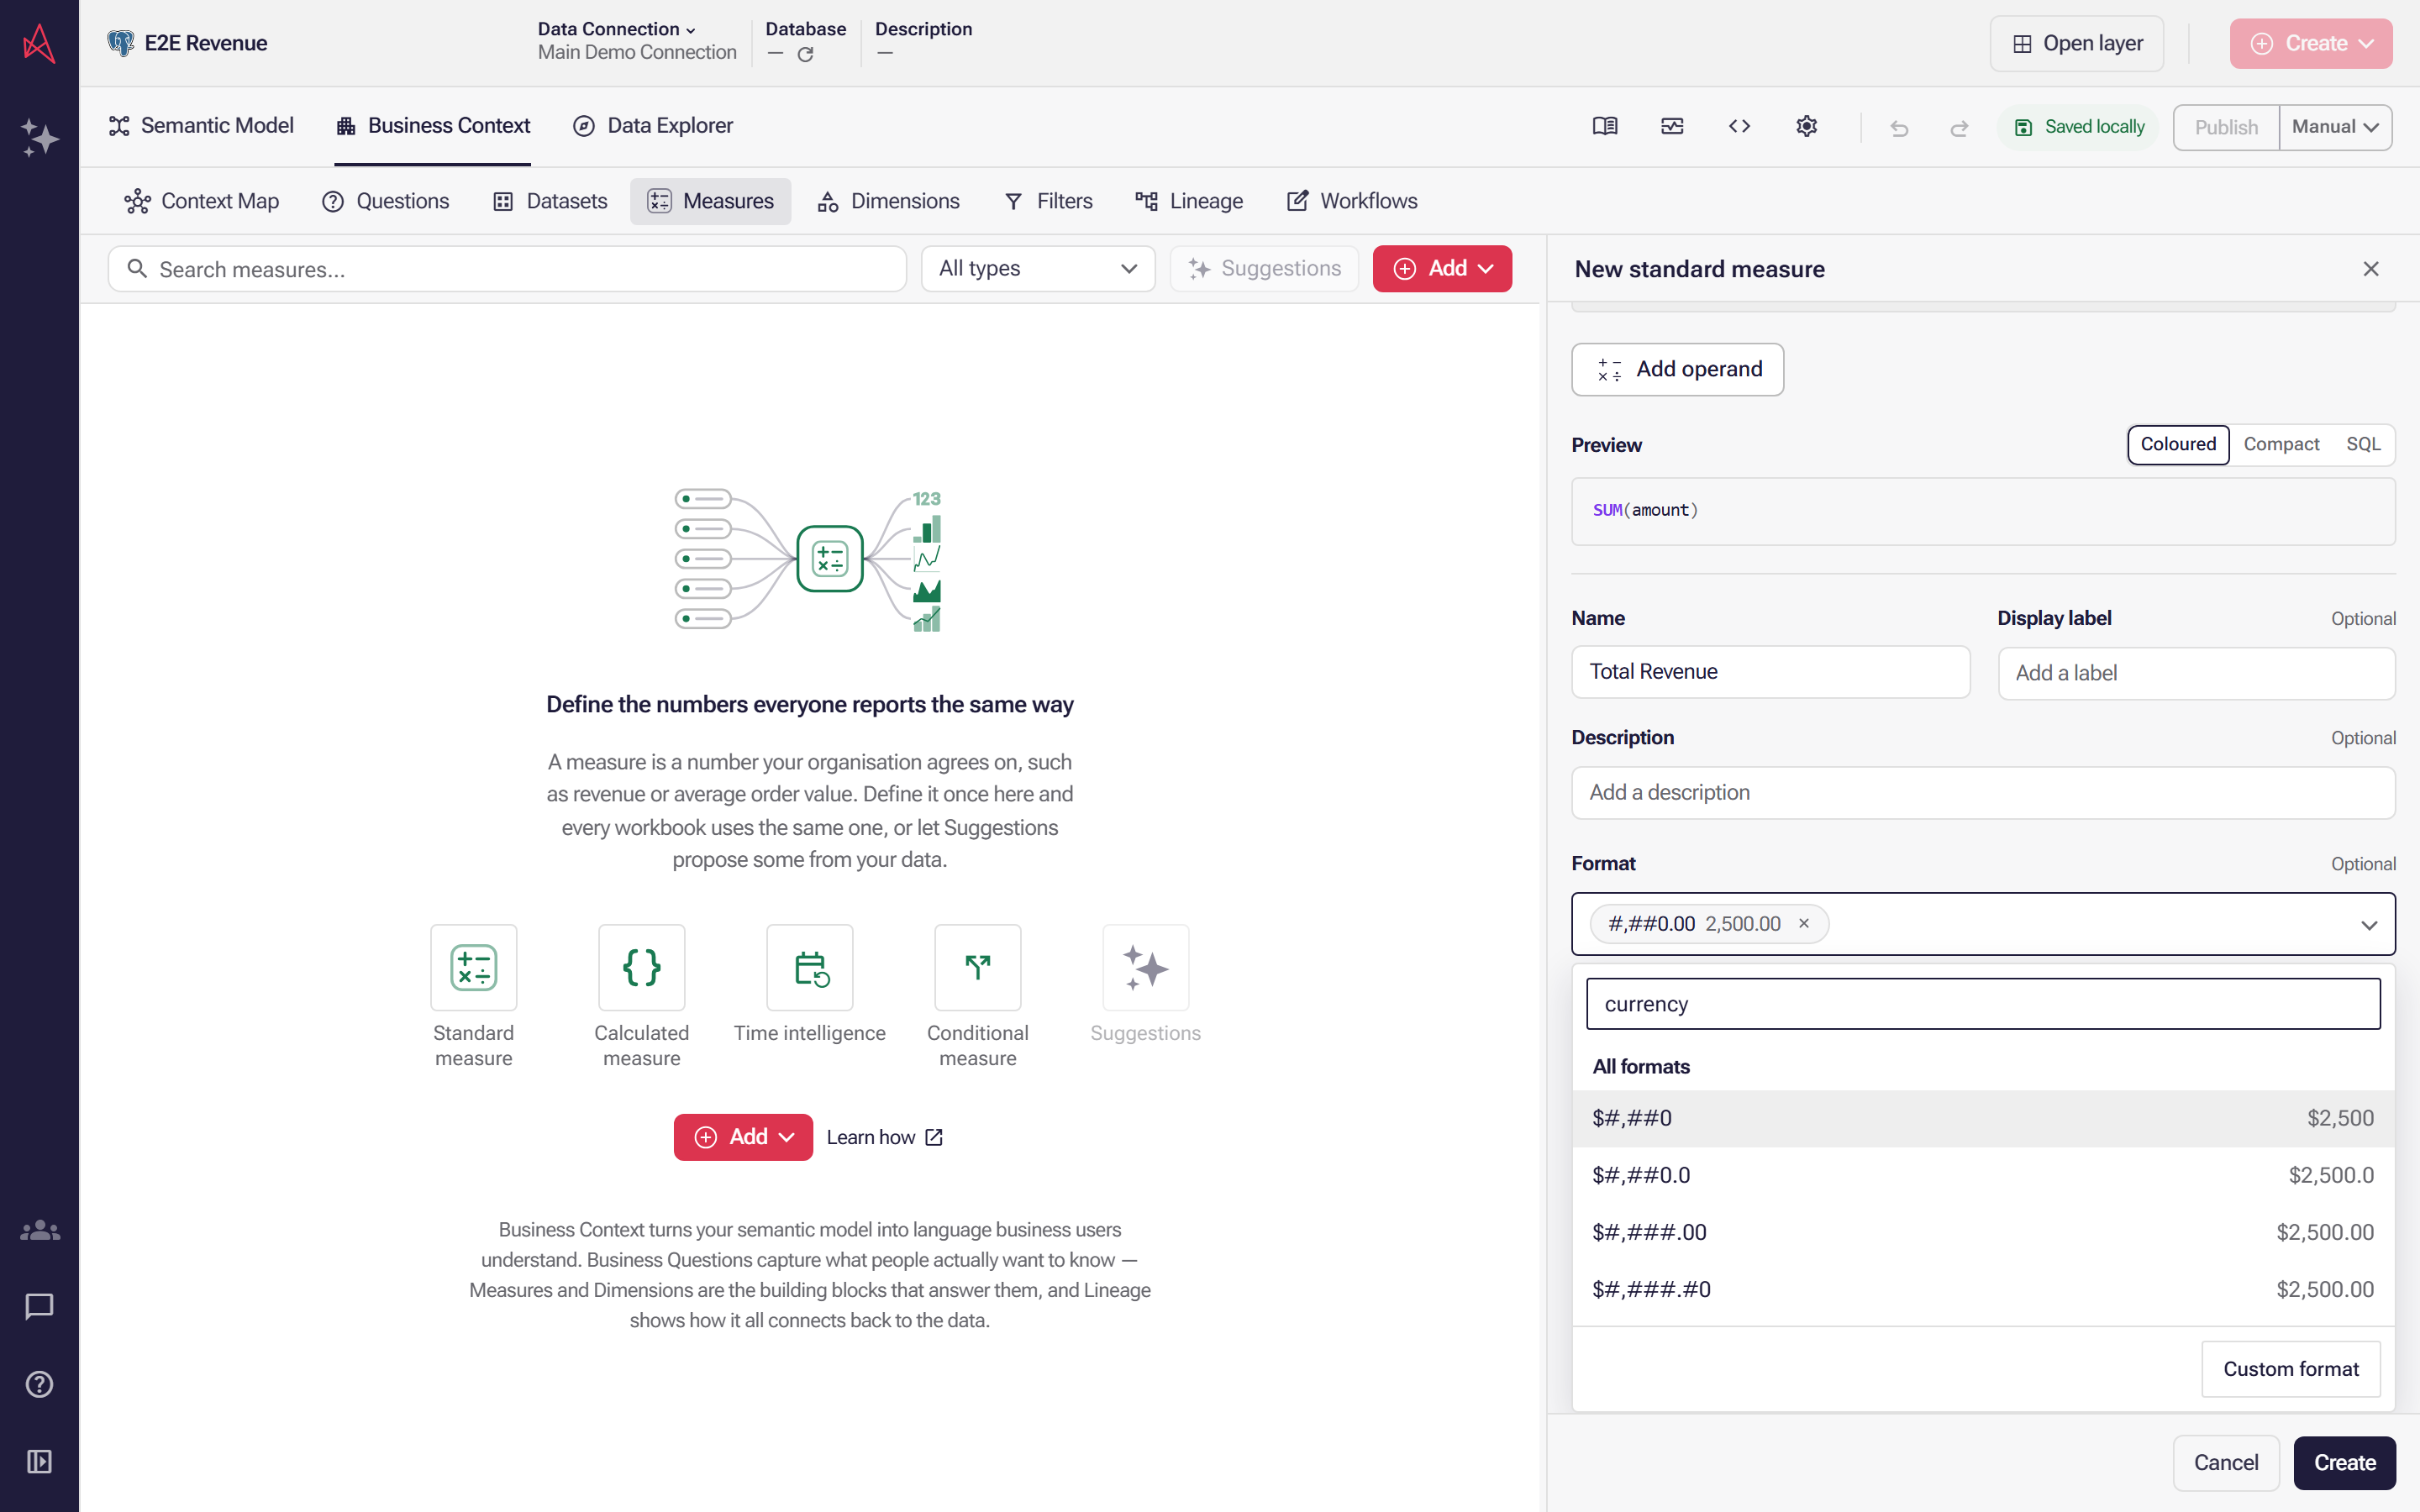
Format sets how the number is displayed, and starts on the semantic layer default pattern. Open it, type currency in Search for format, and pick a pattern by its sample, such as $#,##0 for $2,500.
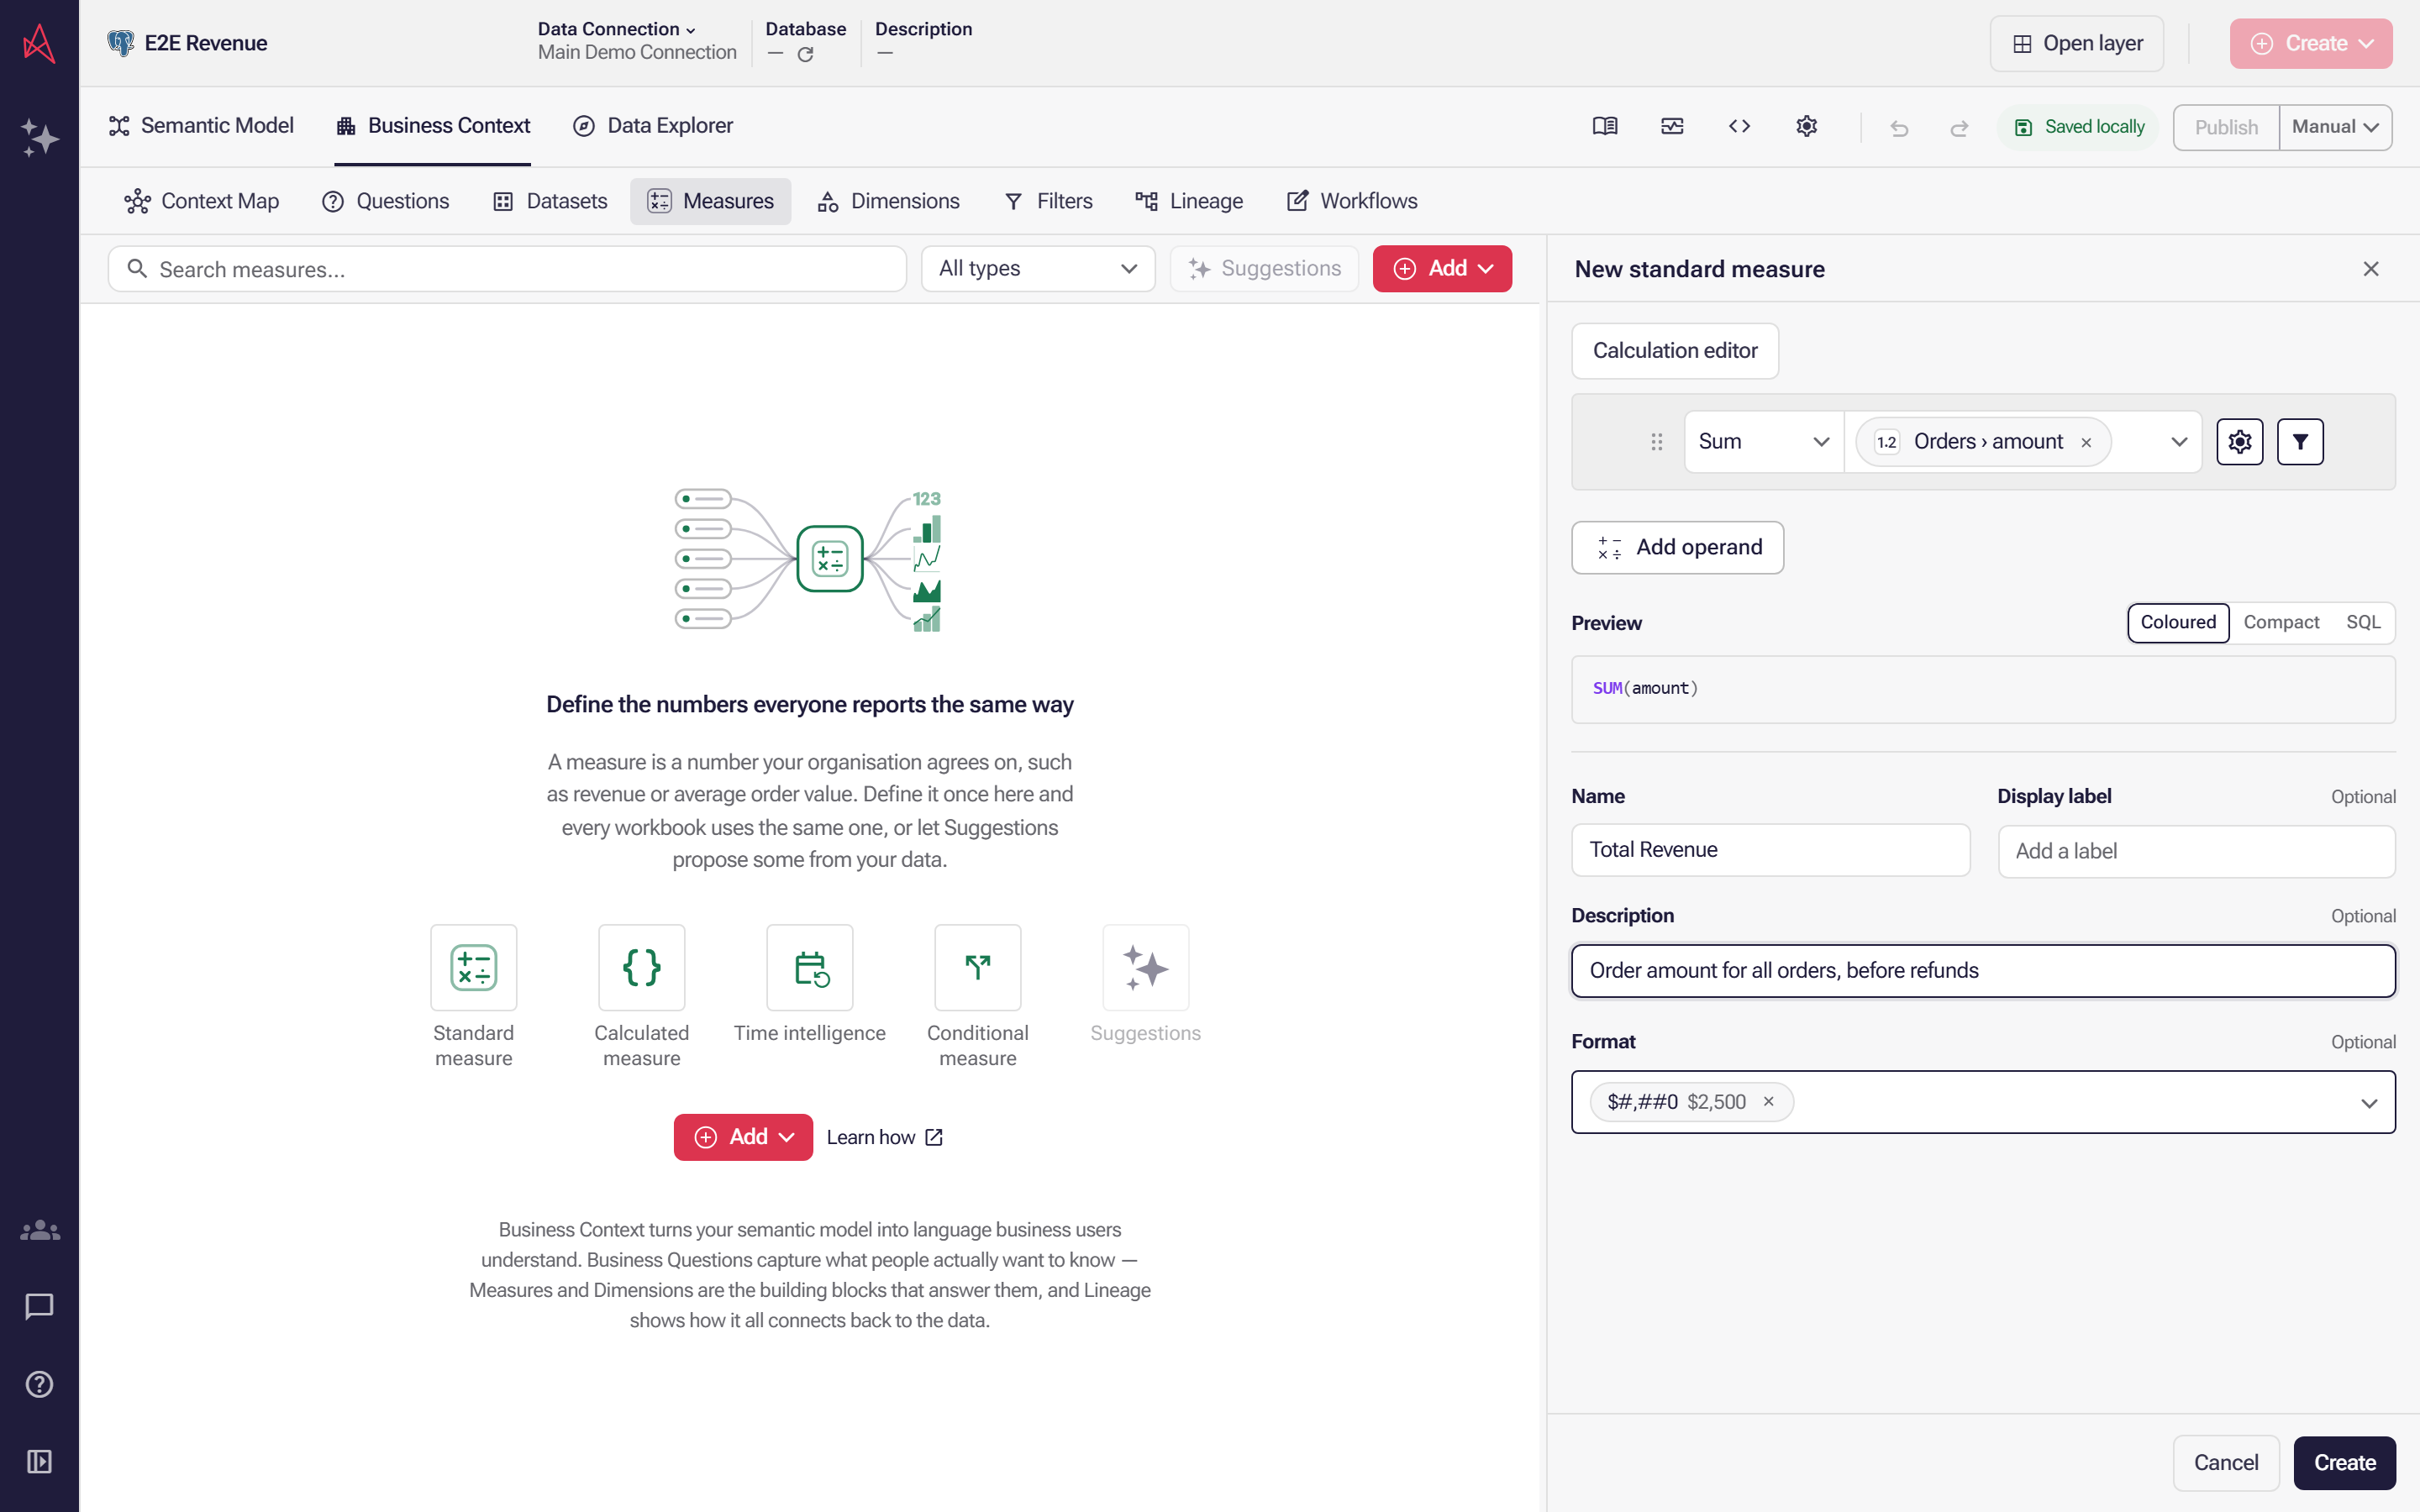
Optionally, add a Description that says what the number includes, such as which orders count. It tells people this is the number they want. Then select Create.
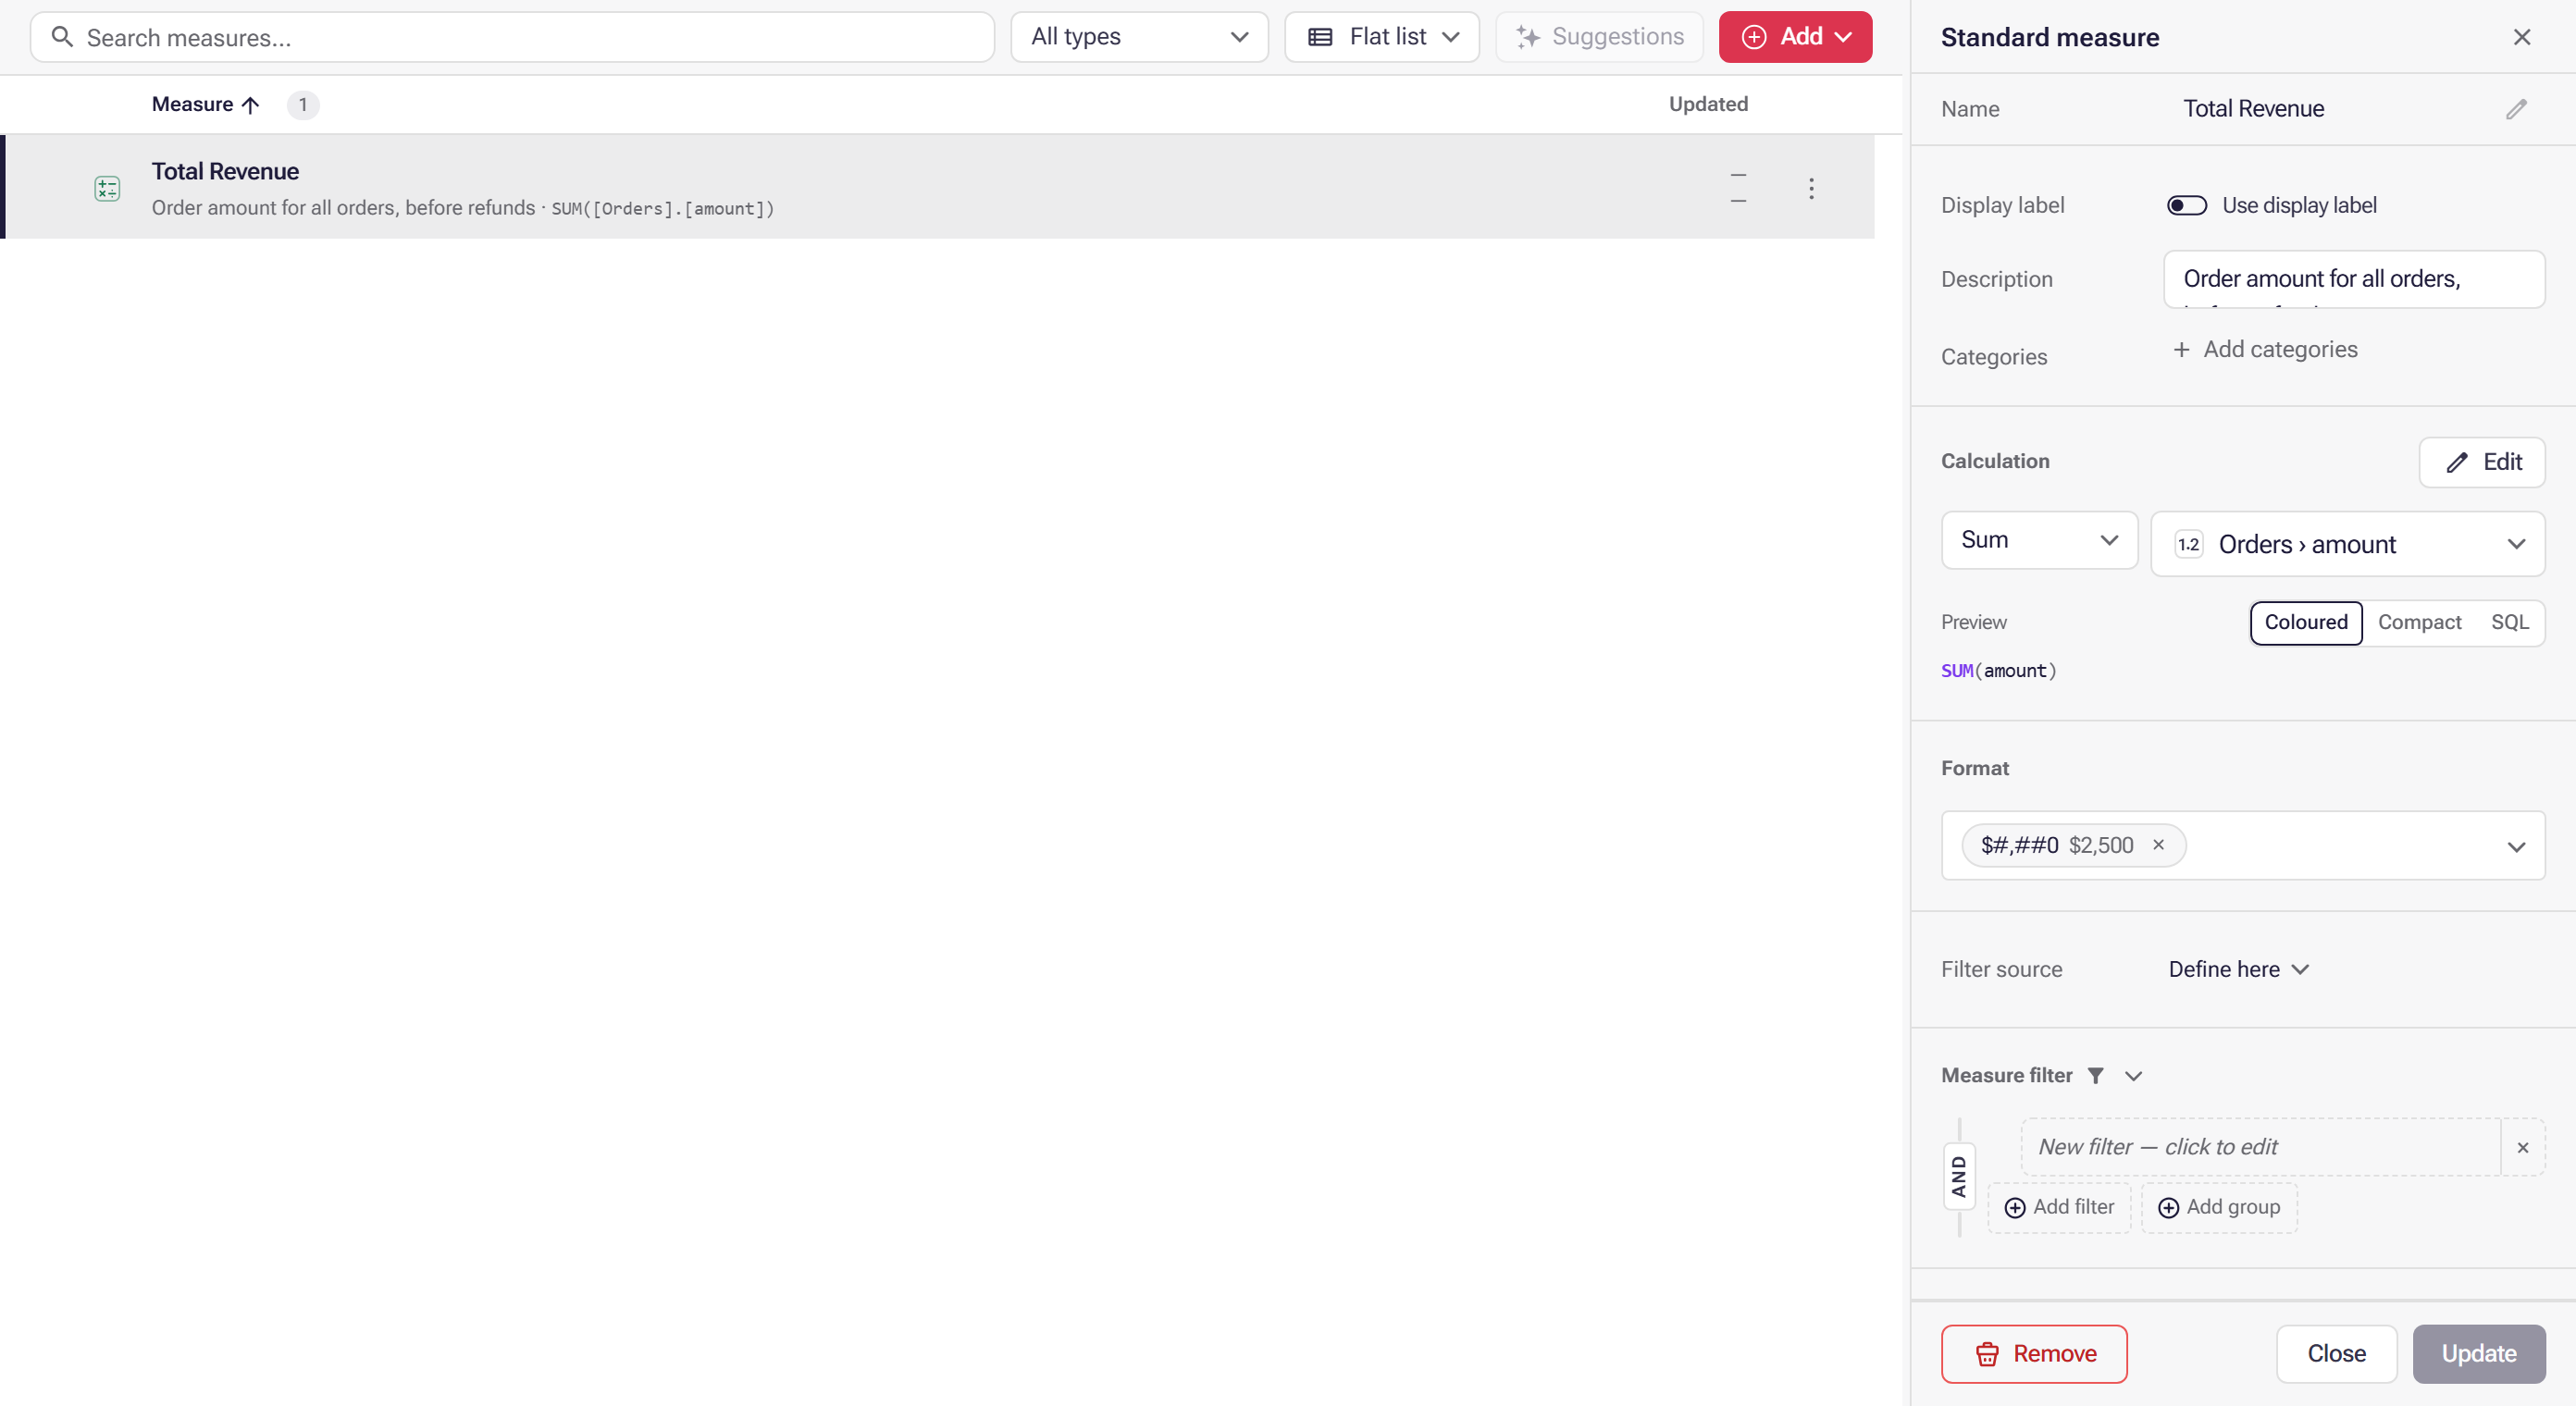
Total Revenue now sits in the Measures list with its description and formula underneath, and its panel shows Sum, amount and the $#,##0 format. It is saved to the draft; workbooks, Data Apps and Nash use it once you publish.
Four steps in the walkthrough need a decision from you:
- Search measures… first. Search ignores letter case and matches names, display labels,
descriptions and the fields a measure uses, so
revenuefinds Total Revenue and any measure over a revenue column. If the number is already defined, use that measure; a second definition is how two reports end up disagreeing. - Aggregation decides how the field is rolled up. It starts on Sum. Count records, Average, Max and Min are the other common choices, and what is listed depends on the connection and the field’s data type.
- Format decides how the number is displayed, as part of the measure’s definition. It starts
on the layer’s default number pattern. For money, type
currencyin Search for format and pick a pattern by its sample:$#,##0shows 2500 as $2,500. Typeeurofor#,##0" €". Custom format, at the foot of the list, takes a pattern of your own; see Format numbers and dates for your locale for the patterns it accepts. - Description is optional, and tells the next person what the number includes.
Result: Total Revenue appears in the Measures list with its description and formula underneath, and its panel stays open on the right with the aggregation, field and format you chose. The measure is now in the layer’s draft. Nobody else’s workbooks see it yet — that happens when you publish.
You can also start from a field you have already added in the editor’s Data Explorer; see Turn a field into a measure or dimension.
Create, Update, saved and published
Section titled “Create, Update, saved and published”The editor shows these on the way from your typing to everyone’s numbers. Only the last one reaches other people.
| You see | What it means |
|---|---|
| Create (new) or Update | Commits what is in the panel. Until you select it, nothing is saved; Cancel or Close throws the panel’s changes away. |
| Not updated yet | The panel has changes you have not committed with Update. |
| Saving draft…, then nothing | Your change is on its way to the shared draft, then saved. Anyone else who can edit this layer now sees it. |
| Saved locally | Shown instead for a layer held in this browser rather than in Astrato. The change is stored in this browser only. |
| Publish | Releases the draft. Only then do workbooks, Data Apps and Nash use the new or changed measure. |
See How versioning works in the semantic layer for the full picture.
Publish the measure so everyone gets it
Section titled “Publish the measure so everyone gets it”-
Select Publish in the editor toolbar, at its right-hand end after Versions.

-
If the layer still has its generated Untitled name, you are asked to name it first. Enter a name that does not begin with Untitled.
On Manual, the default publishing mode, nothing goes out until you select Publish. The dropdown beside it can switch to Delayed or Instant publishing.

Result: the button reads Publishing… while it runs. When it finishes, Publish turns grey because there is nothing left to publish, and hovering it reads Astrato is synchronized at revision followed by the revision number. Versions lists the publish as Published revision with the same number. The layer is live with your measure in it: every workbook and Data App built on this layer can now use Total Revenue, and they all get the same number because they all read the same definition.
If Publish is greyed out before you have published, hover over it: it says how many validation issues are holding it back.

Select Issues, fix the rows marked Blocks publishing, then publish. Your measure stays saved in the draft while you do. See Publish your changes, and Semantic layer issues for the issues list step by step.
Check that people can use it
Section titled “Check that people can use it”In the editor, query the measure in Data Explorer:
-
Select the Data Explorer tab, after Semantic Model and Business Context.
-
In the left sidebar, find Total Revenue under Measures, or type its name in Search…, and select it. The + at the end of its row (Add to selection) does the same.
-
To break the number down, select a dimension under Dimensions, such as a region or a month.
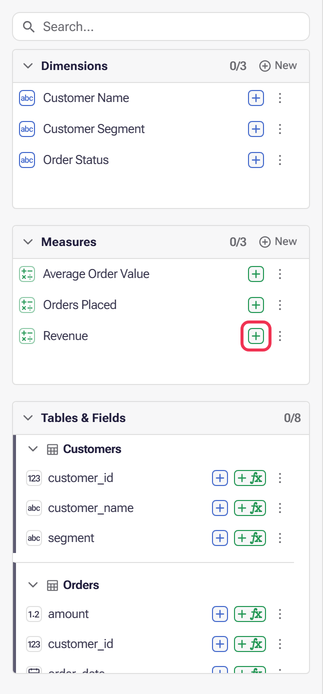
Result: the preview on the right shows the result. Beside the dataset name above it, a label says which version you are querying. Saved draft means Data Explorer is querying your saved draft, which happens where your connection supports it, so you can check the number before you publish. Published means it reads the published layer; until you publish, a measure added since the last publish is greyed out and the label counts the items that still need publishing.
Elsewhere, the measure shows up once the layer is published:
- In a Data App: the Data App preview uses published measures only. Build or open an app on this layer, as in Your first Data App, and ask for the measure by name.
- In Nash or an AI assistant: these read the published layer too. Ask for “total revenue by month” and check the answer uses your measure.
If something goes wrong
Section titled “If something goes wrong”-
The field you want is not in the picker. The picker lists only fields of tables in this layer. Add the table on the Map tab with Add → Tables & Views, then try again. If you typed in the picker’s search box, it says No fields match when nothing in the layer matches.
-
The aggregation you want is missing. What the picker offers depends on the connection and on the field’s data type. Check the field’s data type in Semantic Model → Tables & Fields.
-
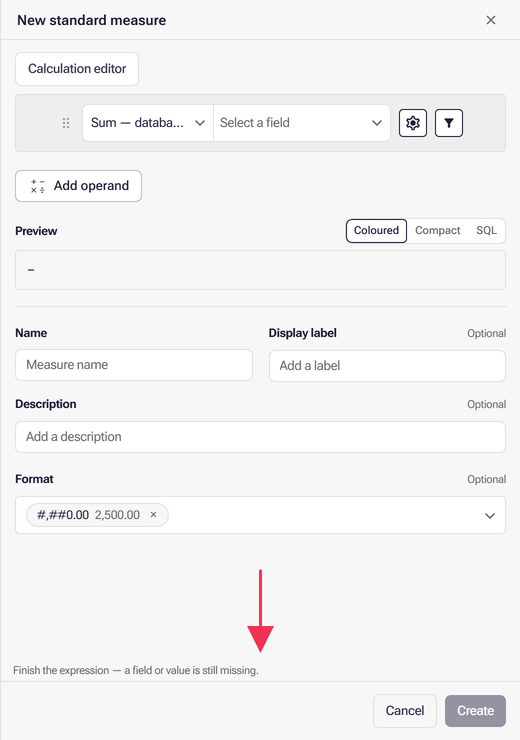
Create stays unavailable. The panel says why, just above its buttons, and hovering Create repeats it. Finish the expression — a field or value is still missing. means no field is picked yet. Enter a name for this measure. means the name is empty.
-
The name is taken. The panel shows A measure named “Total Revenue” already exists. Choose a different name. Names are compared ignoring letter case and spaces at either end, so
total revenueclashes too. Search the list for the existing one first: if it is the number you want, use it rather than adding a second definition.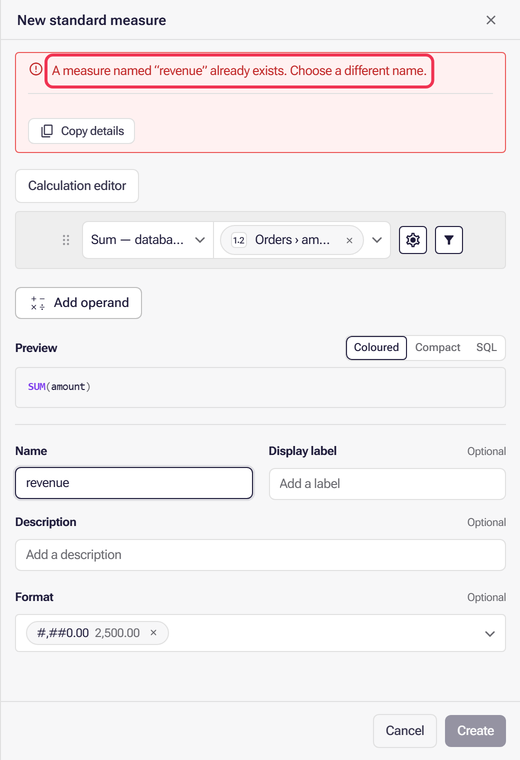
-
Other people still see the old number. You have not published yet, or the publish was refused. Check Publish as described above.
What next
Section titled “What next”- Publish your changes — publishing modes, and clearing the issues that hold a publish back.
- Create a dimension — the ways people break your measure down, such as month or region.
- Get suggestions from your data — let Astrato propose measures and dimensions to start from.
- Your first Data App — build an app on the published layer and see the measure in use.
More about measures
Section titled “More about measures”Reference for the Measures list and the measure editor, for when you come back to change a measure or need a kind other than a standard one.
Find a measure in the list
Section titled “Find a measure in the list”Every measure shows its name with the formula underneath, so you can see what it does without opening it.

The toolbar above narrows things down when the list gets long.
Search matches names and display labels, descriptions, categories, and the fields and filter values a measure uses. The type filter shows one kind at a time.
The filter offers three kinds and the editor makes four. A time intelligence measure has no option here, and no heading under Group by type either. Those measures are in the list all the same — find one by name, or by the period comparison on the measure itself.
The view picker beside the type filter switches between Flat list and Group by type. Grouping splits the list into sections with a count on each, which is the quickest way to see the shape of a large model.

What you can do with a measure
Section titled “What you can do with a measure”The ⋮ menu at the end of each row:
- Edit — open it
- Duplicate — start a new measure from this one, which is usually faster than building a variant from scratch
- Show on map — the same as the row’s map glyph: jump to the Map with this measure’s table in view
- Show in lineage — jump to the graph with this measure in view
- Remove — take it out of the semantic layer. It sits last, below a divider, so it is never the item you land on by accident.
To remove several at once, tick their rows. The list’s column header then shows how many are selected, with Remove and a button to clear the selection.
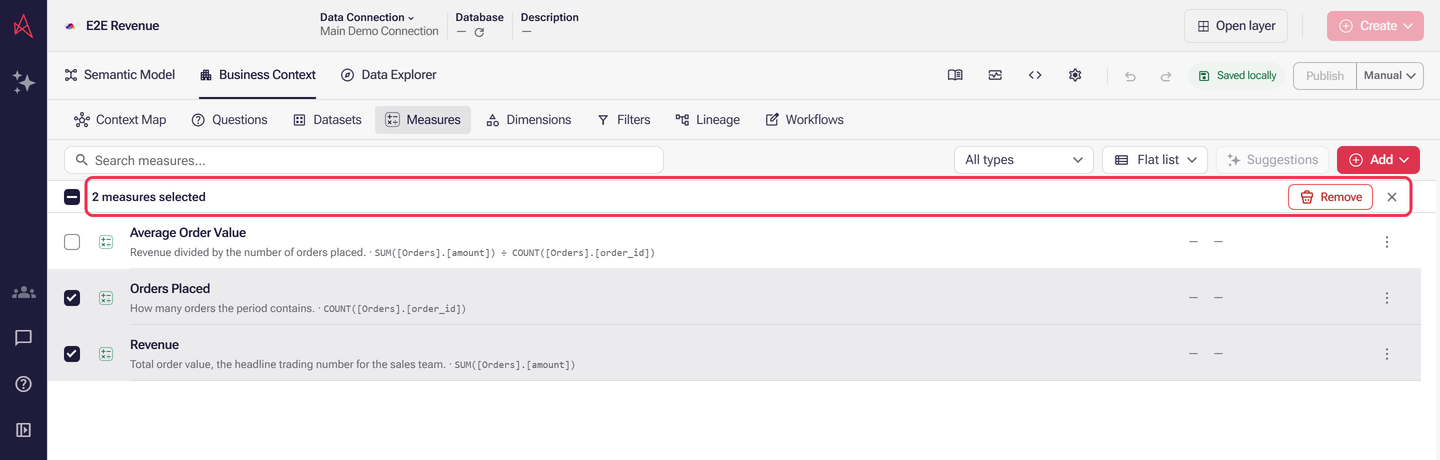
Duplicate adds a copy of the measure and opens it. Give it a unique name, adjust its properties, then select Update to save your changes. Your chosen name is kept when you edit other properties. Close or Cancel leaves the copy as it was created, and the original measure unchanged.
Careful with Remove. Any workbook using that measure will lose it. Check Show in lineage first if you’re unsure what depends on it.
Choose the kind of measure
Section titled “Choose the kind of measure”A standard measure covers most numbers. Add offers three more for the cases it does not.
Time intelligence measures appear in this menu only where period comparisons are enabled for your workspace. The four kinds are not four different things you build in four different places — they are four shapes the same measure editor produces, and the one you pick decides which parts of it you get. The sections below take them in turn.
Standard measure
Section titled “Standard measure”One aggregate function over one field: total revenue, order count, average basket. Pick it whenever the number is a column added up some way, which is most numbers.
The Aggregation picker leads with the handful people reach for — Sum, Count records, Average, Max, Min, Any value — and keeps the rest under Other: Approx count distinct, Median, Mode, Standard deviation, Value list, Variance. What the picker offers depends on the connection and on the field’s data type, so a list that is shorter than this one is the data source talking, not a fault.
Where an aggregation supports it, the picker also carries a distinct variant — Count distinct, and <aggregation> distinct for the others.
Two entries in that picker are not aggregations at all. Value makes the operand a fixed number, and Parameter makes it a parameter you name and give a default. Both are there so a measure can be built from something other than a column.
A Measure filter narrows the rows the aggregation sees, without touching anything else on the page. Revenue from returning customers only is a standard measure with a filter, not a conditional one. The filter becomes a CASE WHEN inside the aggregation; see A measure filter.
Value list separators
Section titled “Value list separators”Value list and Value list distinct join the field’s values into one piece of text, where the connection offers them. Choosing either adds a Separator picker beneath the aggregation, with a sample of the result beside it:
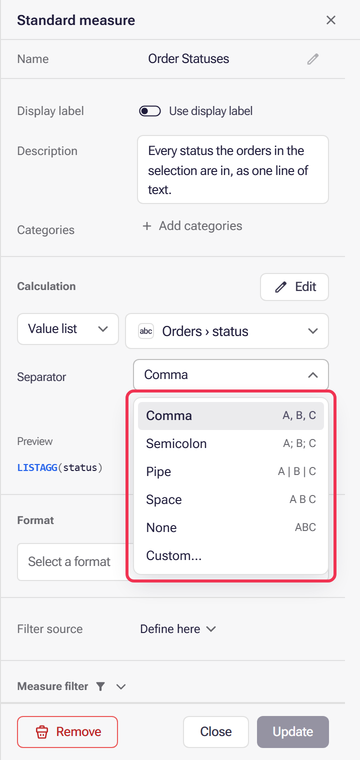
| Separator | Joins values as |
|---|---|
| Comma | Alpha, Beta, Gamma — the default |
| Semicolon | Alpha; Beta; Gamma |
| Pipe | Alpha | Beta | Gamma |
| Space | Alpha Beta Gamma |
| None | AlphaBetaGamma |
| Custom… | Whatever you type in Custom separator |
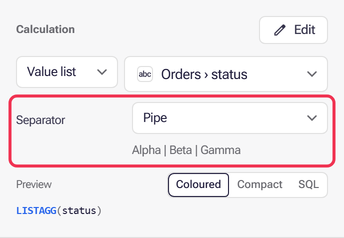
A custom separator is kept exactly as typed, spaces included. A stored separator that matches no preset exactly, such as a pipe with no spaces around it, is shown as Custom… rather than changed to the nearest preset. In a formula with several aggregations, each list aggregation has its own Separator, set in the formula editor. Nash and other MCP clients set the same option as delimiter: an empty string for none, null to go back to the default.
Aggregations in Snowflake SQL
Section titled “Aggregations in Snowflake SQL”On a Snowflake connection, each aggregation runs as the Snowflake function in this table. A distinct variant adds DISTINCT inside it, so Count distinct runs COUNT(DISTINCT …).
| Aggregation | Snowflake function | Field types | Distinct variant |
|---|---|---|---|
| Any value | ANY_VALUE |
Any | — |
| Approx count distinct | APPROX_COUNT_DISTINCT |
Any | — |
| Average | AVG |
Numeric | — |
| Count records | COUNT |
Any | Count distinct |
| Max | MAX |
Any | — |
| Median | MEDIAN |
Numeric | — |
| Min | MIN |
Any | — |
| Mode | MODE |
Any | — |
| Standard deviation | STDDEV |
Numeric | — |
| Sum | SUM |
Numeric | Sum distinct |
| Value list | LISTAGG |
Any | Value list distinct |
| Variance | VARIANCE |
Numeric | — |
| ST_UNION_AGG | ST_UNION_AGG |
Geography | — |
Snowflake’s aggregate function reference says how each function treats nulls; STDDEV and VARIANCE are the sample forms, and APPROX_COUNT_DISTINCT is an estimate. Other connections offer their own list, which is why the picker can be shorter or longer than this one.
Calculated measure
Section titled “Calculated measure”A formula over measures you already have: margin from revenue and cost, average order value from revenue and orders. Pick it when the number is arithmetic on other agreed numbers, because then each part stays defined in one place.
Its operand picker offers Measure, Numeric value and Parameter — and no aggregation functions, because the operands are measures, which have already been aggregated.
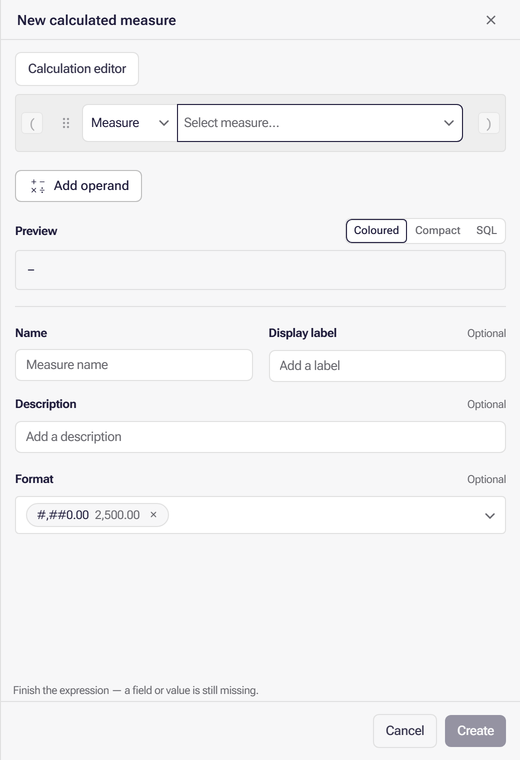
Each Measure operand can also be worked out at a finer grain before the formula combines it. Select the Nested calculation icon (a sigma, Σ) in the operand’s row. Under the row, choose a reduction in Then take (Sum, Average, Minimum, Maximum, Percentile or Function) and tick one or more fields in Per field. The picker lists the fields reachable through joins from the measure’s own tables, not only those that have a dimension, and stays open while you tick. With a customer ID field and Average, for example, Revenue becomes revenue per customer, averaged for each row of the answer, while the other operands are left as they are. Ticking customer ID and order date instead works revenue out per customer per day before averaging. Select Clear to remove it. The setting appears only where Business Questions are enabled. Percentile and Function are offered only here, on a measure in the formula, per a grain (Σ); a measure’s or calculation’s own reduction keeps Sum, Average, Minimum and Maximum.
Percentile takes a value from 0 to 100, so 95 gives the 95th percentile, a method (Continuous interpolates between values, Discrete returns one of them) and an optional Approximate. A percentile takes numbers only, so for a measure that is not a number, such as a date, Percentile is disabled; use Minimum or Maximum instead. Function offers your scalar functions that take exactly one measure array parameter, which receives the values per field, and only scalar parameters besides it; with none, it is disabled and says so. Each scalar parameter gets a box, and one you leave empty uses its default, shown as the placeholder; a parameter without a default needs a value or Set to NULL. Set to NULL passes NULL instead, shown as a NULL chip; remove the chip to use the default again. Percentile and Function reduce an ordinary grain only: not a Time Axis, and not on a time intelligence measure. A business question can set a grain on one selection instead, by dimension, with Sum, Average, Minimum or Maximum.
A median (Percentile 50) or 90th percentile per customer, order or product is worth adding where a few large ones lift the average far above a typical one: show the median beside the average, and the 90th percentile beside the median. Where values are evenly spread, or a group has fewer than about 20 members, it adds little to the average.
The measure and conditional measure builders have no switch to the formula editor. A measure with its own reduction, such as an average per City, or a conditional measure that embeds a calculation, opens in the formula form instead, so it stays editable: change it in the Formula field of the Calculation section. A time intelligence measure, or one whose reduction is over a Time Axis, keeps its own editor instead.
This is also where a measure lands when it cannot be read as anything else: a measure the editor cannot parse is shown as calculated. If one you expected to be standard is listed as calculated, its formula is what to look at.
Time intelligence measure
Section titled “Time intelligence measure”The kind that reports a number against time: this quarter beside last, a year-to-date running total, a twelve-month moving average. It carries a period comparison, a time intelligence axis, or an accumulation — and it is the only kind that does.
Two capabilities have to be on. Creating one needs period comparisons enabled for your workspace, which is what puts the entry in the menu. The settings themselves need Business Questions enabled; without it the section is simply absent, with nothing to say why. Measures already built keep working and stay editable whatever the first setting says.
Both are switched on by Astrato, not in your workspace. Neither appears in Administration, so an administrator in your workspace cannot turn them on there. If the menu entry or the section is missing and you need it, ask your Astrato contact.
Read Period axes and comparisons for what the comparison windows mean and how the axis is shared between measures.
Compare a ratio across periods
Section titled “Compare a ratio across periods”A time intelligence measure can compare a ratio, such as average order value: total sales divided by the number of distinct orders. Create a Time intelligence axis dimension first, then create the measure as a time intelligence measure and choose that axis under Time axis in its Time intelligence section. Each period works out its own numerator and denominator and then divides, so the result is never an average of row-by-row ratios.
The ratio is worked out at the level you ask for. With a daily axis, each row compares one day’s values. With no axis in view, a KPI works the formula out over the whole selected period: a customer who appears on several days counts once in that period’s distinct count, and daily ratios are never added together. Growth is (current − previous) ÷ |previous|; give the measure a percentage format to show it as a percentage.
- A ratio can combine other measures, as long as each of them is itself an aggregate. Measures over unaggregated fields, conditional measures, and measures that carry their own comparison or have parameters cannot be compared this way.
- A whole-period comparison with no axis in view cannot use a time intelligence axis whose range starts or ends at the earliest or latest date in the data.
- Standard, calculated and conditional measures have no Time intelligence section. A comparison one of them already holds is kept when you save it, but cannot be edited there.
To add up, or otherwise combine, values worked out per period rather than compare two periods, see Period axes and comparisons.
Conditional measure
Section titled “Conditional measure”A measure that behaves differently in different cases: one commission rate below a threshold and another above it, revenue counted one way for one region and another way elsewhere. It is an if with a test, a value when the test holds, and a value when it does not — and it opens in its own builder rather than the aggregation row.
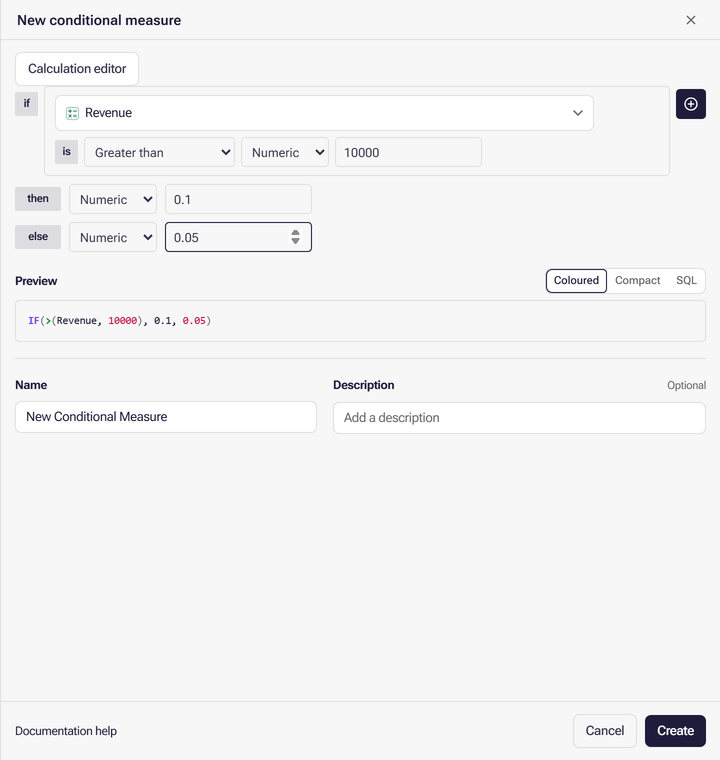
Reach for it only when the number genuinely changes shape. A measure that merely ignores some rows is a standard measure with a Measure filter, and that is both easier to read and easier for someone else to check.
What a measure holds
Section titled “What a measure holds”Opening one shows everything that defines it.
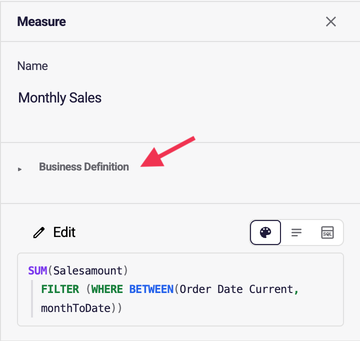
Business Definition
Section titled “Business Definition”This is the part that makes it business context rather than just a formula.
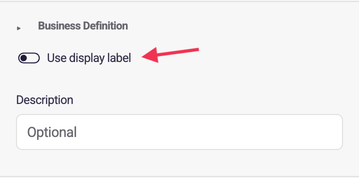
Display label is the first row under the name. Its Use display label switch lets you show a different name to the people reading reports. Switch it on and a field appears for the label you want them to see — handy when the internal name is technical, abbreviated, or simply not what the business calls it. The label replaces the measure’s name in the Measures list, the Data Explorer and chart headers. Search still matches the name.
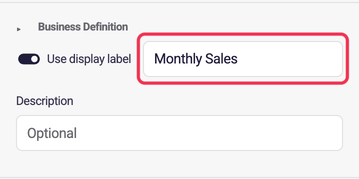
Description is where you write what the measure actually means. It’s optional, and it’s the single most useful thing you can add — it’s what tells someone whether this is the number they want before they build a chart on it.
Tip: write the description for the person who didn’t build the model. “Sales in the current month to date, excluding refunds” saves far more time than it takes to type.
How the measure is calculated
Section titled “How the measure is calculated”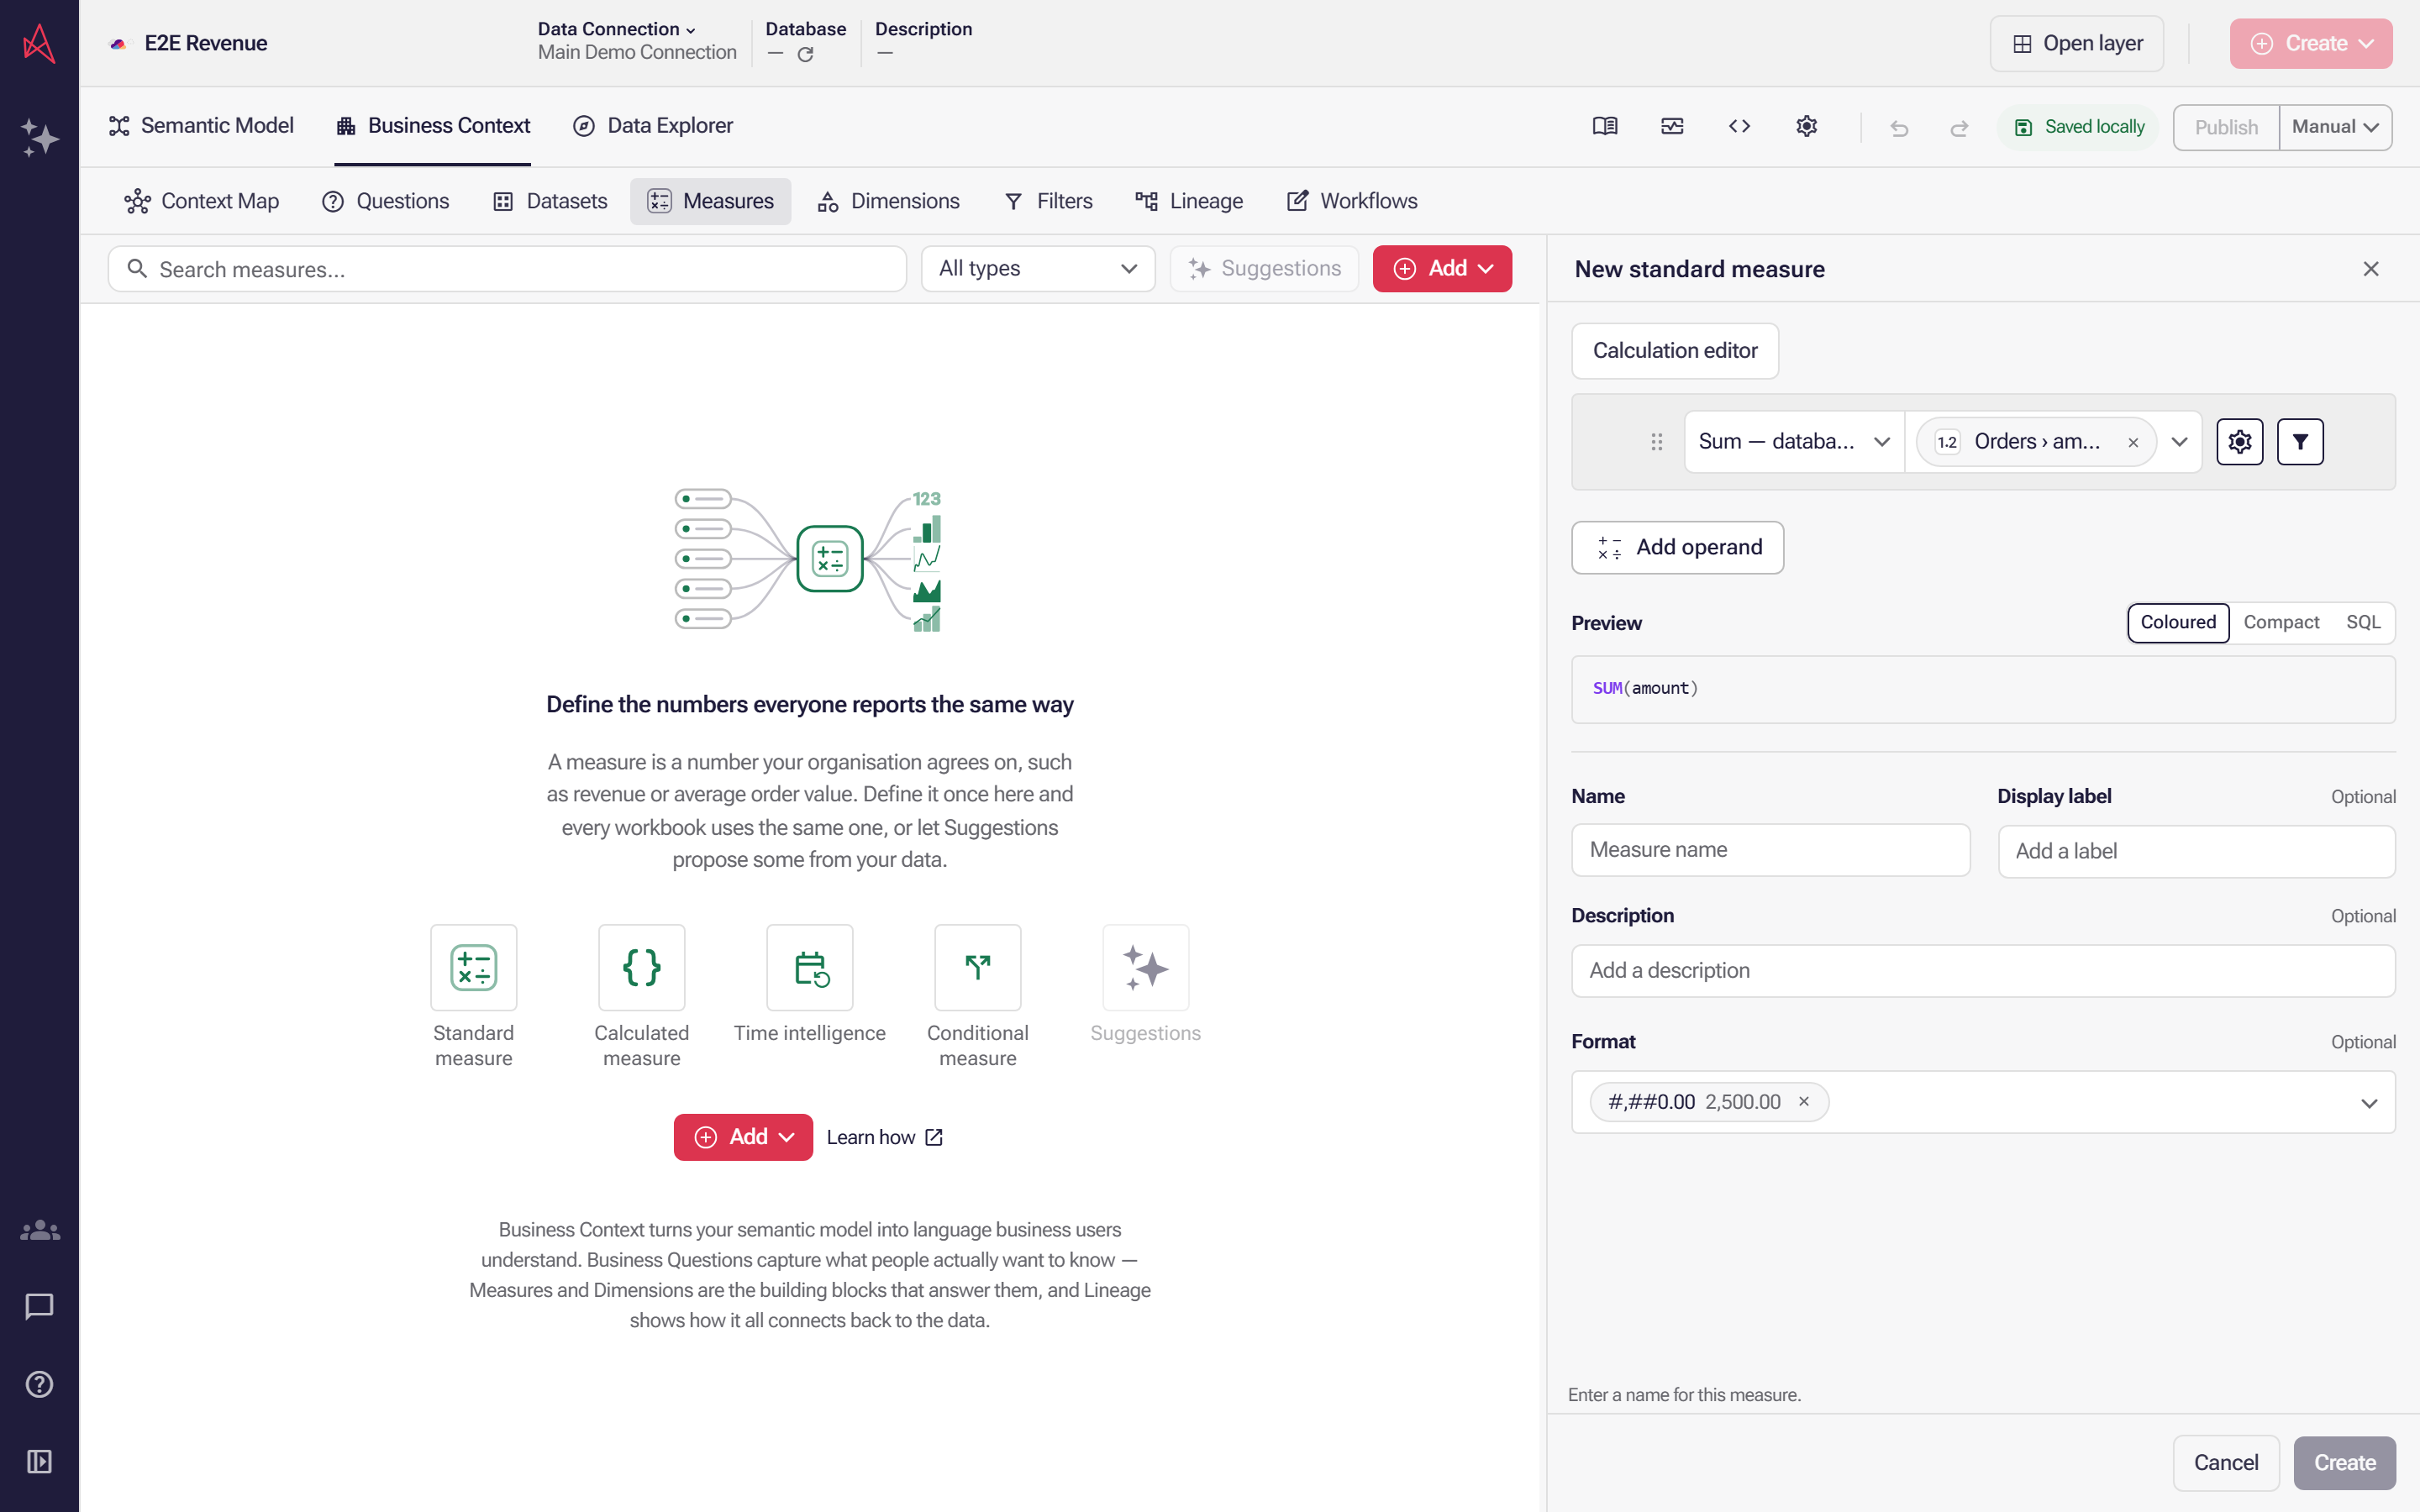
A new standard measure sums the amount field and has no period of its own yet; the filter icon in its action row is where you add one.
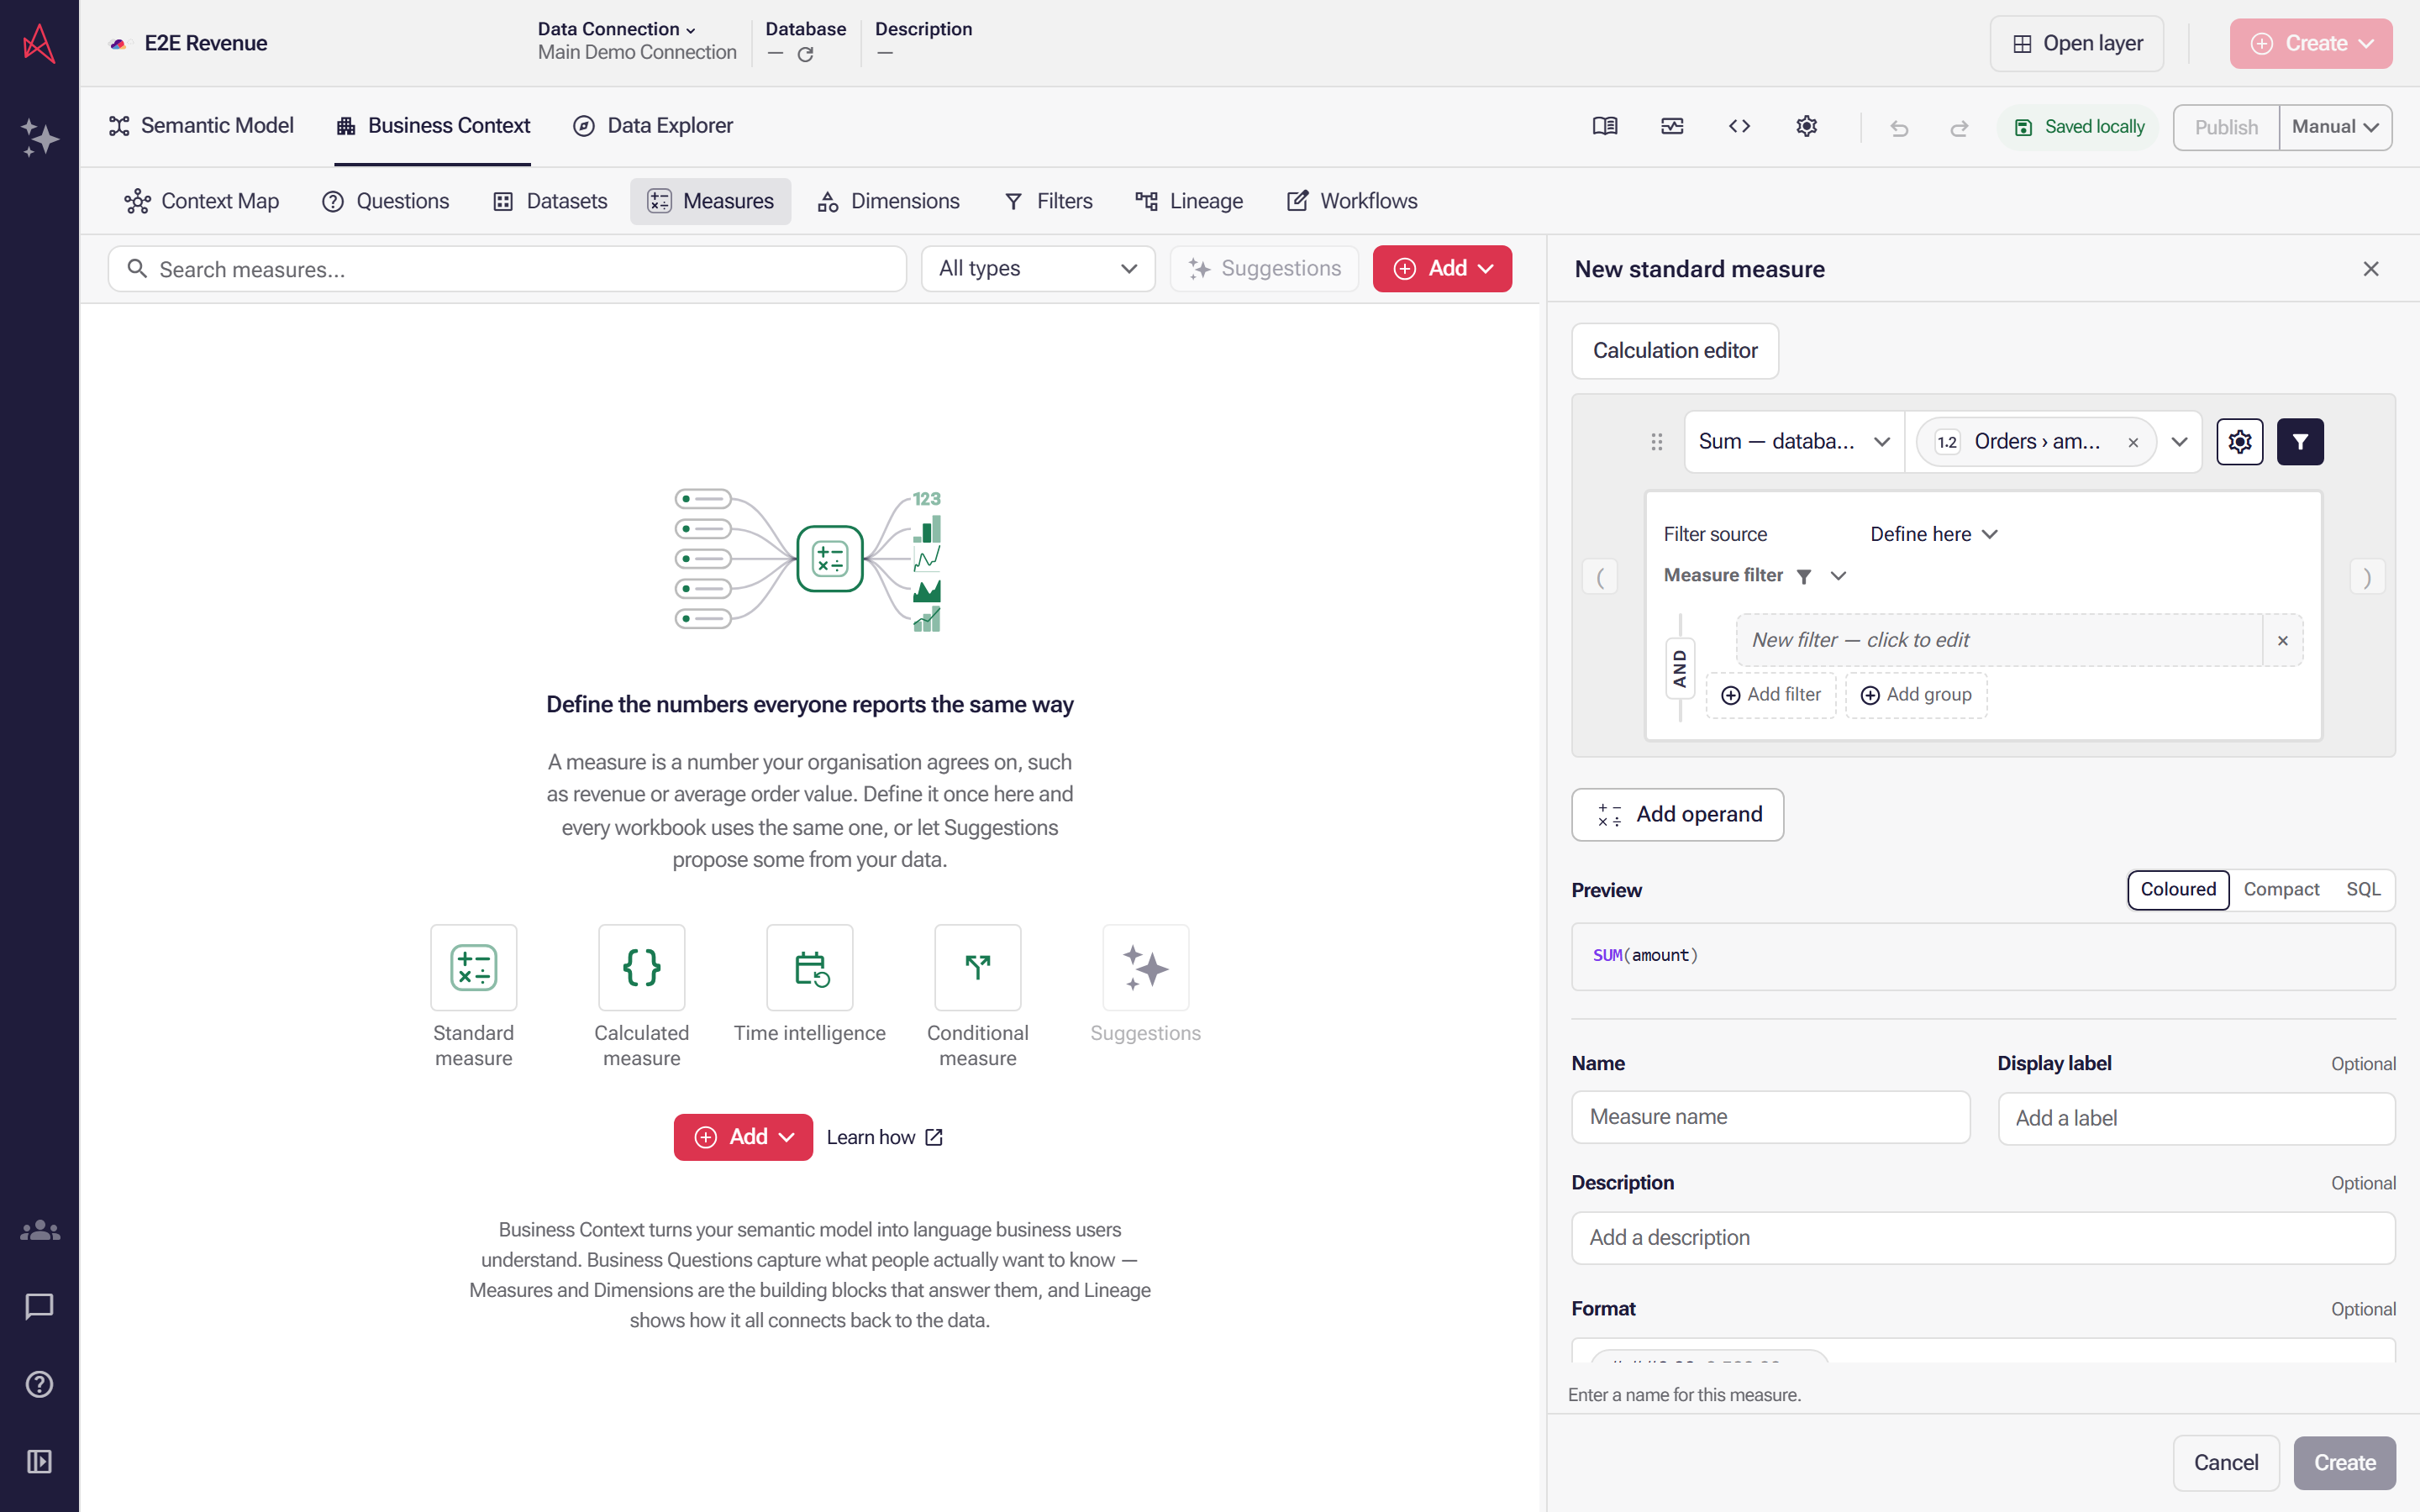
The measure filter opens with one empty condition row; click it to choose which field the period applies to.
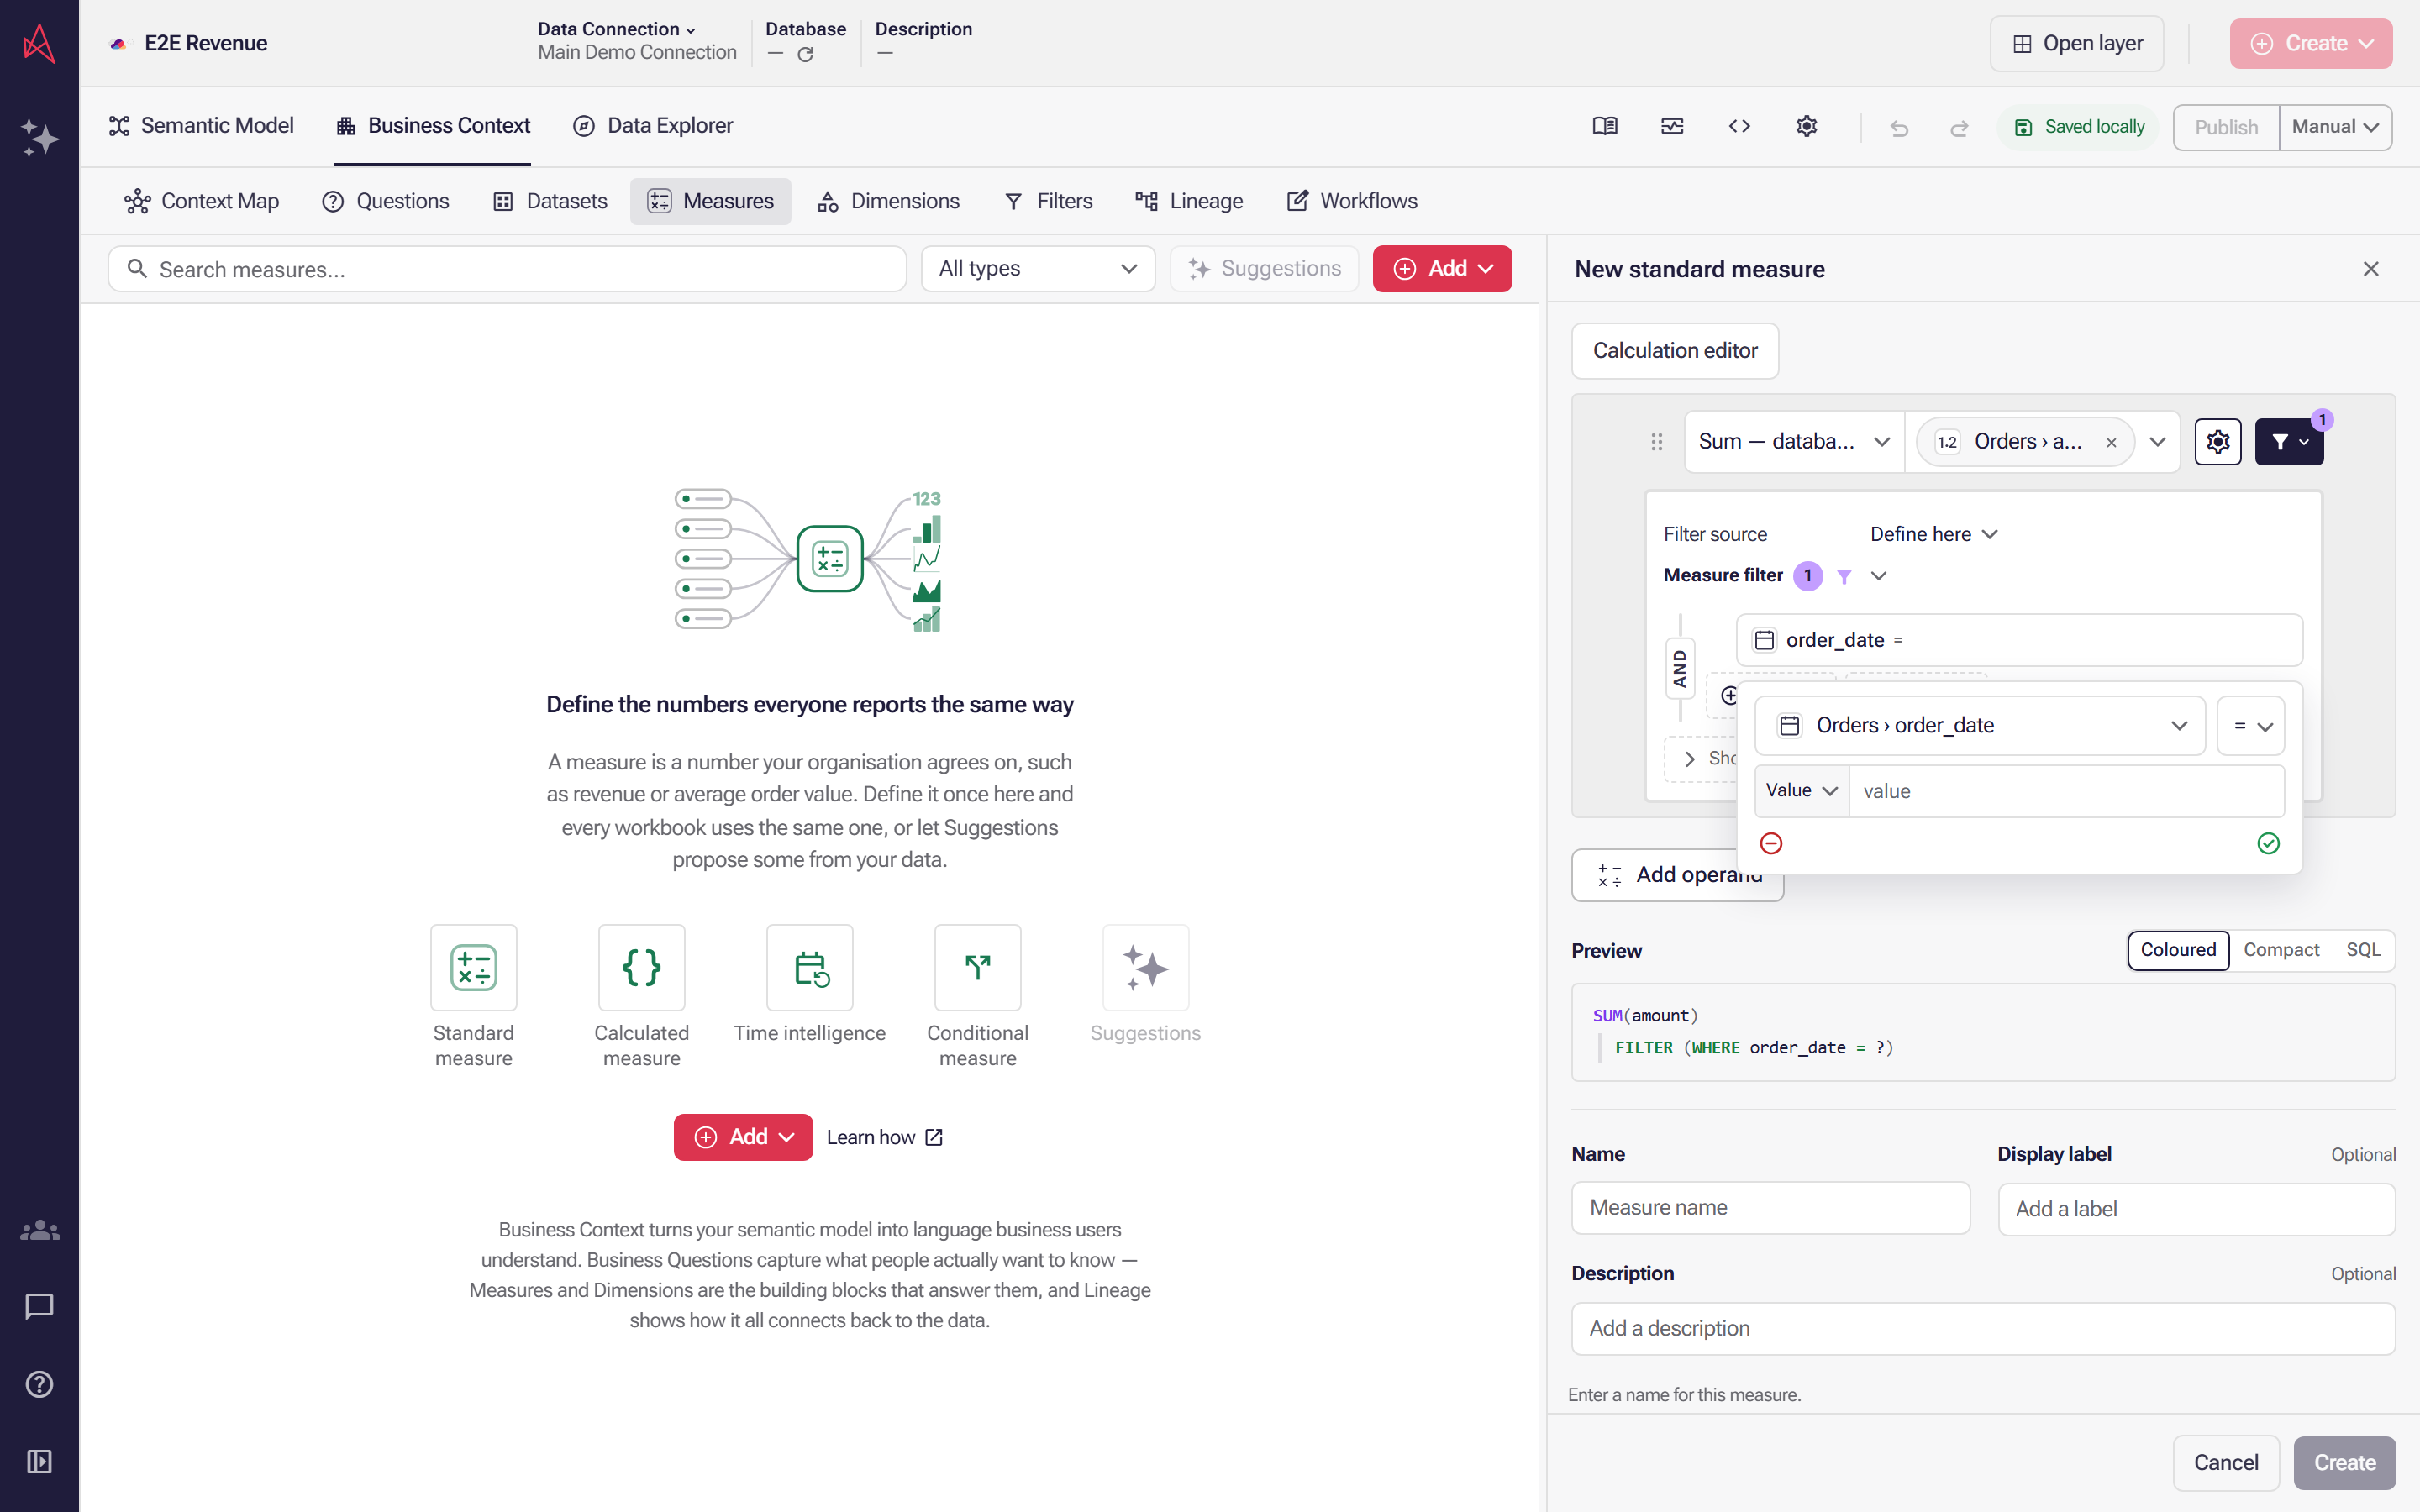
The condition now tests order_date, and the operator beside it is still Equals, which matches one date rather than a stretch of time.
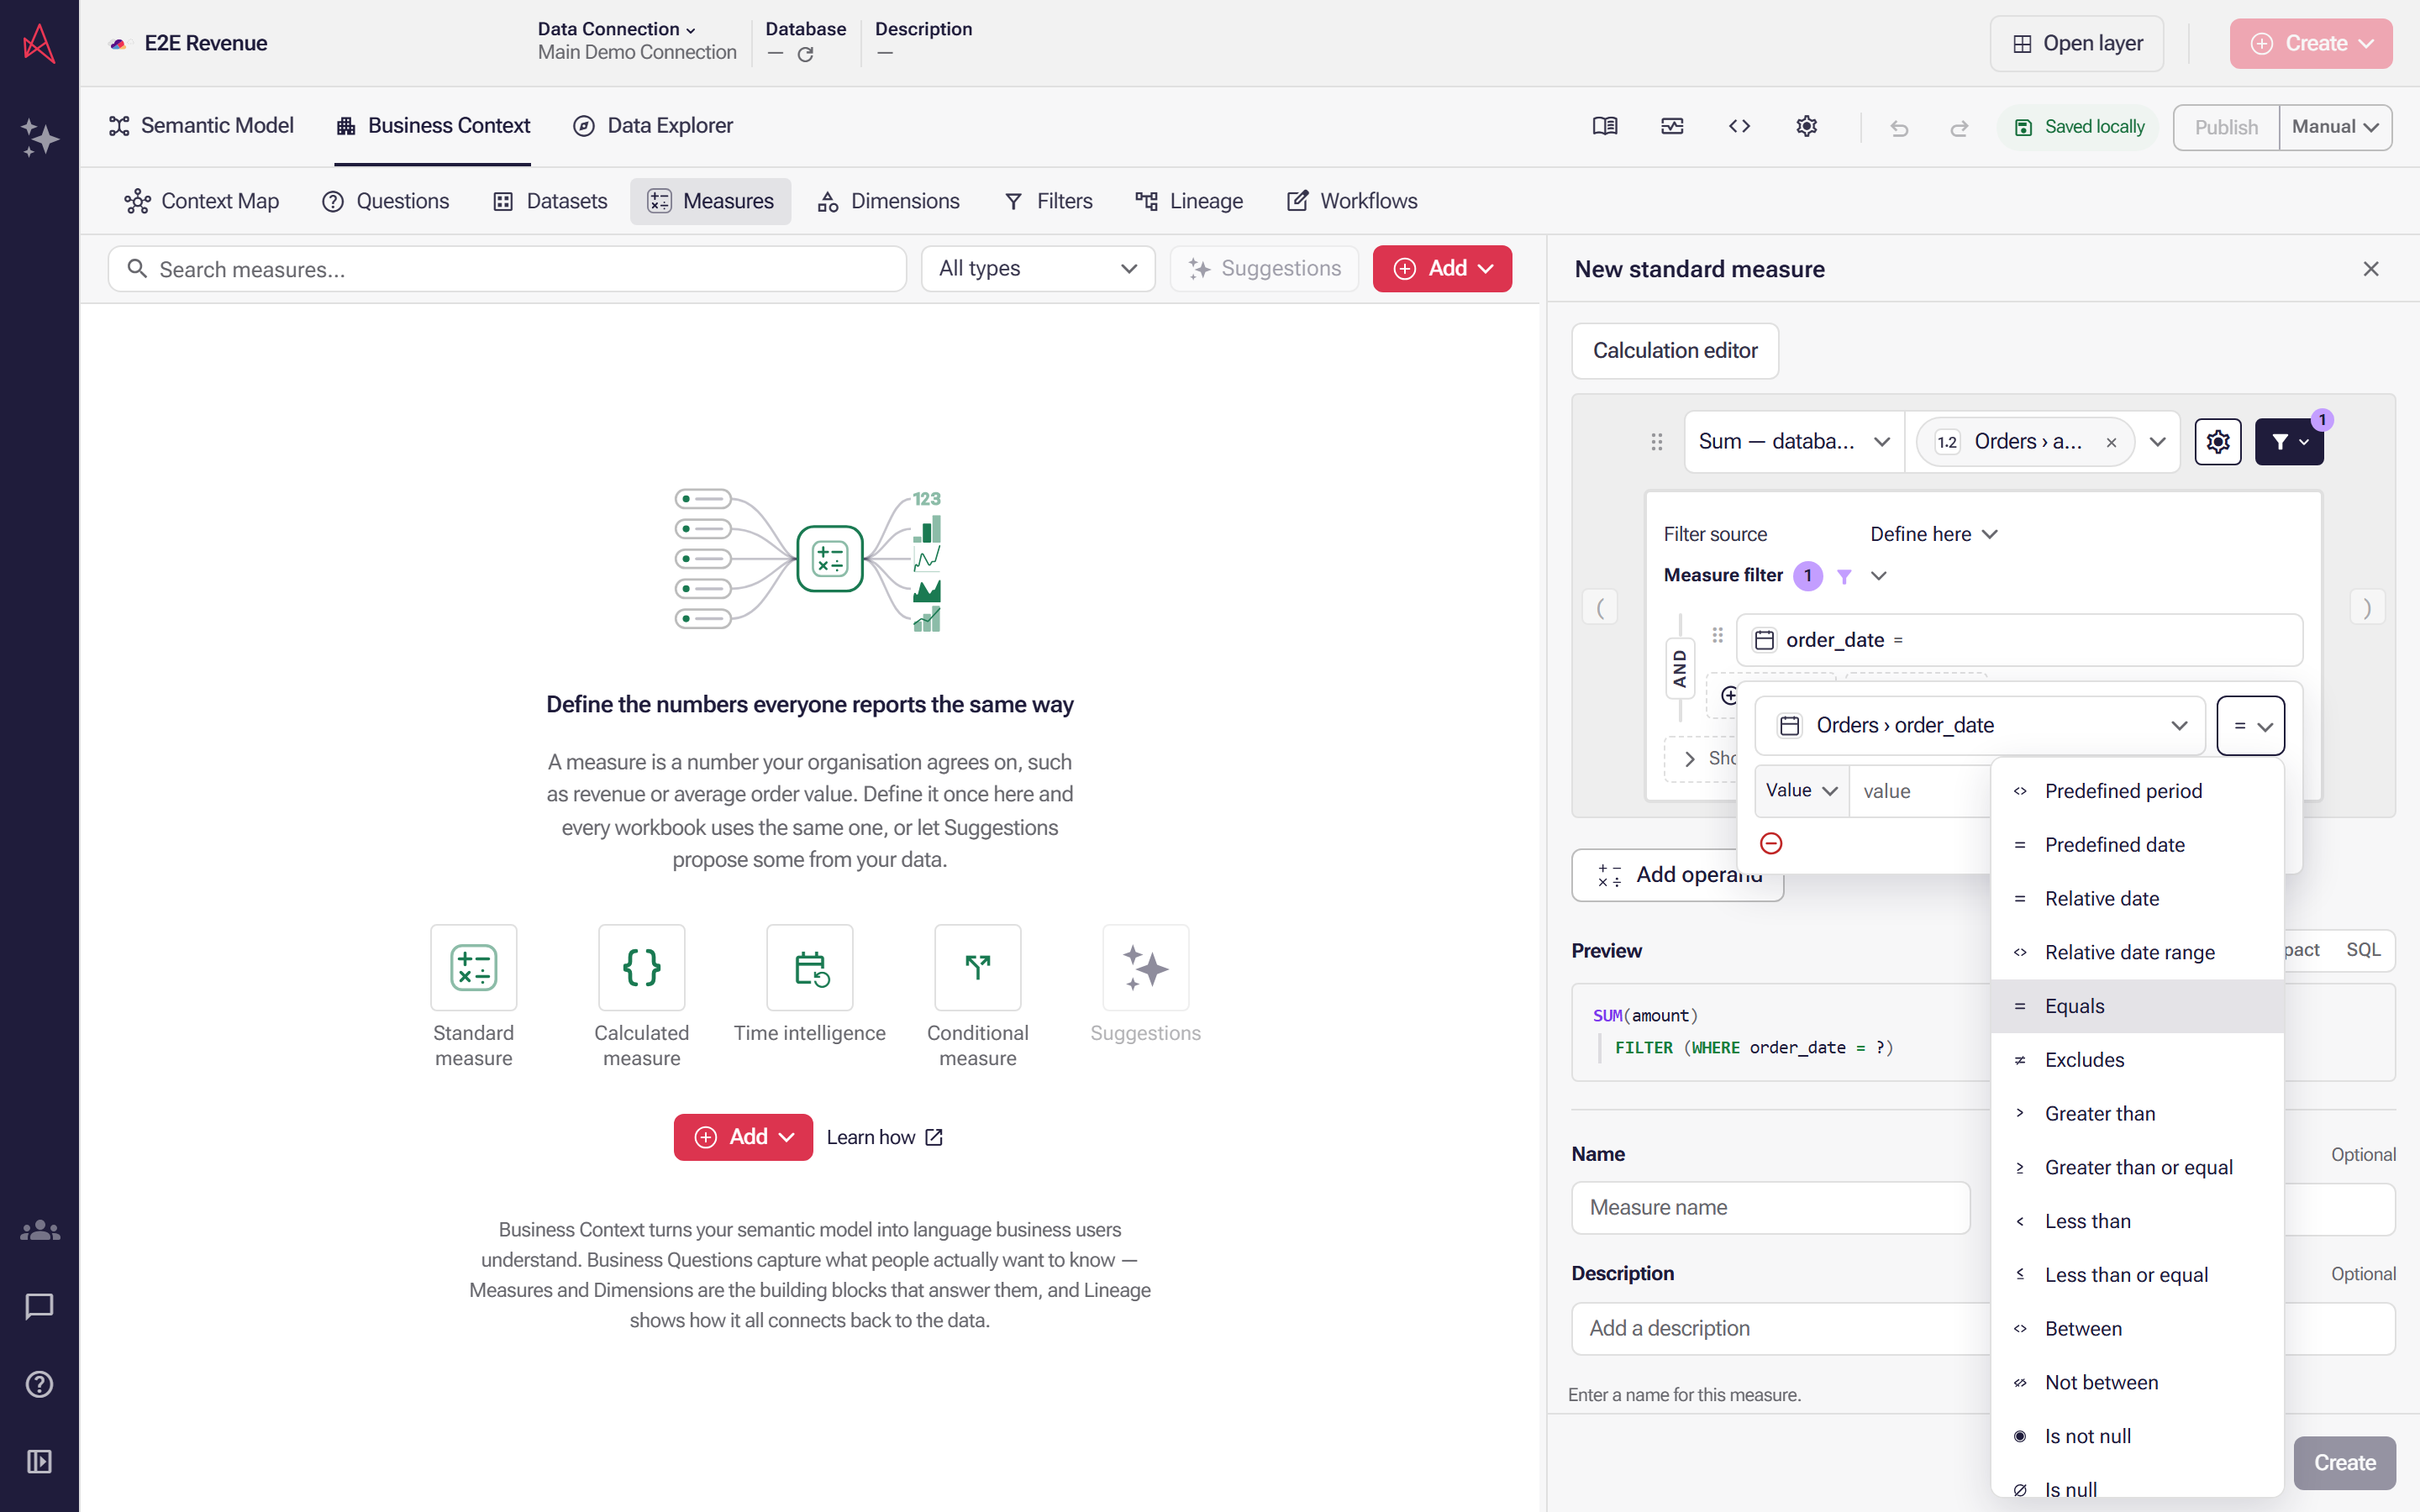
The operator menu lists what a date filter accepts; choose Predefined period to name a stretch of the calendar instead of typing dates.
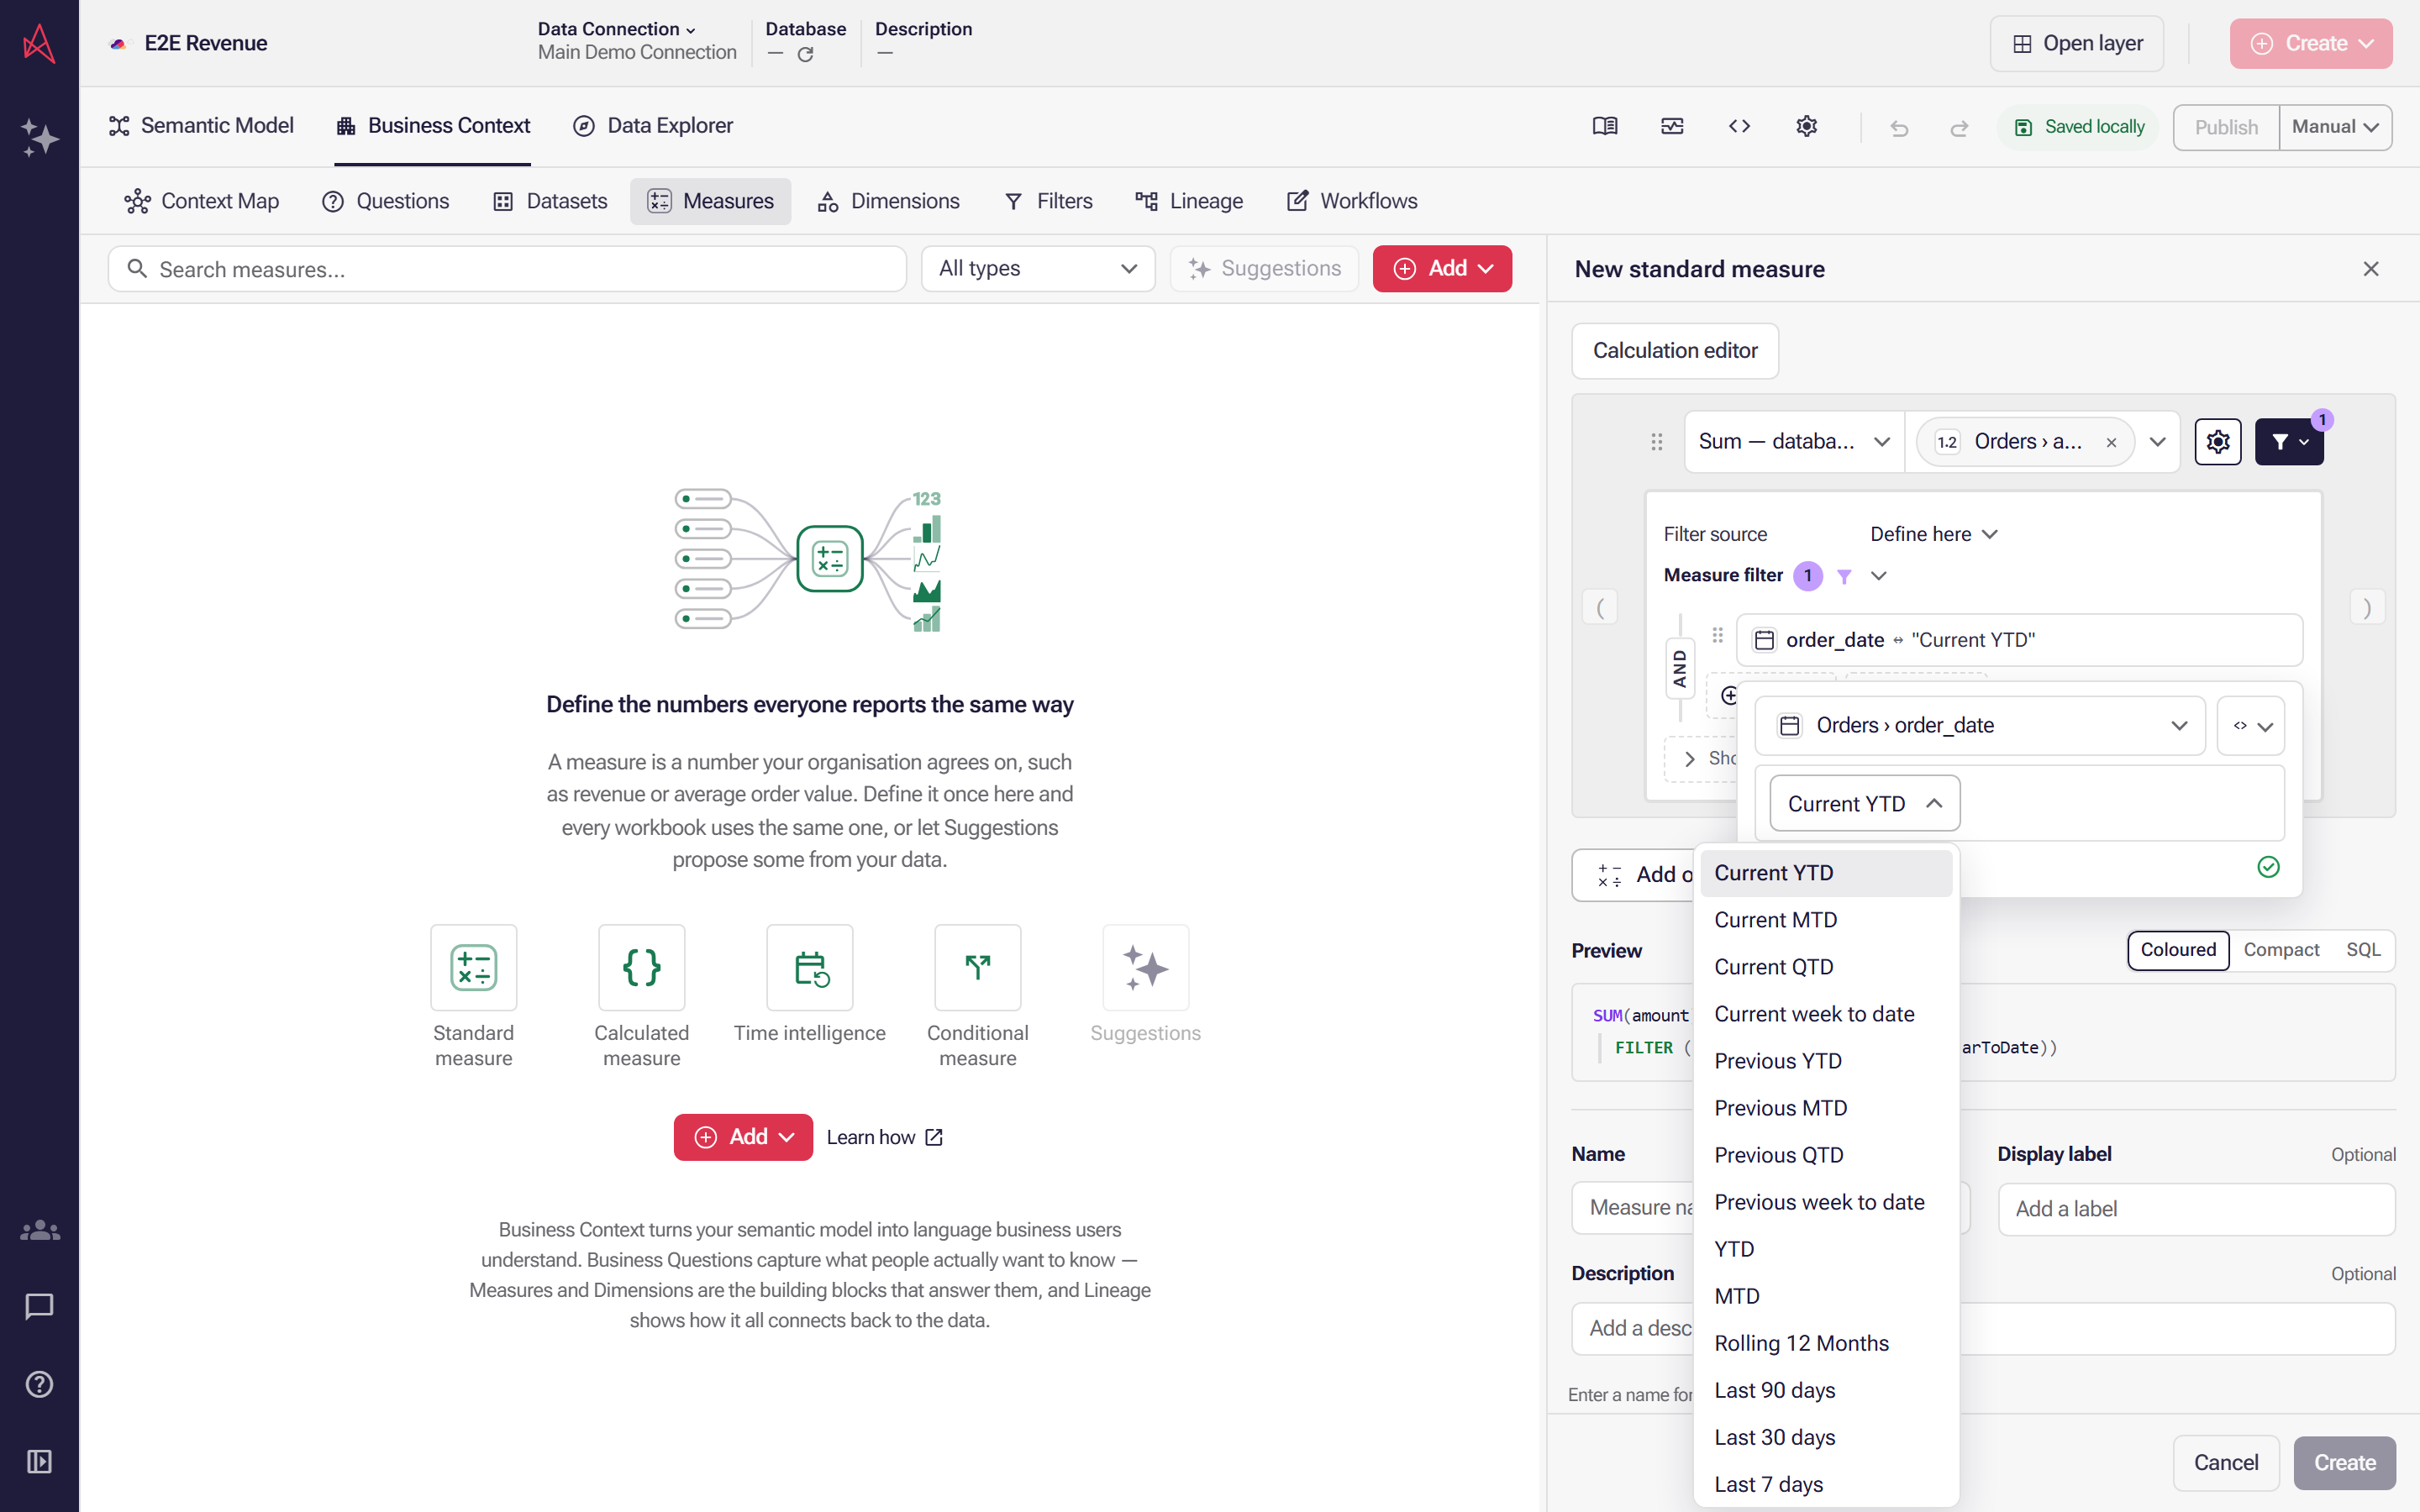
The period select holds named calendar ranges and opens on Current YTD; choose Current MTD to limit the measure to this month.
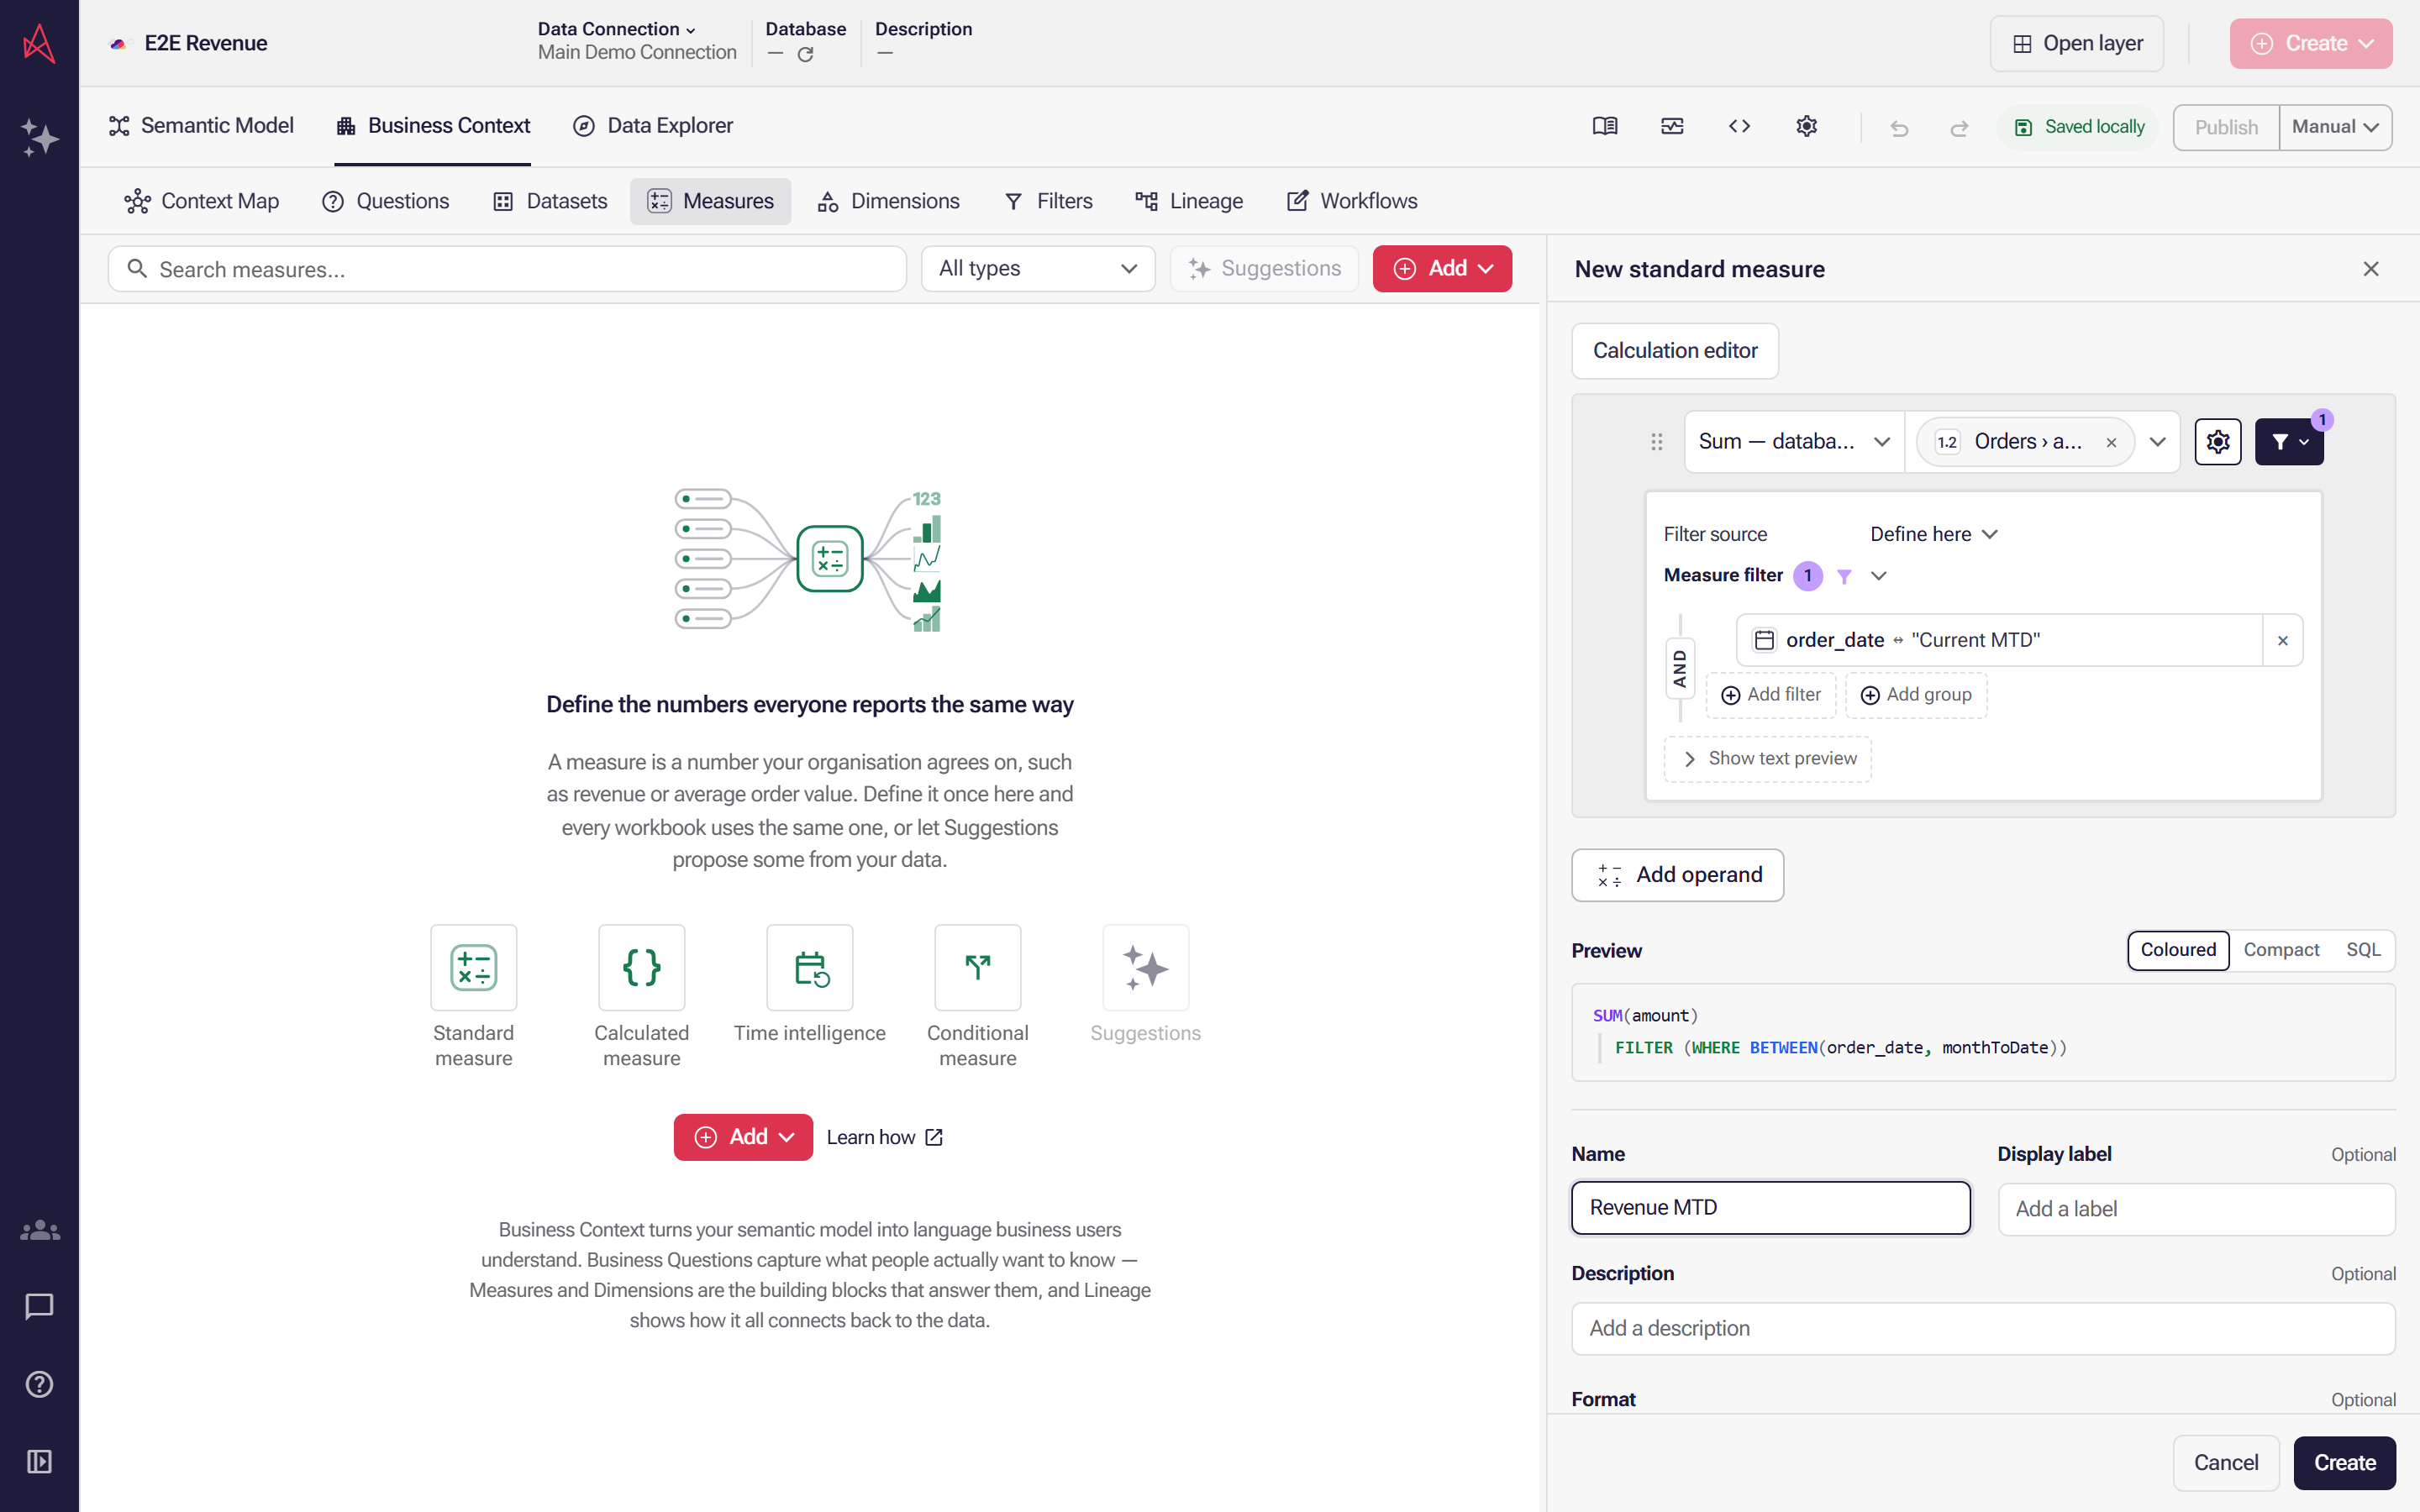
Revenue MTD now sums amount wherever order_date falls in the current month to date, and Create saves it into the layer.
On a saved measure, the panel’s next section is Calculation. Its heading carries Edit, which opens the formula editor. For a measure that aggregates one field, the section also holds the aggregation and field pickers, with the formula under them as a muted Preview and its three view options beside it. Other measures show the formula itself.
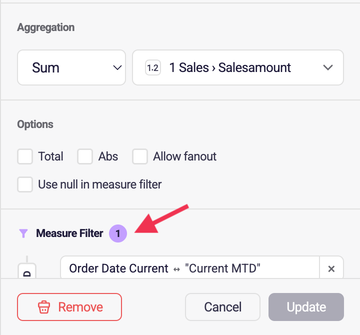
- Calculation — how the number is rolled up, and which field it runs over
- Format — how the number is shown, right after the calculation
- Measure filter — a condition built into the measure itself. Like and Not like take
*and?as wildcards, unlike custom group rules, which take SQL’s%and_; see Search and wildcards in filters and its custom group section - Options — how the measure behaves in edge cases. The section is folded until you open it, and opens by itself when one of them is set. Total ignores the chart’s dimensions, which is what a share of total needs. Abs reports the absolute value. Fanout offers Disabled, Allow fanout, and Allow fanout with relation reduction. Plain fanout lets joins repeat rows, so a value can contribute more than once. Relation reduction reduces repeated joined rows at the relationship’s dimensionality before aggregation. This is separate from Count distinct in the aggregation selector, which counts unique values; either setting can be changed without changing the other. Imported reduced-fanout settings remain visible and editable. It also clears a Fields not on one row issue when a many-to-many join links the tables. Issues reports that problem when one aggregation combines fields from tables that no join brings onto one row, and it blocks publishing until a join or a custom SQL view brings them together, or the calculation is split into separate aggregations. Use null in measure filter applies to a Sum with a measure filter: a group with no matching rows shows blank instead of 0. It is unavailable until the measure has a filter
The measure filter is worth understanding. In this example the filter is Order Date Current — “Current MTD”, and it’s what makes the measure monthly. The filter is part of the definition, not something the report applies afterwards, so anyone using this measure gets month-to-date without having to know that.
To set a date filter, choose a date field, select Predefined period, then choose a period such as Current MTD. Selecting an option keeps the filter editor open so you can review the condition before creating or updating the measure. Predefined date, Relative date, and Relative date range offer other date conditions; select the date or unit in their value dropdown. You can scroll longer dropdowns to reach an option while keeping the filter editor open.
Predefined periods
Section titled “Predefined periods”Predefined period lists these, in this order. Each is worked out from today’s date when the query runs, so a measure filtered to Current MTD moves on by itself. Weeks run from Monday to Sunday. The examples take today as Thursday 15 October 2026.
| Predefined period | Rows it keeps | Example |
|---|---|---|
| Current YTD | This year, from 1 January to today | 1 Jan – 15 Oct 2026 |
| Current MTD | This month, from the 1st to today | 1 – 15 Oct 2026 |
| Current QTD | This quarter, from its first day to today | 1 – 15 Oct 2026 |
| Current week to date | This week, from Monday to today | 12 – 15 Oct 2026 |
| Previous YTD | Last year, from 1 January to the same date last year | 1 Jan – 15 Oct 2025 |
| Previous MTD | Last month, from the 1st to the same day of that month | 1 – 15 Sep 2026 |
| Previous QTD | Last quarter, from its first day to the same point in it | 1 Jul – 15 Jul 2026 |
| Previous week to date | Last week, from Monday to the same weekday | 5 – 8 Oct 2026 |
| YTD | Every year, from 1 January to today’s day and month | 1 Jan – 15 Oct of each year |
| MTD | Every month, from the 1st to today’s day of the month | 1st – 15th of each month |
| Rolling 12 Months | The whole of this month and the eleven whole months before it, including dates after today | 1 Nov 2025 – 31 Oct 2026 |
| Last 90 days | The 90 days ending today, today included | 18 Jul – 15 Oct 2026 |
| Last 30 days | The 30 days ending today, today included | 16 Sep – 15 Oct 2026 |
| Last 7 days | The 7 days ending today, today included | 9 – 15 Oct 2026 |
| Current Year | The whole of this year, including dates after today | 1 Jan – 31 Dec 2026 |
| Current Quarter | The whole of this quarter | 1 Oct – 31 Dec 2026 |
| Current Month | The whole of this month | 1 – 31 Oct 2026 |
| Current Week | The whole of this week | 12 – 18 Oct 2026 |
| Previous year | The whole of last year | 1 Jan – 31 Dec 2025 |
| Previous month | The whole of last month | 1 – 30 Sep 2026 |
| Previous quarter | The whole of last quarter | 1 Jul – 30 Sep 2026 |
| Previous week | The whole of last week | 5 – 11 Oct 2026 |
| Today | Today | 15 Oct 2026 |
| Yesterday | Yesterday | 14 Oct 2026 |
| Max Date | The latest date in the field, read from the data rather than the calendar | — |
| Min Date | The earliest date in the field, read from the data | — |
YTD and MTD are the ones to use for a like-for-like comparison across years or months: with a date or month dimension on the chart, each year or month is cut off at the same point as the current one. For a comparison laid out as a measure, such as this quarter beside last, see the time intelligence measure.
Multiply fields before aggregating
Section titled “Multiply fields before aggregating”Some numbers have to be worked out on each row before they are added up: order value from quantity and unit price is SUM(Quantity × Unit price), which is not the same as SUM(Quantity) × SUM(Unit price). Build it in the formula editor, opened with Edit on the Calculation heading:
-
Pick the first field. Select Add operand, choose the operator, such as Multiply, and pick the second field in the new row.
-
Select the ( before the first row (its tooltip reads Start a group here) and the ) after the second (End a group here).
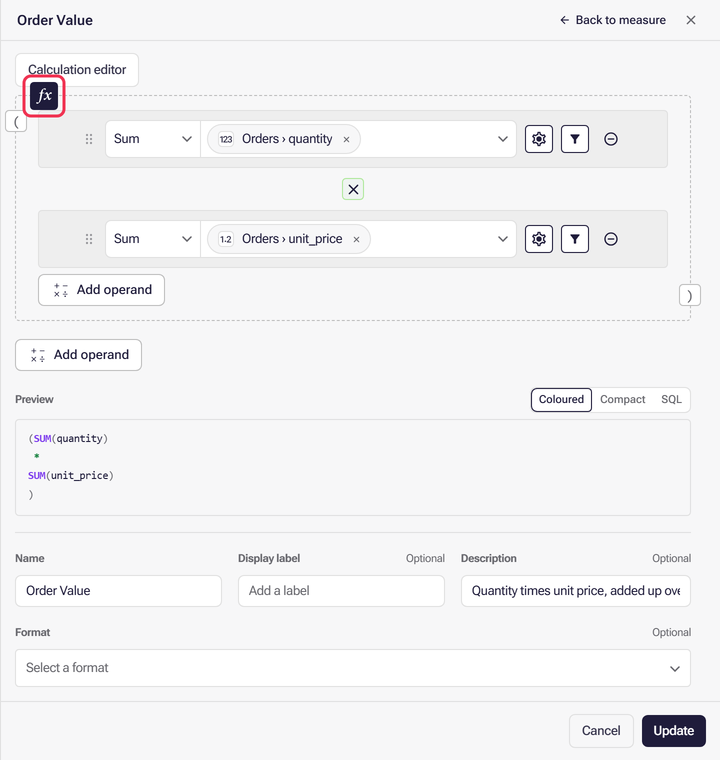
-
Select the fx icon at the start of the group, whose tooltip reads Aggregate this group row by row (e.g. SUM(a × b)), and choose the aggregation.
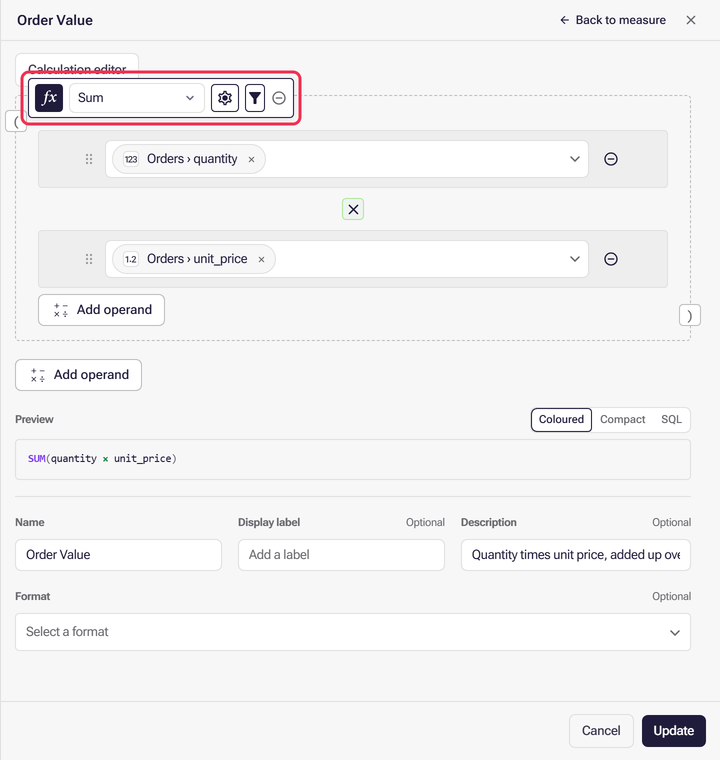
The rows inside the group lose their own aggregation pickers: the group’s aggregation applies to the result of each row. The group has its own Settings (Total, Absolute and Fanout), its own Group filter, and Remove row-by-row aggregation to undo it.
Once the group has an aggregation, each field picker in it lists only the tables whose rows can be combined with the other fields in the group: the same table, and tables it joins to without repeating a row, such as an order line’s order or product. A field already chosen stays listed even if its table no longer fits. If a table in the group has no numeric field, every table is listed. A group that still combines fields that no join brings onto one row is reported in Issues as Fields not on one row, and blocks publishing, as described under Options above.
Check the measure at every grain
Section titled “Check the measure at every grain”A measure that looks right for one record can be wrong when totalled. Check its value for a single record and for the whole population.
- Weighted values are row-level sums. Expected loss is the sum of each account’s ARR times its
own churn probability:
SUM(ARR × Probability). Written asSUM(ARR) × AVG(Probability), it is correct for one account and wrong for any group of them. See Multiply fields before aggregating. - Ratios need the same population. A measure compared with another, such as expected loss against ARR at risk, must use the same filter. Otherwise the ratio can exceed 100%.
- Name the grain. A measure that is only meaningful at one point, such as the gap at the finish rather than the worst gap during a race, needs its own measure and a name that says so.
- Targets and benchmarks belong in the layer. A 110% retention target or a 3× ratio benchmark is a constant measure, so a chart can draw it as a reference line and every app uses the same value.
After publishing, re-run the queries the apps on this layer depend on.
Parameters
Section titled “Parameters”A parameter is a named value with a default, used in a measure where a fixed number or filter value would otherwise go, so that whoever queries the measure can supply a different value: an exchange rate, a target, the start of a date range.
- In the formula. Choose Parameter in the Aggregation picker of a standard measure, or as an operand of a calculated measure. Type a name where the row shows
param_name, and a number as its default value. - In a measure filter. In a condition, change the picker in front of the value, which reads Value (tooltip Compare against), to Parameter, then type a name and a default value. The default takes the type of the field the condition tests, so a date field takes a date. That picker is not offered on a condition set to a predefined or relative date, or on a Between or Not between condition, so a parameter cannot stand in for those.
A name used more than once in a measure is one parameter with one default. On a saved measure, the panel lists the parameters under Parameters, folded, with a count beside the heading. Each shows its Name and a Default value you can change there.
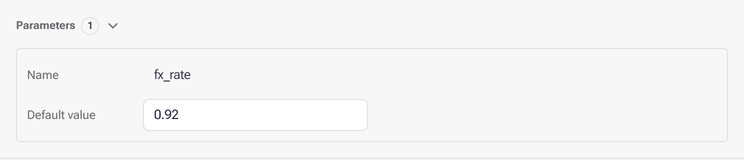
A query that supplies no value for a parameter uses its default. Nash and other MCP clients can pass a value for a measure’s parameter when they query it. In the classic Workbook Editor, a chart can bind a parameter to a workbook variable instead; see Measure parameters in the classic Workbook Editor.
Save your changes to a measure
Section titled “Save your changes to a measure”Changes aren’t saved until you select Update. While you have changes, the panel says Not updated yet above its buttons, its title and the measure’s row in the list carry a small dot, and Cancel backs out and leaves the measure as it was. Opening another item also discards them. With nothing changed, the button reads Close.
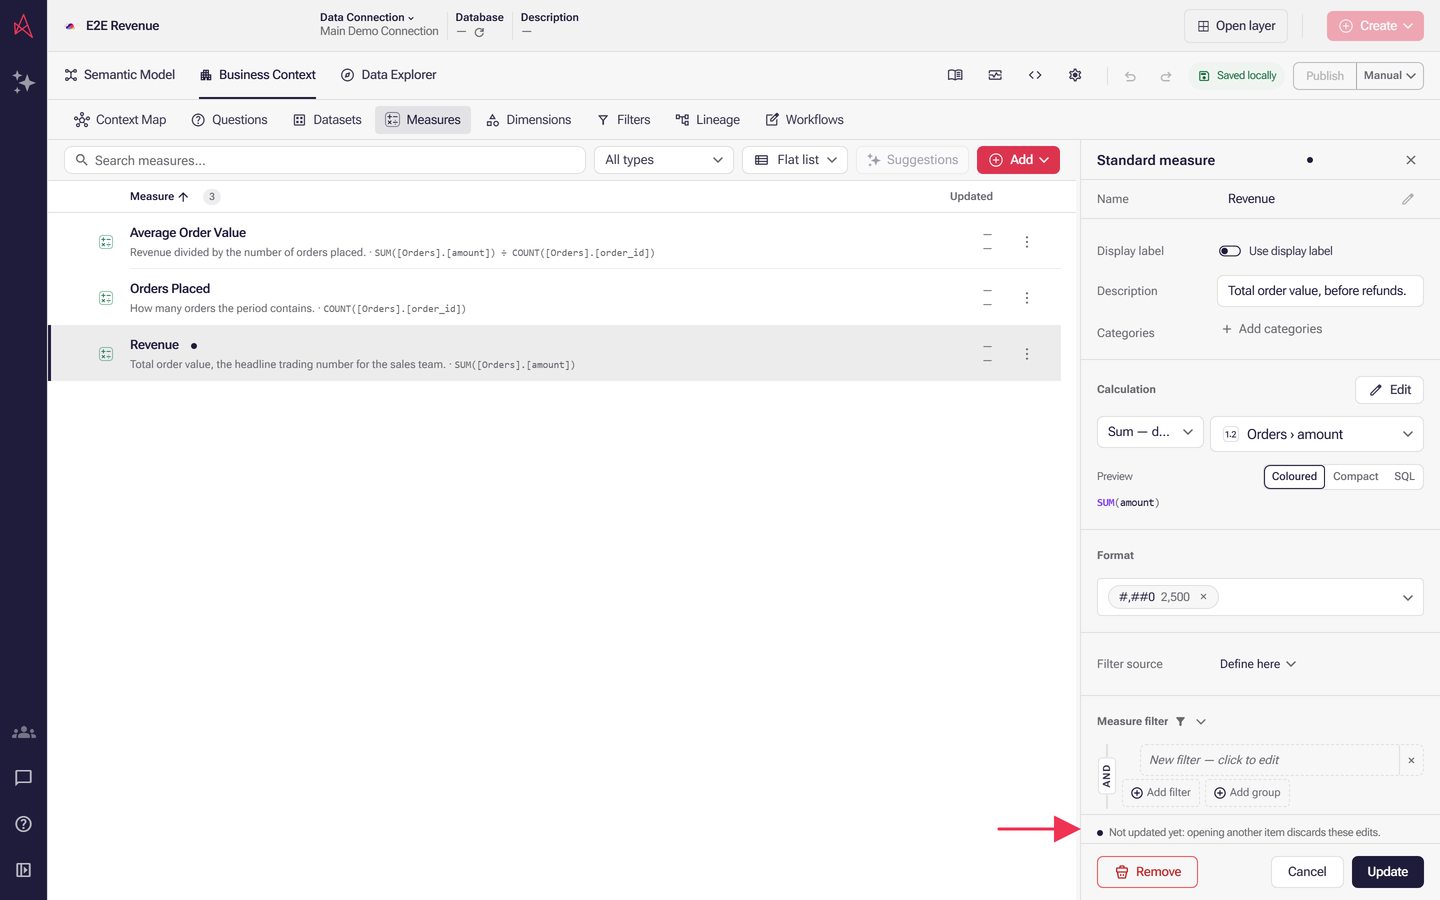
Like every other change in the editor, updating a measure saves to the draft — it doesn’t reach anyone else’s workbooks until you publish. See How versioning works in the semantic layer.