

Tree Chart - KPI Tree & KPI Row
The KPI Tree lets you break a top metric into the drivers behind it, in one view. Instead of jumping between dashboards, you can:
| 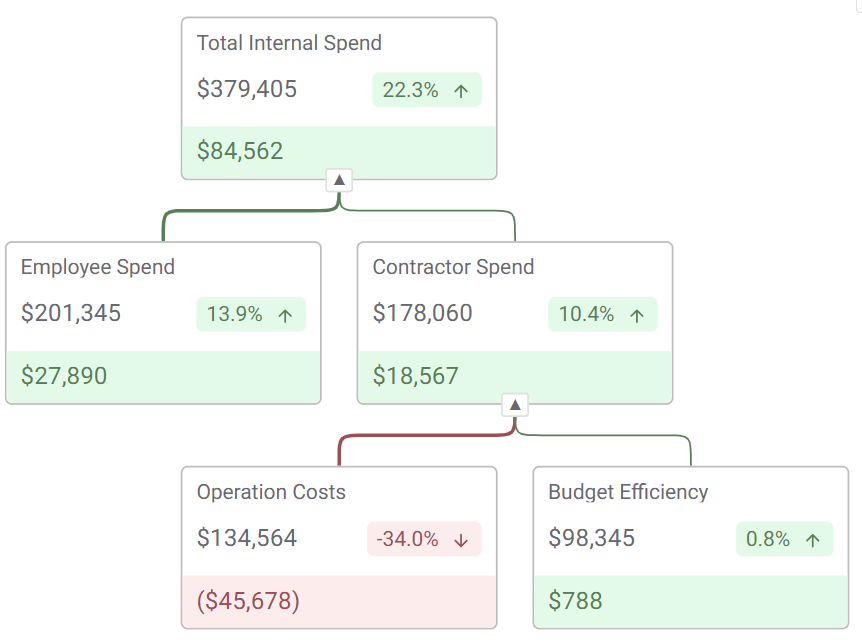 |
The KPI Tree lets you break a top metric into the drivers behind it, in one view.
Instead of jumping between dashboards, you can:
-
see the headline KPI
-
understand what changed
-
trace it back to the source
Why teams use it
Section titled “Why teams use it”Teams struggle to answer:
-
“Why did this number move?”
-
“Which area caused the change?”
-
“Where should we act?”
Most tools split this across:
-
KPI tiles
-
drilldowns
-
separate charts
This keeps everything connected in one place.
What you can build
Section titled “What you can build”KPI Row (quick status)
Section titled “KPI Row (quick status)”
Use when you just need a fast read.
-
Revenue, Conversion, Churn side by side
-
Weekly or exec reporting
-
Same KPI cards used in the tree
-
Consistent, scalable style, in a single object
Dimensional KPI Tree / KPI Trellis (explore deeper)
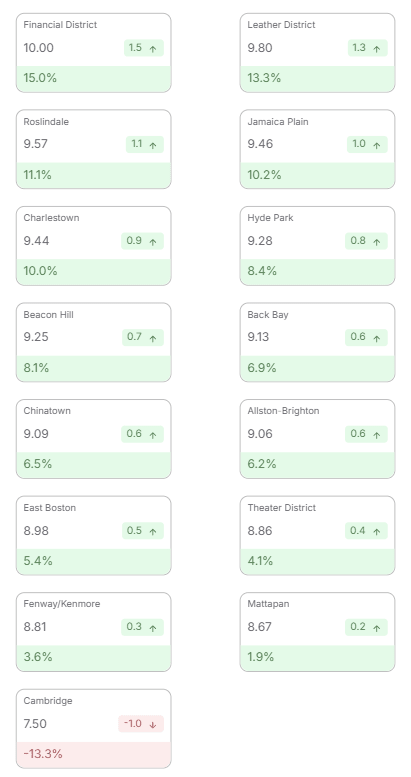
Section titled “Dimensional KPI Tree / KPI Trellis (explore deeper)”Use when you want to break a single KPI across a dimension. Spot outliers and key drivers instantly, seeing what’s high / low at a glance.
-
Take one KPI (e.g. Revenue, Conversion Rate)
-
Split it by a dimension (e.g. Region, Product, Channel)
-
Each value becomes its own KPI card or mini-tree
This gives you a grid of comparable KPIs instead of one hierarchy.
Examples
-
Revenue by Region
-
Conversion Rate by Device
-
Churn by Customer Segment
Use it when
-
You care about comparison, not hierarchy
-
The dimension is flat (no parent/child)
-
You want fast scanning across groups
Explaining Root Cause & Movement with the KPI Tree
Section titled “Explaining Root Cause & Movement with the KPI Tree”Use when you need to explain change.
-
Start with a top KPI
-
Break into drivers (e.g. Region → Product → Channel)
-
Show both value and change at each level
This is where most teams spend time, answering why.

Configuring the KPI Tree
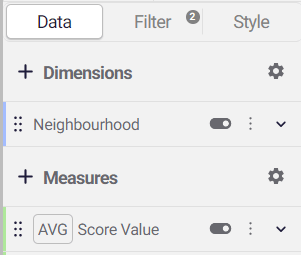
Section titled “Configuring the KPI Tree”Step 1: Define your nodes
|  |
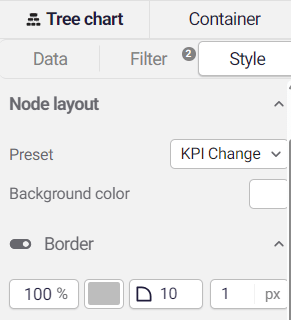
Step 2: Choose your layout
|  |
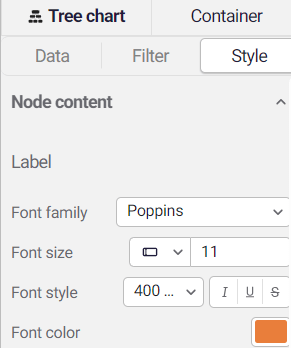
Step 3: Style your KPI cards
|  |
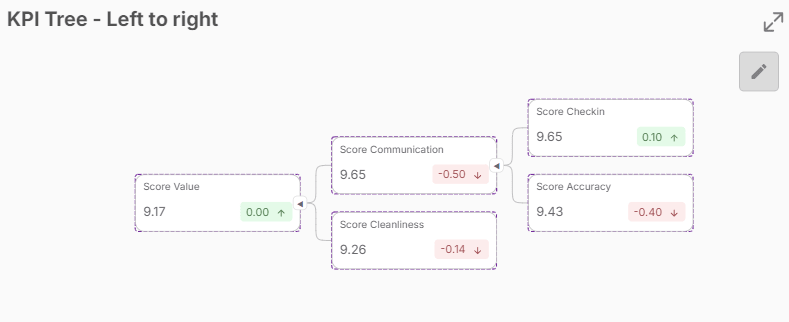
Step 4: Organise your cards
|  |
Key Capabilities
Section titled “Key Capabilities”Interactive by default
-
Node selection (filters downstream)
-
Brushing (highlight related measure on hover)
-
Bookmark support (state, zoom, expansion)
-
Works with existing selections
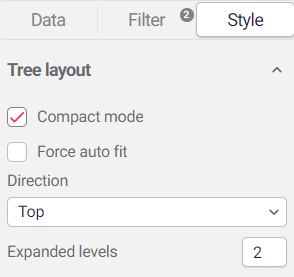
Flexible layout
-
Top-down or left-to-right
-
Auto-fit layout
-
Stable positioning when expanding
-
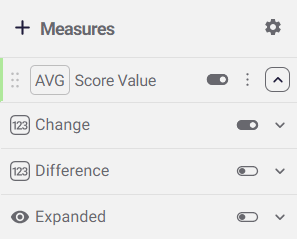
Expand / collapse
-
Open specific branches
-
Set default state (e.g. fully expanded)
-
Control via variables
-
Clear visual signals
-
Positive / negative colouring
-
Direction arrows
-
Connector lines inherit colour from children
Known Limitations
Section titled “Known Limitations”- Measures are supported for the lowest level of dimensions / lowest level of hierarchy