

Create a dimension in Business Context
A dimension is what you break a number down by — product, region, month, price band. Measures give you the figures; dimensions give you the ways of slicing them.
They are built differently, so this article covers each kind in turn:
| Kind | What it gives you | Availability |
|---|---|---|
| Field dimension | One column, exposed as something people can group by | Always |
| Drill-through | A path to step down, such as Region › Nation › Customer | Always |
| Bucket | Bands from a number, such as price brackets | Always |
| Custom groups | Your own groups of a field’s values, by rule | Always |
| Sets | Values built from stored set filters | With Business Questions |
| Time intelligence axis | Periods for period-over-period measures | With period-over-period |
Before you start: open a semantic layer and go to Business Context → Dimensions.
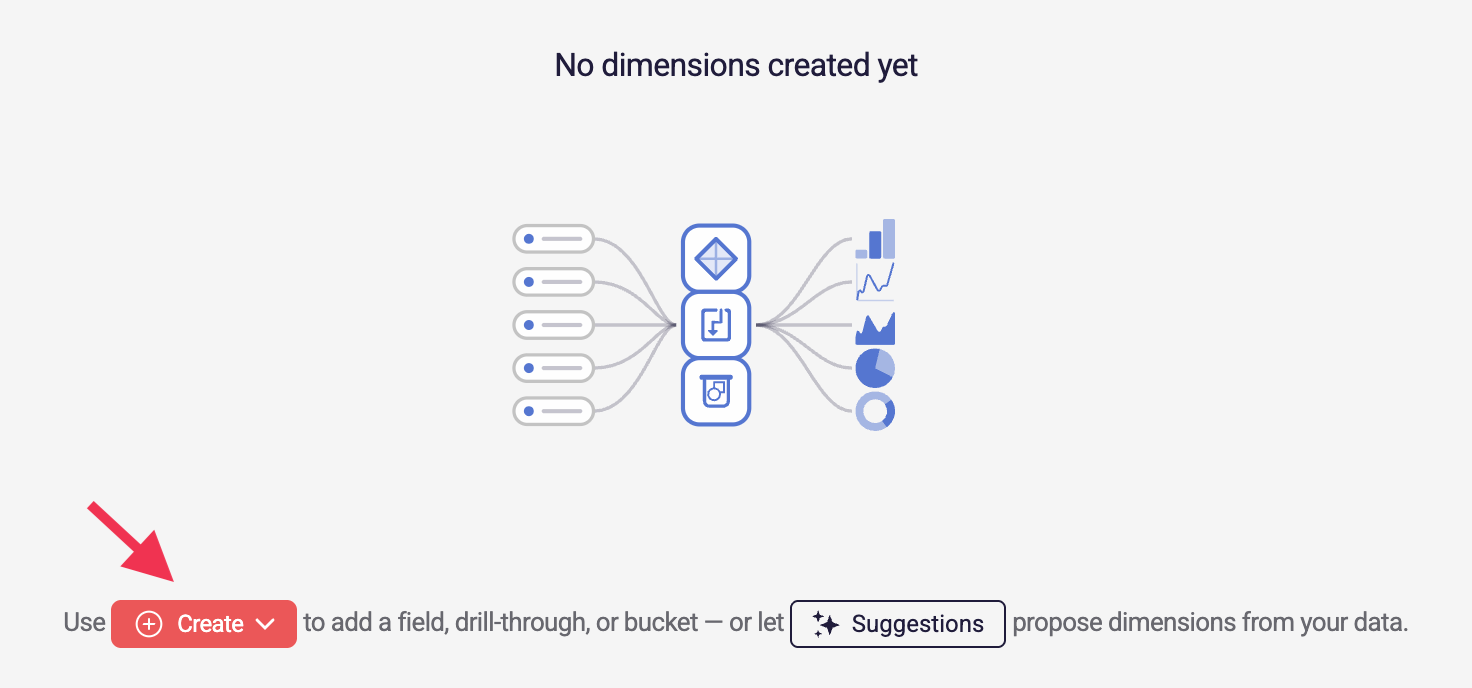
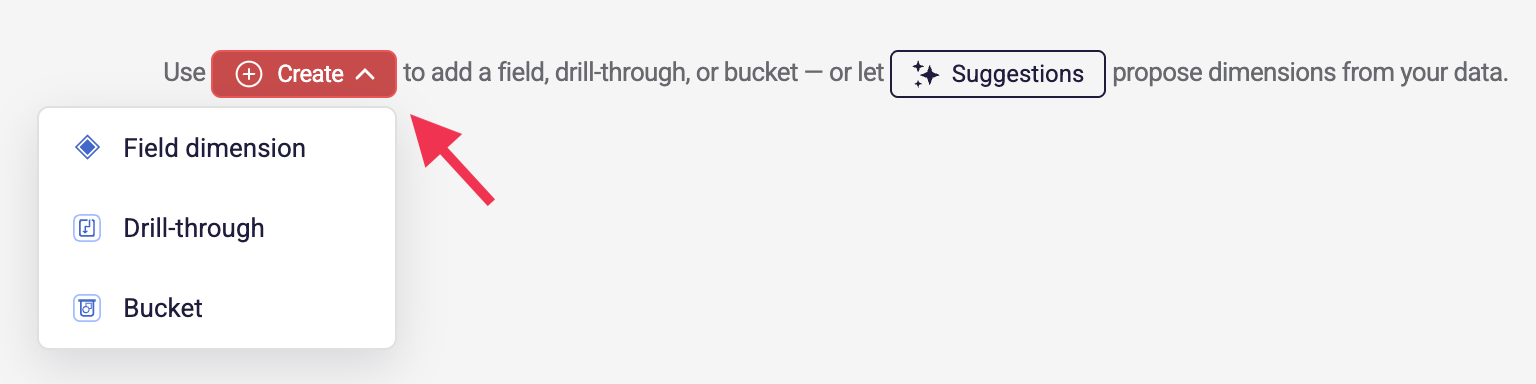
Every kind starts the same way — click Create and pick one. The menu lists the kinds available to you; a kind whose feature is not enabled for your tenant does not appear.
Tip: before building from scratch, try Suggestions — Astrato reads your model and proposes dimensions from the columns already there. See Get suggestions from your data.
Create a field dimension
Section titled “Create a field dimension”The straightforward one: a column from your model, exposed as something people can group by.
Step 1: Choose Create → Field dimension.
Step 2: Give it a Name — this is what people will see, so use the business word rather than the column name.
Step 3: Add a Description if it needs one.
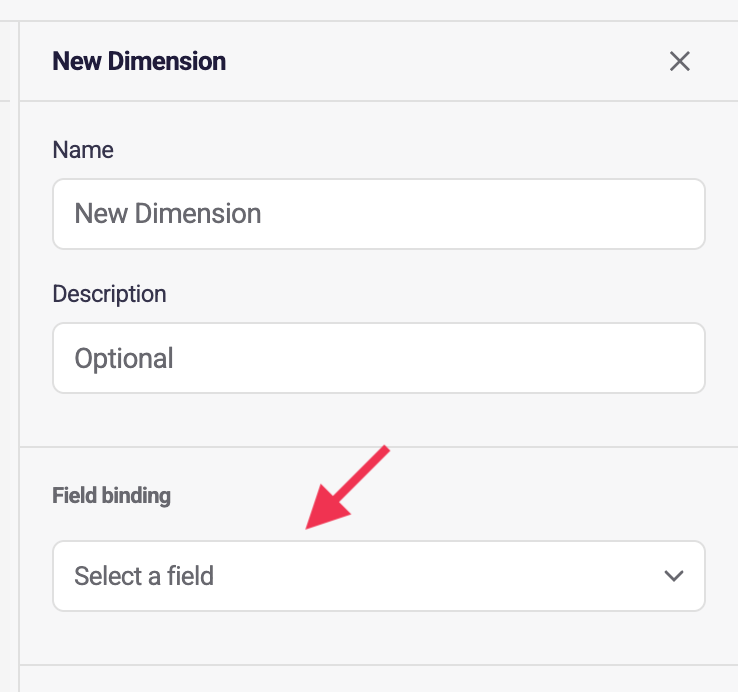
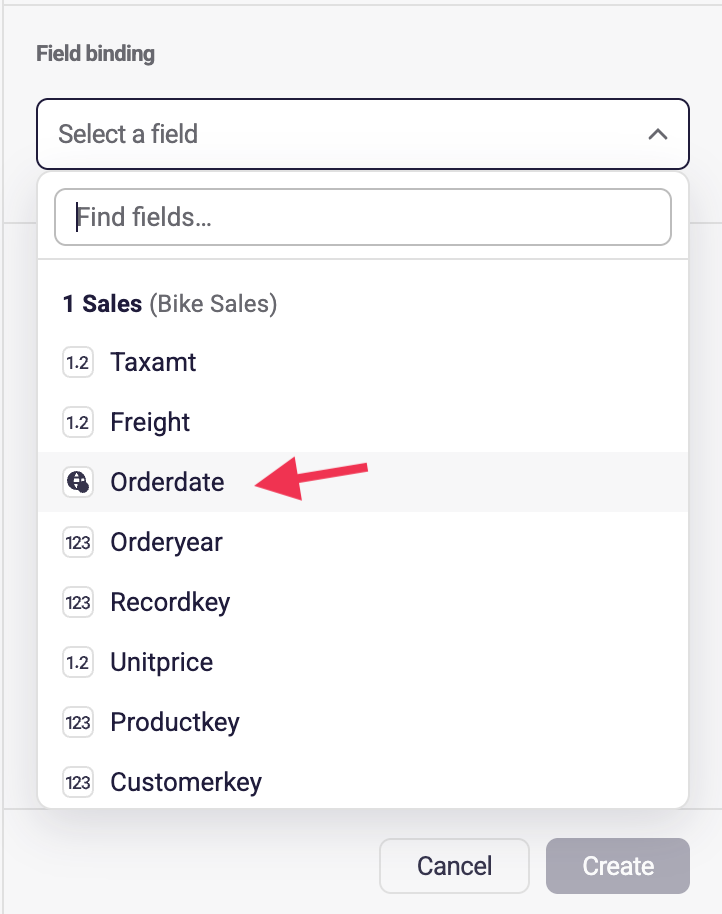
Step 4: Under Field binding, choose the column it comes from. The list is grouped by table, with a search box for larger models, and each entry shows its data type.
Step 5: Choose a Format if the values need one — dates and numbers usually do. It appears as a chip you can remove again.
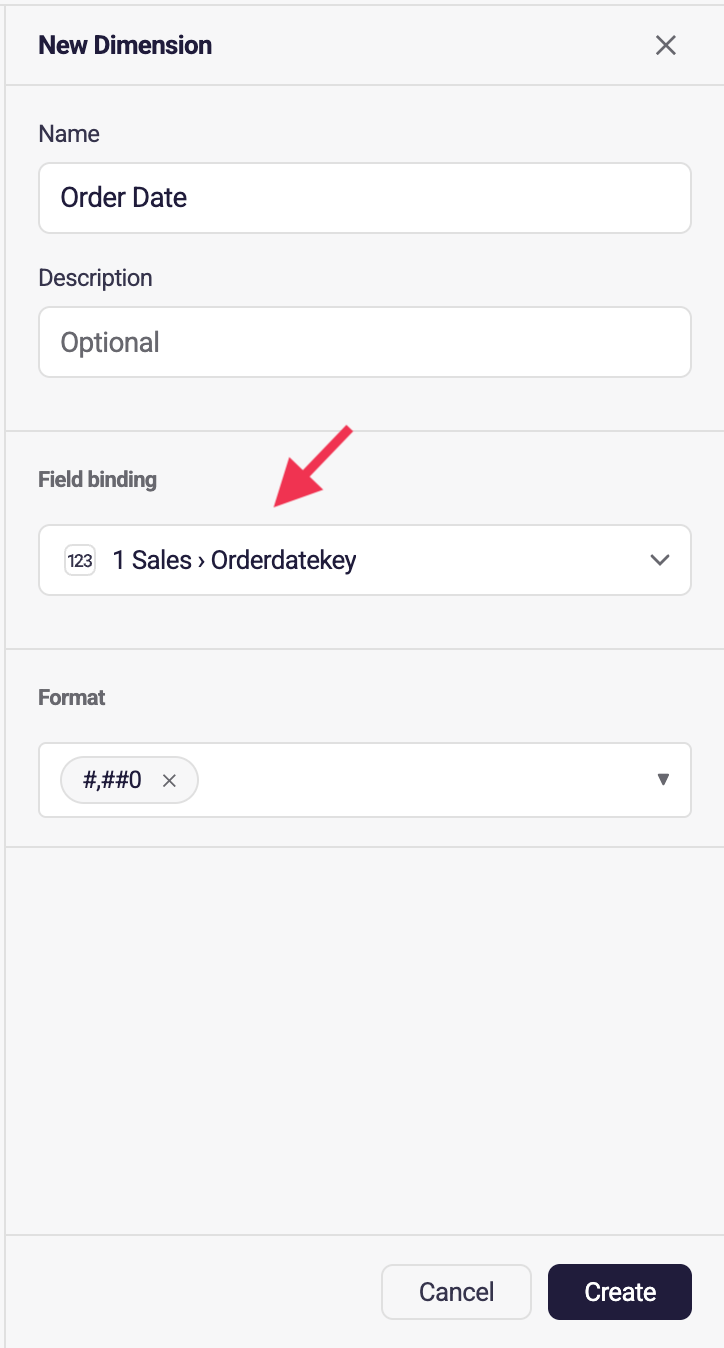
Step 6: Click Create.
Create a drill-through
Section titled “Create a drill-through”A drill-through is a path — a set of dimensions in order, so someone can start at the top level and step down into detail. Region to country to city, say, or category to subcategory to product.
Step 1: Choose Create → Drill-through.
Step 2: Name it for the journey rather than any one level — Product hierarchy rather than Category.
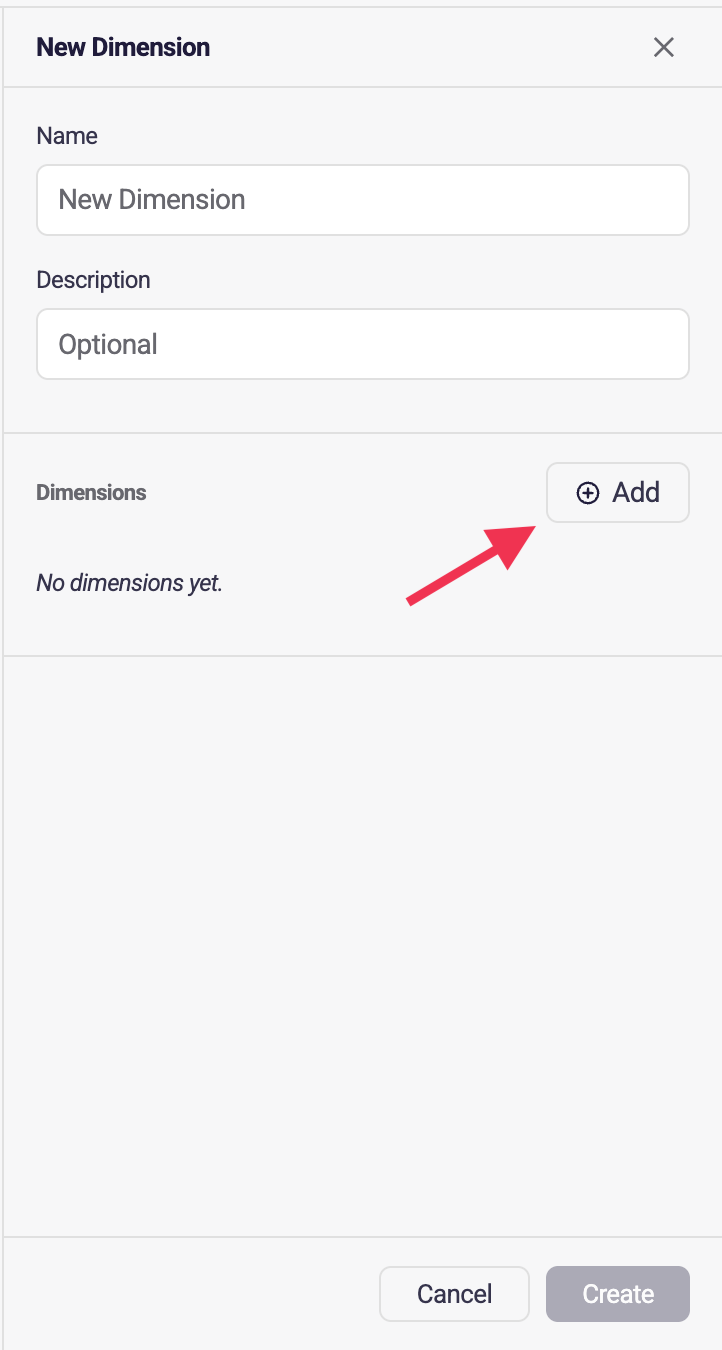
Step 3: Click Add and pick the first level.
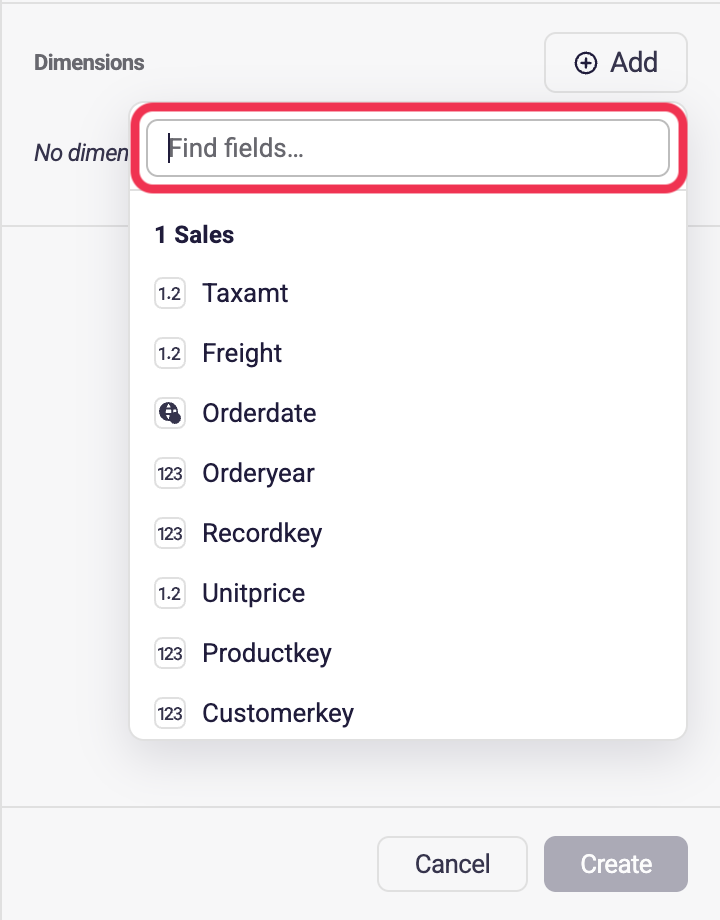
Step 4: Keep adding levels. The order matters — it’s the order people will travel through, from broadest to narrowest.
Step 5: Click Create.
Create a bucket
Section titled “Create a bucket”A bucket groups a continuous number into bands: age groups, price brackets, order-size tiers. It turns a column of numbers into a handful of readable categories.
Step 1: Choose Create → Bucket.
Step 2: Name it and describe it.
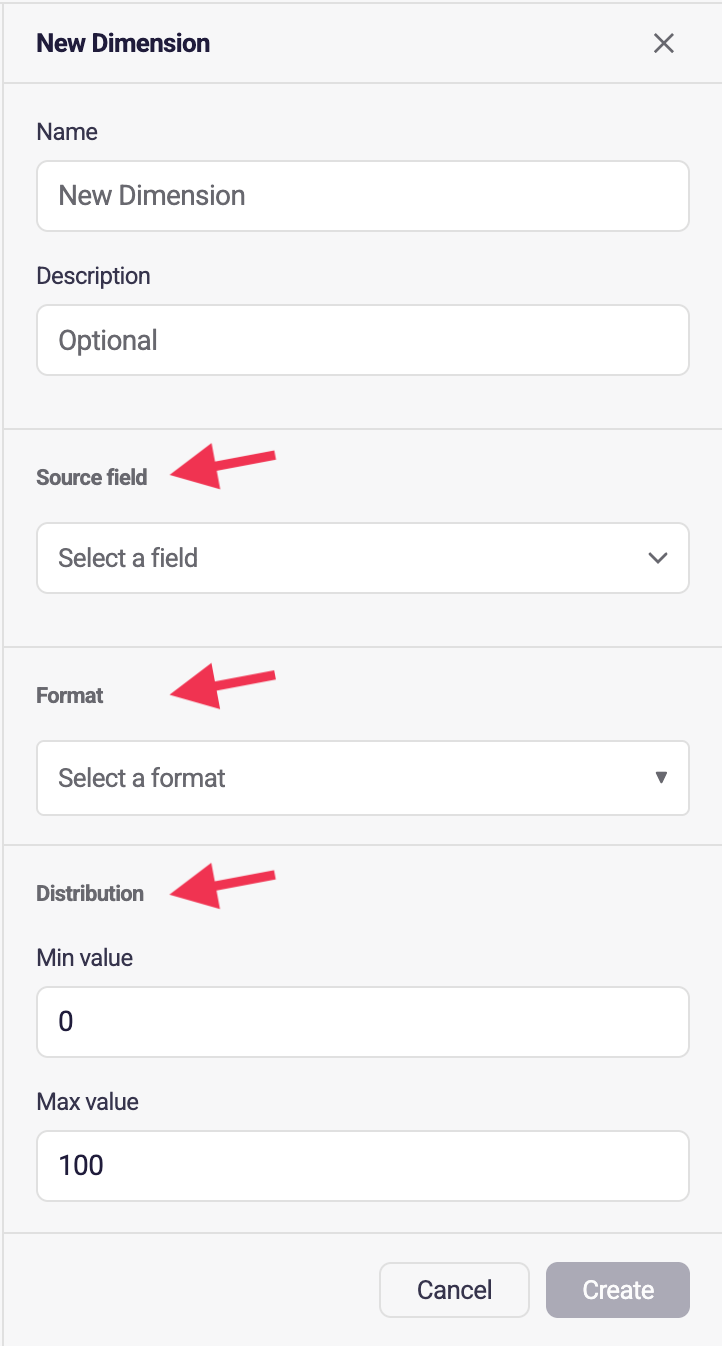
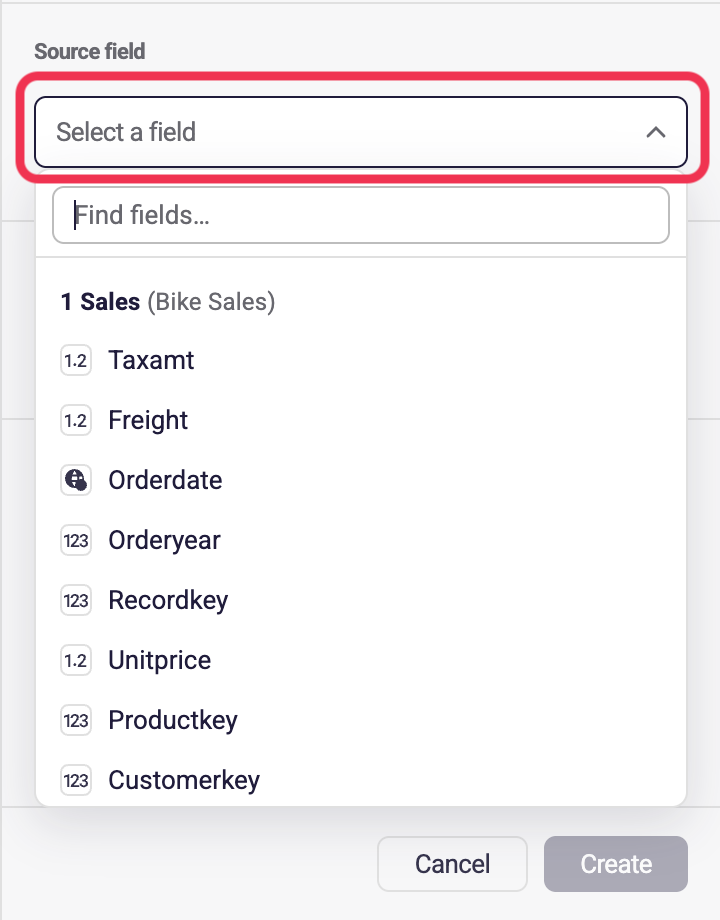
Step 3: Pick the Source field — the number you want banded.
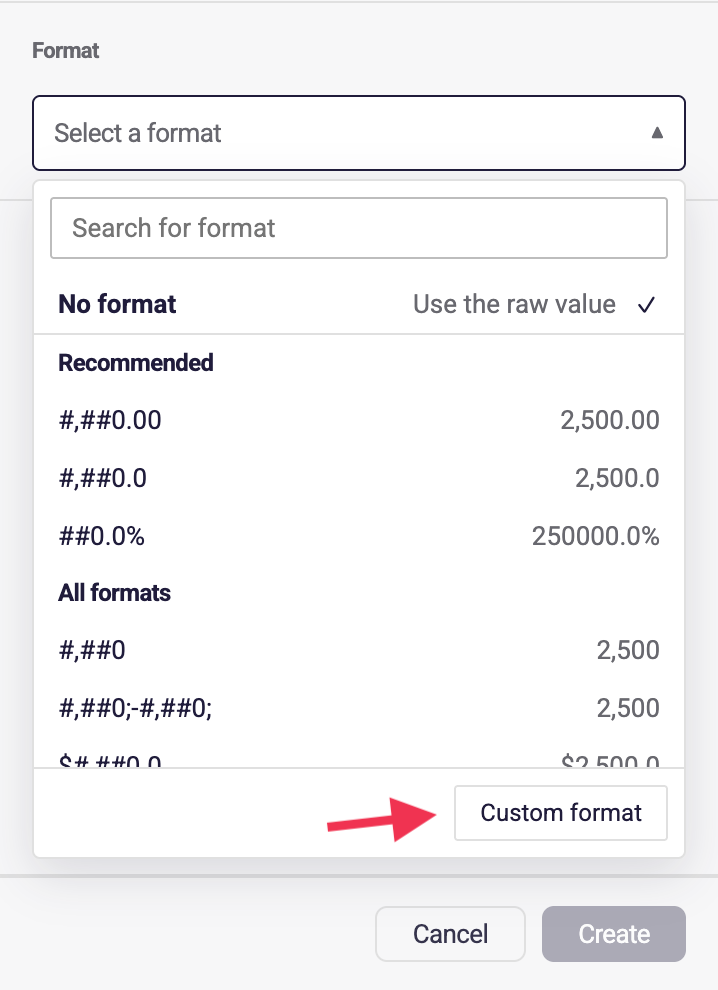
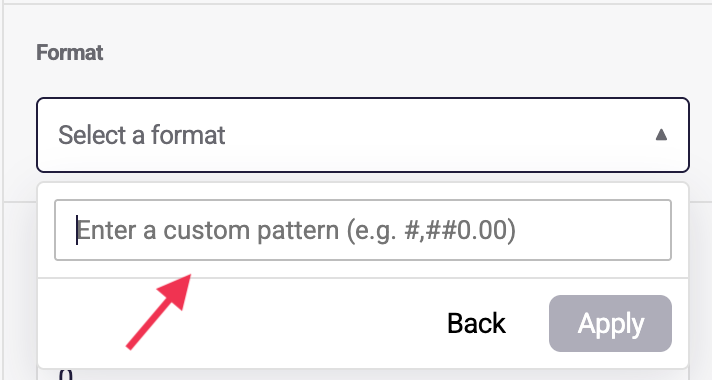
Step 4: Choose a Format for how the band labels appear. Each option shows you a live example, so you can see the result before choosing. No format uses the raw value, and Custom format is there if none of the presets fit.
Step 5: Set the Distribution — the Min value and Max value the bands should span.
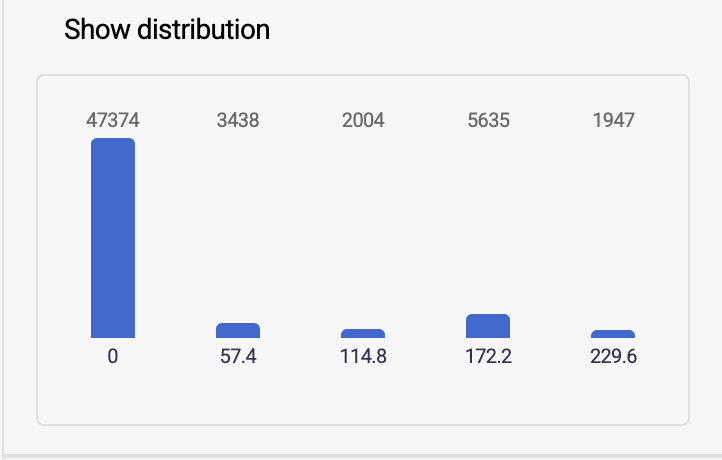
Check your bands before you commit. Use Show distribution to see how many rows land in each band. If nearly everything piles into the first bar, your ranges don’t match your data and the dimension won’t tell anyone much.
Step 6: Click Create.
Create custom groups
Section titled “Create custom groups”A bucket cuts a number into even bands. Custom groups do the job a bucket cannot: they put the values of a field into groups you define yourself, by rule — sites into regions, status codes into “Open” and “Closed”, countries into sales territories. The result behaves like any other dimension, so every question can break down by the same groups.
Step 1: Choose Create → Custom groups.
Step 2: Give it a Name and, if it needs one, a Description.
Step 3: Choose the Base field — the field whose values the rules classify. Nothing below it is editable until you do, because every rule reads this field.
Only a plain, existing column qualifies. Calculated columns are not offered, and neither are dimensions carrying a date level or date part, because the group stores the column underneath and that transformation would be silently dropped. Buckets, drill-throughs and other custom groups cannot be a base field either. By default the picker lists table fields; Settings → Custom groups can make it offer dimensions as well, as described below.
Choosing the base field on an empty dimension creates your first group row, ready to name.
Step 4: Set Returns — the data type every group value and the fallback must be. A group whose value is not that type blocks publishing, so choose it before naming many groups.
Step 5: Name each group and give it a condition.
Type the group’s name in the Group name box, then set the condition beneath it: an operator and its value, read against the base field. For a condition those boxes cannot express, turn on Advanced and build it in the full filter editor. Rules that already say more than the simple boxes can show open in Advanced with the control locked on.
Rules read only the base field’s own table. The generated column belongs to that table, so the pickers offer its fields and nothing else.
Step 6: Add the rest with Add Group, and put them in the order you want them read.
Order decides the answer. The rules are evaluated top to bottom and the first match wins, so a row that satisfies two rules is counted only under the higher one. Put your most specific rules above your general ones. Reorder with the up and down arrows on each row, or drag a row by its handle.
Step 7: Set Everything else — the value for rows no rule matched. Leave it empty and those rows return null; name it, for example “Other” or “Unclassified”, and they return that instead.
Check your groups before you commit. Use Show distribution to count the rows in each group without publishing anything. It shows each rule only the rows no rule above it took, so it is also how you catch a rule that a broader one above has swallowed. The button needs a complete, named group and a live data connection.
Step 8: Click Create.
Changing the base field later keeps your work: a simple rule follows the new field and its values
are retyped for it, so "100" on a text field becomes 100 on a numeric one. A rule built in the
advanced editor keeps exactly what it says, and is marked unreachable where it reads a field the
new base field’s table does not have.
Publishing is blocked until the dimension has a base field, at least one group, and group values matching Returns. Semantic layer issues lists what is outstanding.
Choose the options for custom groups
Section titled “Choose the options for custom groups”In Settings → Custom groups, choose what the Base field picker offers:
- Leave Show dimensions as options off to choose from table fields.
- Turn it on to list eligible dimensions before the table fields.
- Also turn on Show only dimensions to hide the table fields. This option is available only while Show dimensions as options is on.
Both options are off by default and are saved for the semantic layer. Turning the first option off also clears the second.
Only dimensions backed by a single existing, non-calculated field without a date transformation are offered. Buckets, drill-throughs and other custom groups cannot be used as the base field.
Choosing a dimension stores its underlying table field. The closed picker shows that table and field, so two dimensions backed by the same field produce the same selection. Renaming or deleting the dimension you chose does not change the group’s field binding. These settings control the picker options; they do not restrict document editing or agent authoring.
Custom-group rules preserve physical column names, including case, spaces and punctuation. References use your data source’s identifier escaping.
Create a sets dimension
Section titled “Create a sets dimension”A sets dimension groups an answer by stored set filters: each value is one set, such as “High spend” or “Repeat buyers”, and a member of several sets appears under each. In Dimensions, select Add → Sets, then choose the set filters under Add and, optionally, a label for each. Set filters must be created first, in Business Context → Set Filters.
Use a sets dimension like any dimension in the Data Explorer and in Business Questions. It is available where Business Questions are, with these limits:
- It is not available in workbooks.
- Answers currently show each value as an identifier made from its label, for example
Repeat_buyersfor “Repeat buyers”. - You cannot filter on it; filter with one of its set filters instead.
Deleting a set filter removes it from the sets dimensions that use it; a sets dimension left with no sets is deleted.
Create a time intelligence axis
Section titled “Create a time intelligence axis”A time intelligence axis is the period an answer is laid out along, so that a measure can compare each period against the one before it. It appears in the Create menu as Time intelligence axis when period-over-period analysis is enabled for your tenant; if you do not see it, ask your Astrato contact whether it is available to you.
Choose Create → Time intelligence axis, name it, then set Period and grouping: the Type of axis, the Period it covers, and the Unit and Offset that position it.
Period axes and comparisons is the full reference for what each setting means, which comparisons a period axis supports, and how to query one.
After you create a dimension
Section titled “After you create a dimension”Your dimension appears in the list with its source underneath — here 1 Sales › Orderdatekey — along with when it was last changed and by whom.

The toolbar above works like the one on Measures: search by name, filter by type, and switch the view picker to Group by type when the list grows.
If a dimension has a display label, the list shows the label in place of its name. Search matches both, and hovering the row shows the label with the name beside it. In the panel, Display label is the first row under the name, with the Use display label switch.
The panel is titled with the dimension’s kind, as the Add menu names it: Field dimension, Drill-through dimension, Bucket dimension, Custom groups dimension, Time intelligence axis or Sets dimension. When you change a dimension’s name, the panel says Renamed from the old name until you click Update, and while any change waits for Update the title and the row carry a small dot.
A time intelligence axis keeps its settings in two sections: Date sources, then Period and grouping, which reads in order the type of period, the period itself, the date it is read as of, and the level it is grouped by. A source has a remove button beside it only when the axis has more than one.

The ⋮ menu on each row offers the same actions as a measure, including Show on map:
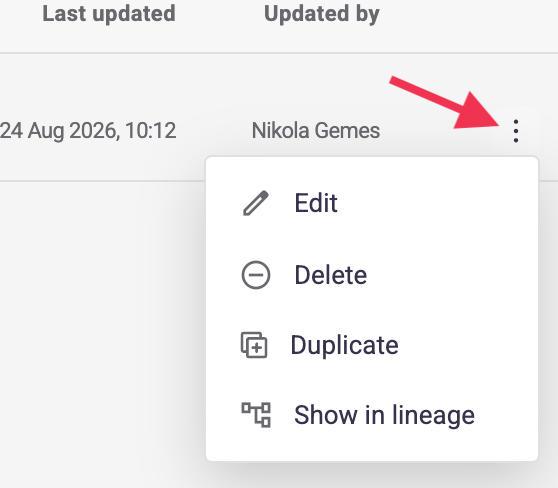
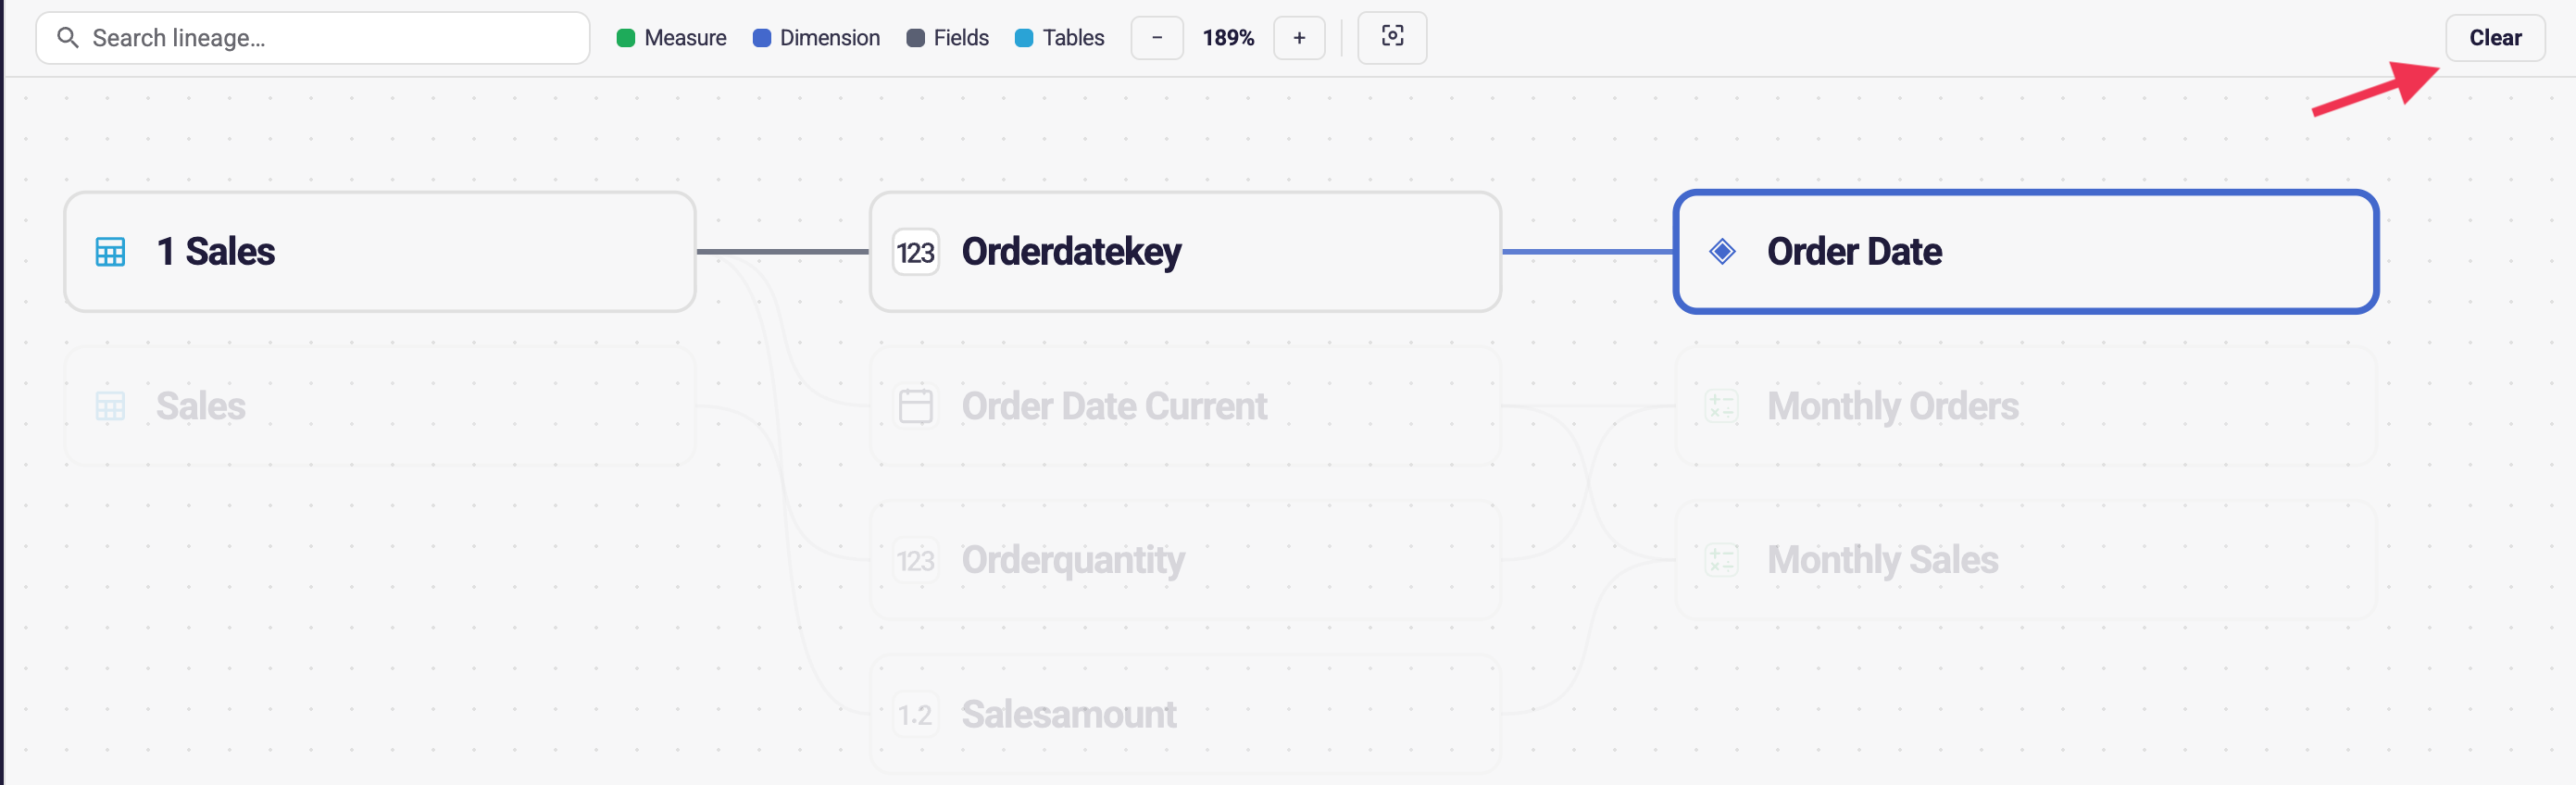
Show in lineage is the useful one. It opens the graph with your dimension highlighted and everything unrelated faded out, so you can see at a glance which table and field it rests on. Clear returns the graph to normal.
Filter by a dimension in Data Explorer
Section titled “Filter by a dimension in Data Explorer”Once published, a dimension is also a filter subject in Data Explorer. Open Filter, click Add filter, and the field picker lists your dimensions first, under Dimensions, ahead of the table columns.
Pick one and the value list fills from the dimension itself: a field dimension lists the values of the column it reads, and a bucket or grouped dimension lists the bands or groups it computes, so what you pick is what the filter matches. A drill-through spans several columns and has no single value list, so its value is typed instead.
Save your new dimension
Section titled “Save your new dimension”Nothing is created until you click Create, and Cancel backs out cleanly.
A new dimension goes into your working copy. It doesn’t reach anyone else’s workbooks until you publish, and it’s undoable through version history — see How versioning works in the semantic layer.
Tip: name a version before adding several dimensions at once. It gives you one clean point to return to if the set isn’t what you wanted.