

Layout and responsiveness
This page belongs to Data App developer guide. It covers the page around your visualizations; how a single object sizes itself is in Mounting objects.
Choose the page structure through Choose a layout, then use this page to size it and adapt it to different window widths.
Overview dashboard defaults
Section titled “Overview dashboard defaults”Unless the brief calls for a scrolling story or another layout, an overview dashboard uses the available desktop viewport. Keep the header and controls stable, give chart rows the remaining height, and bound a detail table inside its assigned row. More table records must not make the page taller or take height from the charts.
Unless the brief specifies other targets, check the overview at 1440 × 900 and 1366 × 768 CSS pixels. Plan the visible content to fit those sizes before calculating the scrolling threshold. A tall threshold chosen to accommodate every detail is not a substitute for prioritizing the overview; move secondary detail out first. Narrow screens and genuinely short windows can stack and scroll deliberately.
- Use one height budget for the page. Pass the remaining space through flex or grid items with
min-height: 0; useminmax(0, Nfr)for rows that share it. - Stretch cards and their hosts into the allocated areas. Preserve intentional gutters and readable proportions; remove blank bands caused by conflicting heights or extra wrappers.
- Keep the table’s scrolling inside its allocated region. If the mounted table already owns its scrolling, do not add a second scrollbar around it.
- When the available width or height cannot support readable plots, reflow and deliberately allow page scrolling. Derive this threshold from the content’s minimum sizes, including wrapped controls and additional rows. Table row count is not a scrolling threshold.
- If too much content competes for the overview, move secondary detail into tabs or a detail page. Do not clip content or shrink labels to conceal overflow.
Write these choices in the page brief, then verify them with layout geometry checks.
Choose a strategy
Section titled “Choose a strategy”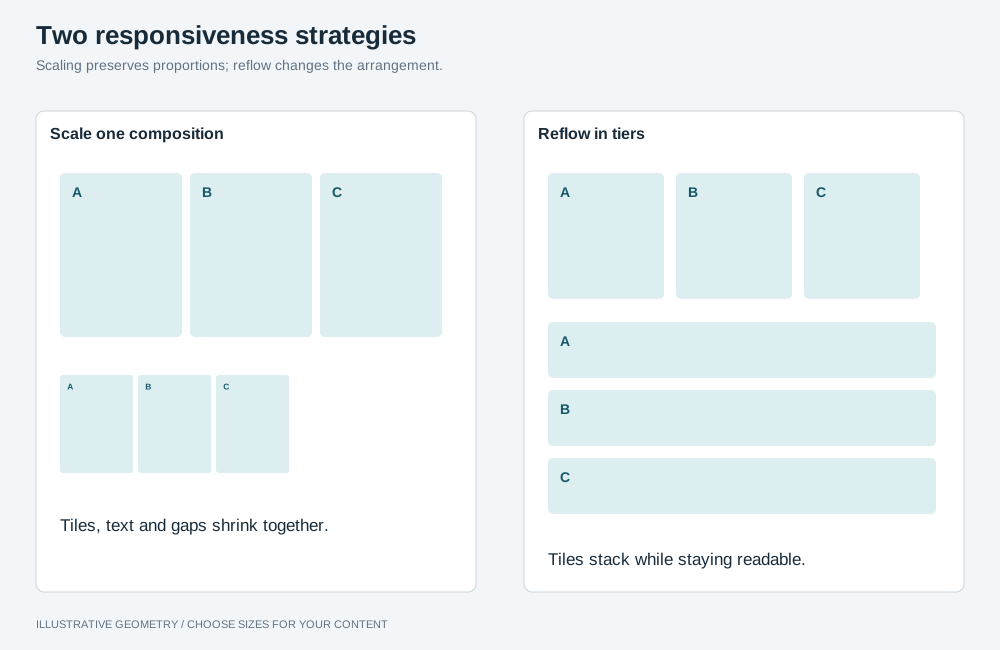
Illustrative geometry. Scaling preserves one composition within its supported range. Tiered reflow rearranges objects so labels and controls keep a readable size.
Scale one composition
Section titled “Scale one composition”Draw the design once at a reference size and express every length as a fraction of the root unit. Scaling that unit zooms everything at once, so a card, a heading and a gutter keep the same share of the screen at any size.
/* * Drawn once at 1659x861: 0.9644vw = 16 / 1659, 1.8583svh = 16 / 861. * min() follows whichever axis is tighter, so a wide-but-short window scales down instead of * overflowing. The clamp bounds the root font size. */html { font-size: clamp(10px, min(0.9644vw, 1.8583svh), 27px);}Then write every length below in rem. Derive the two coefficients from the reference size you
actually designed at; do not copy these numbers.
- Use
svh, notvh. On mobile browsersvhincludes the retracting toolbar, so the composition jumps as the toolbar hides. - Box a hero image with
svharithmetic rather than100%, so a parent that has not resolved yet cannot crop it. - Keep one breakpoint at the bottom of the range, around 1100px, where columns stack and the scroll region changes. Choose the breakpoint for your layout and test it on mobile.
Reflow in tiers
Section titled “Reflow in tiers”Objects keep a readable size and the grid changes how many sit in a row. The rest of this page is about this strategy, which suits most dashboards.
Reflow rules
Section titled “Reflow rules”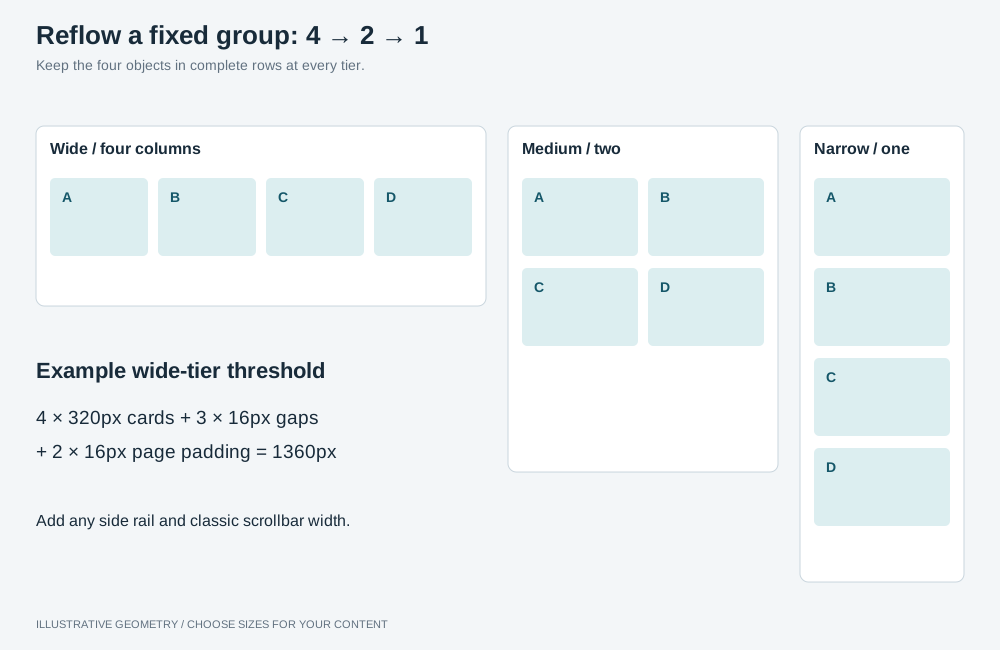
Illustrative geometry. Keep fixed groups in complete rows. The example 1360px threshold accounts for four 320px cards, three 16px gaps and 16px padding on each side; adjust it to the content.
Use complete rows for fixed groups. Choose column counts that divide the object count: four
charts can use 4 → 2 → 1 columns, and eight cards can use 8 → 4 → 2. An auto-fit grid can leave
an incomplete last row.
Choose breakpoints for readability. Reduce the column count when labels truncate or legends need scrolling. For example, four charts across a 1280px viewport each get less than 320px after accounting for gaps and padding.
Calculate when scrolling is needed. For example, a 200px plot plus 52px of title and padding needs 252px. If that row gets 30% of the board, the board needs at least 840px, plus space outside it for the header and filters. Set a scrolling threshold from your layout’s minimum sizes and document the calculation beside the CSS rule.
Set minimum row heights for a stacked layout. Once the page deliberately becomes the scroller, allow space for every row. When four charts fold into two rows, a minimum sized for one row will compress them. These example minimums belong to the scrolling tier, not the overview height budget:
@media (width >= 1280px) and (height < 728px) { /* four across: one row of charts, one of cards, one detail row */ .board { grid-template-rows: minmax(252px, auto) minmax(112px, auto) minmax(240px, auto); }}@media (width < 1280px) { /* folded: two rows of charts and two of cards */ .board { grid-template-rows: minmax(504px, auto) minmax(236px, auto) minmax(240px, auto); }}Size detail rows for their content. In a scrolling layout, give a Sankey or wide table enough height for its labels and rows to remain readable. Start with roughly twice the height it had in the fixed-height layout, then adjust to fit the content.
At the narrowest tier, interleave. Show one chart, then the cards that belong under it, then the next chart. The most robust way is to put each chart and its cards next to each other in the DOM, so the visual, reading and keyboard orders agree at every tier.
If the charts and cards must stay in separate containers, you can lift their children into the
board’s grid with display: contents and order them there. order changes only the visual order:
screen readers and keyboard focus still follow the DOM, so the cards are announced after all the
charts. Use it only where that mismatch is acceptable, for example when the cards are not
focusable.
/* Two charts with two cards each. Give every chart and card an order value, or unmatched items keep order 0 and jump to the front. */@media (width < 700px) { .board { grid-template-rows: none; grid-template-columns: repeat(2, minmax(0, 1fr)); } .charts, .kpi-row { display: contents; } .chart-frame { grid-column: 1 / -1; } .chart-frame:nth-child(1) { order: 0; } .kpi:nth-child(-n + 2) { order: 1; } .chart-frame:nth-child(2) { order: 2; } .kpi:nth-child(n + 3) { order: 3; }}Choose what scrolls
Section titled “Choose what scrolls”Decide for each layout whether the page scrolls, an object scrolls inside its frame, or both, and size the frames to match.
- An overview mixes charts and a detail table: above its measured scrolling thresholds, the page does not scroll. Give the chart and table rows shares of the available height; the table scrolls inside its share. See Overview dashboard defaults.
- One object fills the window, as in table-first,
master–detail or a financial statement: the page does not scroll.
Make the page exactly the height of the window, pass the remaining height down a chain of flex or
grid items with
min-height: 0, and putoverflow: autoon the object’s frame alone. - Sections stack, as in long-form or several tables above a chart: the
page scrolls to reach the next section, and a table can also scroll inside a fixed-height frame.
Keep each frame clearly shorter than the window, for example
height: min(60svh, 520px), so part of the page stays visible around it and the reader can tell the two apart. Leave wheel scroll chaining on (nooverscroll-behavior: contain), so the page continues once a table reaches its end. - Avoid a frame that fills the window inside a page that also scrolls. The reader gets a scrollbar beside a scrollbar, scrolling the page moves the frame’s header out of view, and the wheel moves whichever of the two is under the pointer.
The layout where one object fills the window:
html,body { height: 100%; /* The default 8px body margin alone makes a 100dvh page overflow. */ margin: 0;}.app { /* Header, controls and tabs keep their height; the panel takes the rest. */ display: flex; flex-direction: column; height: 100dvh;}.panel { display: flex; flex: 1 1 auto; flex-direction: column; /* Without min-height: 0 a flex item will not shrink below its content, and the page scrolls. */ min-height: 0;}.table-frame { flex: 1 1 auto; min-height: 0; overflow: auto;}/* Below this height a table frame is too short to read, so the page becomes the scroller. */@media (height < 640px) { .app { height: auto; } .table-frame { flex: none; height: 420px; }}Stacked sections, where the page scrolls and each table scrolls inside a shorter frame:
.section .table-frame { /* Shorter than the window, so the page around the table stays visible and reachable. */ height: min(60svh, 520px); overflow: auto;}Do not size a full-window scroller with a guessed offset such as max-height: calc(100vh - 260px). The bands
above it change height when labels wrap, a note appears or a breakpoint stacks the controls, and
the page then overflows by the difference. Let the layout give the scroller the height that is left.
When the page scrolls, make it obvious
Section titled “When the page scrolls, make it obvious”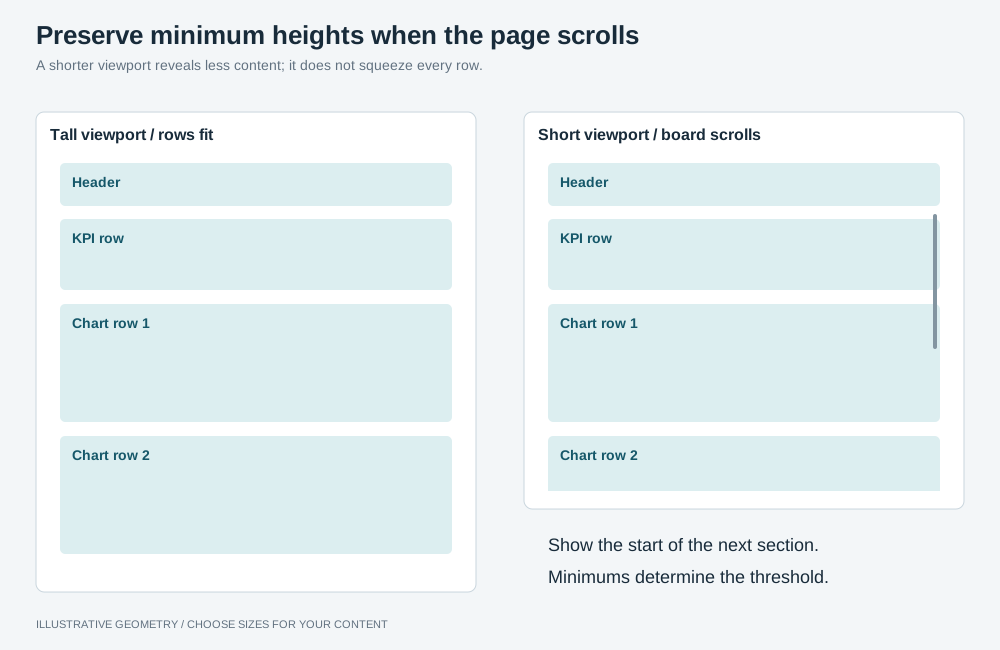
Illustrative geometry. Leave the next section partly visible to signal scrolling. Switch to an auto-height board when the header, bands, padding, row minimums and gaps no longer fit.
When the page is the scroll region, leave part of the next section visible to indicate that it continues. Scrollbars may be hidden until scrolling begins. For example, limit the first row’s height:
.board { /* 62svh leaves the top of the next row visible at any height, including behind a mobile toolbar; the cap stops a tall window stretching the first row without limit. */ grid-template-rows: min(62svh, 640px) auto auto;}Fill the space
Section titled “Fill the space”If an object does not fill its grid area, check these sizing constraints.
- The item did not stretch. A grid item stretches to its row by default, so a
max-heightof its own is usually what stopped it. - The inner rows have no definite height.
frrows only resolve against a definite height. In anauto-height container they fall back to content size, and a child sized in percentages feeds back into that: cards whose sparkline washeight: 100%can resolve to a column thousands of pixels tall. Give the containing row a real height. - Check what the cards are children of. A row that renders its own wrapper
(
.rail > .kpi-row > .kpi) means a row template written on the area sizes the wrapper, and every card sits at its minimum inside it. That looks exactly like the item not stretching.
Size type against the object, not the viewport
Section titled “Size type against the object, not the viewport”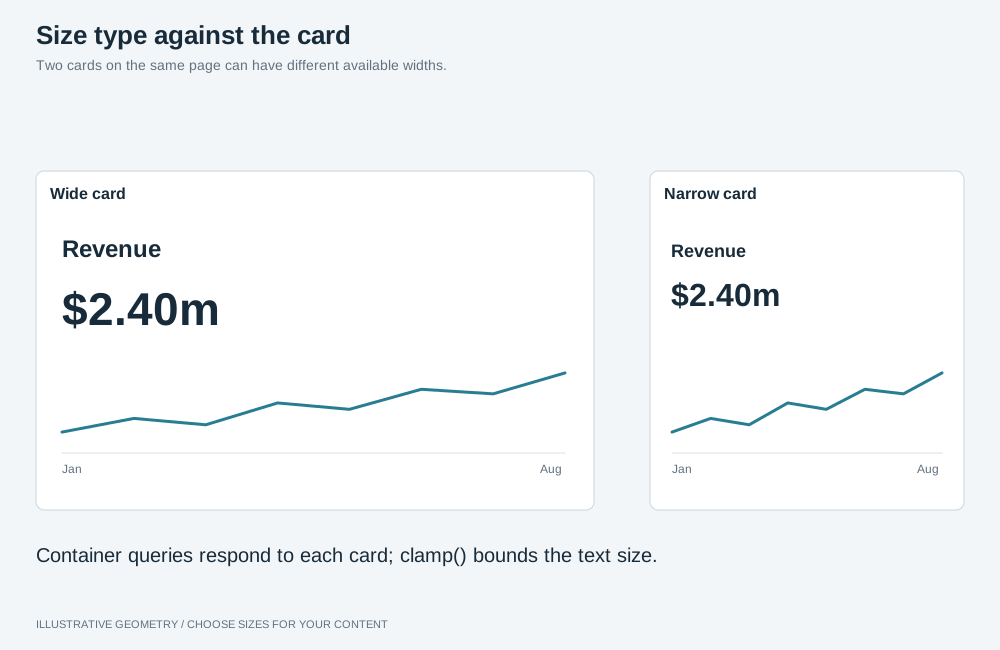
Illustrative geometry. Use each card’s width to size its text, with explicit lower and upper bounds. The grid row still determines the card’s height.
Use container queries to scale text with the card’s width:
.kpi { container-type: inline-size; /* A container cannot query itself, so its own padding uses the viewport. */ --kpi-pad: clamp(10px, 0.6vw, 20px);}.kpi-value { font-size: clamp(17px, 14cqi, 46px);}.kpi-label { font-size: clamp(12px, 7.5cqi, 24px);}.chart-frame { container-type: inline-size;}.chart-title { font-size: clamp(13px, 4.2cqi, 26px);}container-type: inline-size contains the inline axis only, so the element’s height still comes
from its grid row — which is what you want for a grid item.
Keep proportions fixed inside a card
Section titled “Keep proportions fixed inside a card”To reserve 45% of a card for figures and 55% for a sparkline, group the label, value and delta in one element and use proportional grid rows:
.kpi { display: grid; /* A bare fr is minmax(auto, fr) and would let the figures exceed their share. */ grid-template-rows: minmax(0, 45fr) minmax(0, 55fr);}A panel’s height must not follow its data
Section titled “A panel’s height must not follow its data”Text from a model ranges from a few characters to a paragraph. A panel sized to its content changes
height with every record and moves everything above it as the reader browses. Fix the height, clip
what does not fit, and show the full count in the heading (ABILITIES 13).
Put the height on exactly one element
Section titled “Put the height on exactly one element”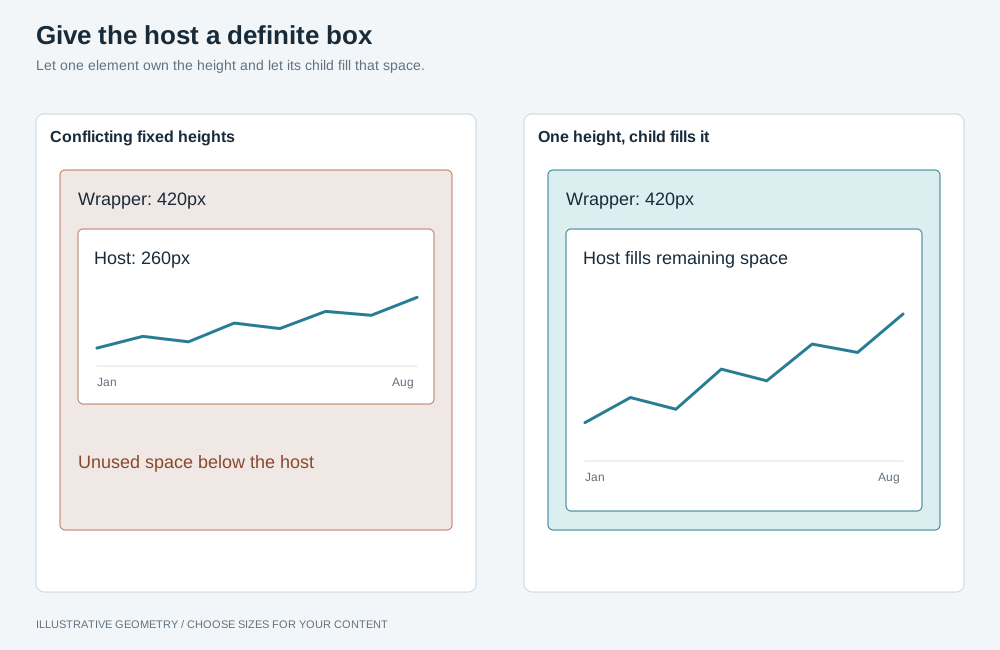
Illustrative geometry. Set the height on one element. Give the host a non-zero, resolved size before mounting, and let it fill the available space.
A wrapper at 420px around a host at 260px leaves the object measuring the host and stranding blank space below it; the reverse clips. Give the height to one of them.
Give each host a non-zero size before mounting. Visualizations that observe their containers with
ResizeObserver also respond to layout changes such as a sidebar collapsing; they do not require
synthetic window resize events. See Container sizing.
Grid traps
Section titled “Grid traps”- Always
minmax(0, Nfr). A barefrisminmax(auto, fr): a row whose content is taller than its share refuses to shrink and takes the difference from its neighbours. - Give every box in a shrinking grid
min-height: 0, or it refuses to go below its content and pushes the page taller than the viewport. - A fixed-height grid row cannot size an image that is also sizing the row. State the height.
- Pin the row count to the full set when a grid can be filtered, so filtering empties rows instead of stretching the survivors across the panel.
- Use matching tracks for grids that should align. Keep column proportions and breakpoint
changes consistent between them. For example, a board at
2fr 1frand a charts row atrepeat(3, 1fr)place their internal column edges differently. getComputedStyle().gridAreareturns the area name when a grid places by named areas. To split or insert a track, measure each child against the container’s track offsets to recover line numbers, then dropgrid-template-areas.
Images: fit the subject, not the file
Section titled “Images: fit the subject, not the file”Images with identical file dimensions can have different amounts of empty space around the subject.
Measure each subject’s opaque bounds and size the artwork from those bounds, so object-fit: contain
does not make subjects with more surrounding space appear smaller. If the image host does not permit
cross-origin pixel access, perform the measurement as a build step and store the bounds with the app.
Bound the result on both axes, and express the width bound against the height
(--art-w: calc(var(--art-h) * 0.8)) rather than in rem, which follows whichever viewport axis
is tighter.
Header and controls
Section titled “Header and controls”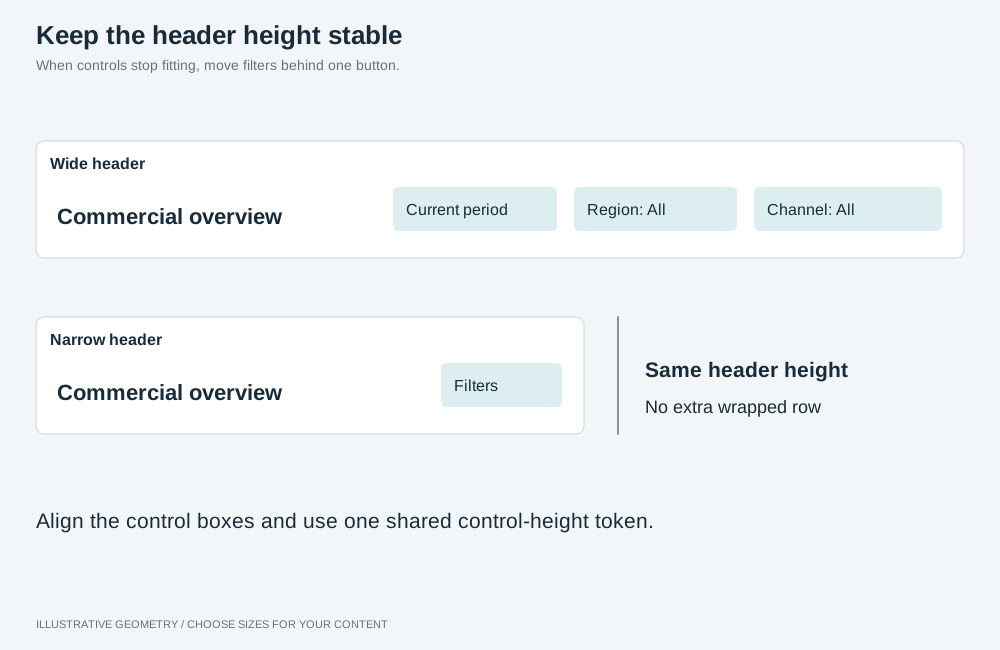
Illustrative geometry. Measure the spare header width and fold filters into a panel when needed. Align controls by their boxes and give them a shared height.
-
Keep the header a fixed height at every width. A header that wraps takes its second row out of the board. Move the filters behind one button when the spare width runs out, measured from the header rather than from a breakpoint.
-
Use one height token for every control in it, for example
--header-control: 36px. -
Align a row of controls by their boxes:
align-items: center, notbaseline, which aligns the text and sits taller labels lower. -
Declare shared control geometry once, after the individual rules, and let each control keep only what distinguishes it:
.filters-trigger,.period-trigger,.settings-trigger {align-self: center;height: var(--header-control);padding: 0 12px;border: 1px solid var(--control-border);border-radius: var(--radius);font: 600 13px / 1 var(--font-ui);} -
Size a filter object’s host, not the filter. A filter object’s responsive sizing derives the control’s height from its container and can land well short of it. Turn responsive sizing off and give the host the height you want.
-
Make the header and filter bar one sticky block, with the container’s padding cancelled by negative margins, or the board shows through the gap between them.
-
Let the brand shrink with
flex: 0 1 auto; min-width: 0; text-overflow: ellipsis, and measure before concluding it is clipped.
CSS rules that fail silently
Section titled “CSS rules that fail silently”A media query adds no selector specificity. With equal specificity, the later declaration wins. Place breakpoint overrides after the corresponding base declarations.
Never set display on a <dialog> unqualified. The user-agent sheet hides a closed dialog with
dialog:not([open]) { display: none }, which an author display rule can override. Scope display
rules to open dialogs so closed dialogs remain hidden:
.insights[open],.data-table-dialog[open] { display: flex; flex-direction: column;}A custom property resolves its var() references where it is declared. A formula on :root
that reads a property you set per element uses :root’s value. Declare the formula on the element
that uses it. A percentage
inside a custom property resolves against the axis it is used on, so state cross-axis formulas in
svh or vw.
transform is one property. An entry animation’s keyframes replace a placement translateX()
for the duration of the animation. Put placement on a wrapper.
Use :where() for general rules that should have zero selector specificity and be easy to override.
Do not put a backtick in CSS held in a JavaScript template literal, even in a comment. It closes the literal.
Tokens and thresholds
Section titled “Tokens and thresholds”Every layout and component page builds on the tokens and base rules below; define them once. Colour, font, radius and shadow tokens belong to the style; see Theming.
| Token | Example | Sizes |
|---|---|---|
--gap |
16px | The gap between cards and the page padding on each side |
--header-h |
64px | The header at every width |
--header-control |
36px | Every control in the header |
--chart-min |
252px | The shortest card: a 200px plot plus 52px of title and padding |
--chart-min-w |
320px | The narrowest chart card; set it from what your charts need |
--kpi-h |
96px | A KPI card |
The .board fills the window below the header and the bands above it;
each .band is a row inside it.
:root { --gap: 16px; --header-h: 64px; --header-control: 36px; --chart-min: 252px; --chart-min-w: 320px; --kpi-h: 96px;}.board { display: grid; gap: var(--gap); height: calc(100svh - var(--header-h) - var(--above-board, 0px) - 2 * var(--gap));}.band { display: grid; gap: var(--gap); min-height: 0;}Keep a token that only one layout or component uses on that page, for example --list-w in
master–detail. Give each token name one meaning across the pages you
combine.
Bands above the board
Section titled “Bands above the board”A band between the header and the board, such as tabs or a filter bar, declares its own height
token. Set --above-board once, on the element that contains the header and the board, as the sum
of the bands the page uses; a component that sets it itself overwrites the others’ share.
.app { --above-board: calc(var(--tabs-h) + var(--filter-bar-h));}| Band | Adds to --above-board |
|---|---|
| Tabs | var(--tabs-h) |
| Filter bar | var(--filter-bar-h) |
| Metric switcher | var(--switcher-h) + var(--gap) |
| Item header | var(--item-header-h) + var(--gap) |
| Narrative summary | var(--summary-h) + var(--gap) |
Calculate a scrolling threshold
Section titled “Calculate a scrolling threshold”Apply Reflow rules with these tokens: add the header, the bands, the page padding, each row’s minimum and the gaps between rows. For a KPI row and two chart rows:
64 + 2 × 16 + 96 + 2 × 16 + 2 × 252 = 728Below a 728px window height, switch the board to height: auto. Recalculate when a band is added: a 36px metric
switcher and its gap raise the threshold to 780px.
Calculate a width breakpoint
Section titled “Calculate a width breakpoint”Add the cards at --chart-min-w, the gaps between them and the page padding. For four cards:
4 × 320 + 3 × 16 + 2 × 16 = 1360A media query’s width includes a classic scrollbar, so add its width on pages that scroll. Add a
side rail when the page has one.