

Explore a semantic layer in Data Explorer
Data Explorer answers a question from a semantic layer’s governed data without a workbook. You pick dimensions and measures, and it shows the result as a table or a chart. It is view only: nothing you do here changes the layer, and nothing is saved when you leave the page.
Open a semantic layer
Section titled “Open a semantic layer”Before you start: the layer must have something published, and you must be able to read it.
-
Open Analytics and select the Data Explorer tab. Viewers can also reach it from Data in the left rail where that item opens Data Explorer.
-
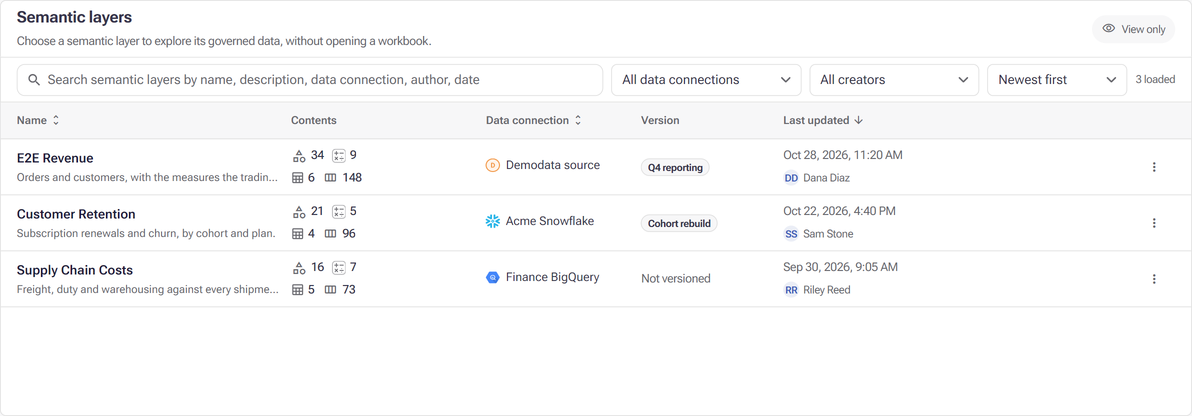
Under Semantic layers, find the layer. The search box matches names, descriptions, data connections, authors and dates, and All data connections and All creators narrow the list.
-
Select the layer’s row, or Explore in its menu.
A layer with nothing published is greyed out and cannot be opened; see Home and navigation for what it says and why.
There is no layer picker inside the explorer. To change layer, select the Data Explorer tab again.
What it reads
Section titled “What it reads”The badge above the explorer reads Published data · View only. Data Explorer queries the layer’s published version, so it lists the tables, fields, dimensions and measures that were published. Changes still in a draft appear once the layer is published; see Save and publish.
Choose dimensions and measures
Section titled “Choose dimensions and measures”The panel on the left lists the layer in three sections: Dimensions, Measures and Tables & Fields, which groups the raw columns by table. Search with the box at the top of the panel; tick Include table names to match table names as well.
- Select an item, or its +, to add it to the selection. Select it again to remove it.
- A column under Tables & Fields can be added as it is, or with an aggregation that you choose. The button on a table’s own row adds all its remaining fields.
- An item that is not joined to what you have already selected is greyed out. Hover over it to see which fields block it; remove those to use it.
Each selected item becomes a chip in the bar above the result:
- Drag a chip by its handle to reorder the columns.
- Use the switch (Hide from table) to leave a field out of the result without removing it.
- Use the sort button to sort by that field, and select it again to reverse the order.
- Use Remove (the cross) to take the field out.
Clear all removes every selected field, filter and setting at once.
Table or chart
Section titled “Table or chart”The visualization button opens a menu of Table, KPI, Bar, Line, Pie, Scatter, Heatmap, Waterfall and Combo.
Switch automatically, at the top of that menu, is on each time you open the explorer. While it is on, the explorer picks the type from what you selected:
| Selection | Shown as |
|---|---|
| One measure and no dimensions | KPI |
| Several measures and no dimensions | KPI, or Table if a table was showing |
| One date or timestamp dimension and at least one measure | Line |
| Anything else | Table |
Picking a type yourself turns Switch automatically off. A chart that needs more fields than you selected says what it needs, for example that a bar chart needs at least one dimension and one measure. A Bar chart offers Stacked or Grouped layout, and a Combo chart lets you draw each measure as a bar, a line or points, on the left or right axis.
Limit the rows
Section titled “Limit the rows”- Hide zero values leaves out rows whose measures are all zero. It does not apply to a KPI, a scatter or a waterfall.
- Top N keeps a number of rows, 10 to start with and up to 1,000. Top N options sets the Rank measure, whether to Keep the highest or lowest rows, and whether Show others gathers the rest into one row. A line under the controls says what the limit is doing, for example that it is not applied because the visualization has no rows to limit.
Filter the data
Section titled “Filter the data”Before you start: open a semantic layer in Data Explorer.
-
Select Filter above the result. A count beside it shows how many filters are active.
-
Under Filters, select + (Add filter) and choose a dimension or column. You can filter on any of them, not only those you selected.
-
Set the condition, then select Apply. Clear removes every filter.
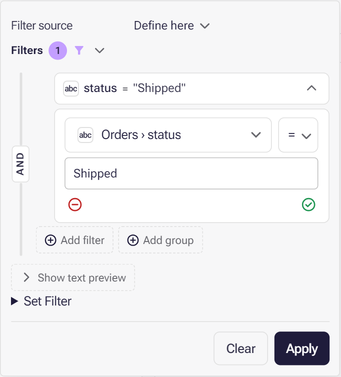
Where the layer has stored filters, Filter source lets you use one of them instead of defining the condition here (Define here).
You can also filter from the result: select values in the table or the chart, then Apply selections to turn them into filter conditions, or Clear selections to drop them. Applied selections appear in the filter list marked as selected in the table.
Answer a business question
Section titled “Answer a business question”Where business questions are available, Open a question lists the layer’s business questions, with a search box and a group filter. Choosing one runs it and replaces your chips with the question. To go back to editing the selection, remove the question with its cross: its fields return as chips.
Data Explorer cannot save a new business question or change an existing one. Questions are written in the semantic layer editor.
Download the result and see the query
Section titled “Download the result and see the query”- Download result as CSV (the download icon) saves the result as a CSV file, up to 100,000 rows. When a result is larger, the file holds the first 100,000 rows and its tooltip says so.
- View query insights opens Data query insights: the SQL that ran, with Copy SQL, how long it took, the result size and the query’s ID, and profile details from the warehouse where it provides them.
The footer under the result shows the query’s duration and how many rows came back.
What view only means
Section titled “What view only means”Data Explorer in Analytics is view only for everyone, whatever your role:
- You cannot create dimensions or measures, or edit a business question.
- What you select is not saved. Leaving the page or reloading it starts again from an empty selection.
- Where you can ask for edit access to the layer, Request edit access sends that request. See Review permission requests.
To change the layer itself, open it in the semantic layer editor, if you can edit it.
When a layer cannot be explored
Section titled “When a layer cannot be explored”- This semantic layer is empty: nothing is published yet. If you can edit the layer, Open the semantic layer takes you to the editor.
- Fix semantic layer issues to use Data Explorer: the published layer has blocking validation issues, which are listed. Open semantic layer to review issues opens the layer so that someone who can edit it can fix them.
- Data Explorer could not load the semantic layer: the layer could not be read. Reload the page to try again.
What next
Section titled “What next”- Business questions — how a question is stored and asked.
- Find a semantic layer — the Semantic Layers page, where authors open a layer in the editor.
- Home and navigation — the other tabs under Analytics.