

Mini charts (sparklines)
Highlighting trends made easy with mini charts
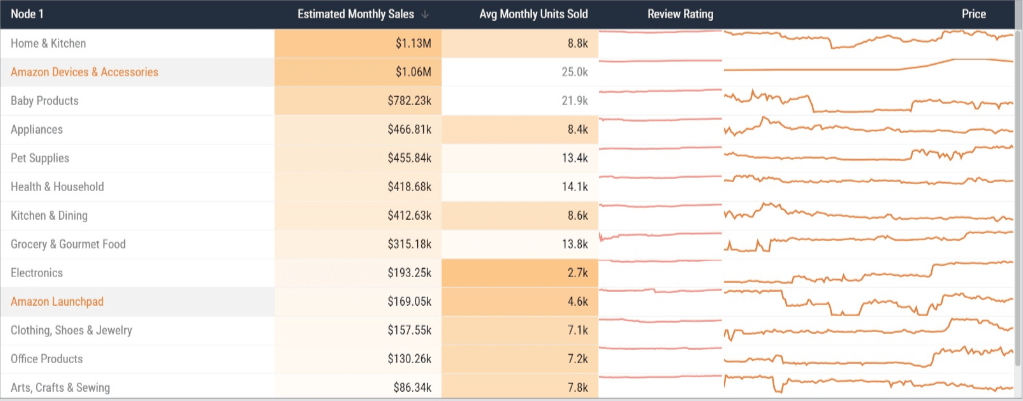
Section titled “Highlighting trends made easy with mini charts”Mini charts, also known as sparklines, are small, simple data visualizations that provide a quick and concise summary of data.
In conjunction with other data visualizations, mini charts are useful for highlighting trends and patterns in data. Mini chart types include bar charts and line graphs that show individual data points on each table row for a given measure.
Using mini charts
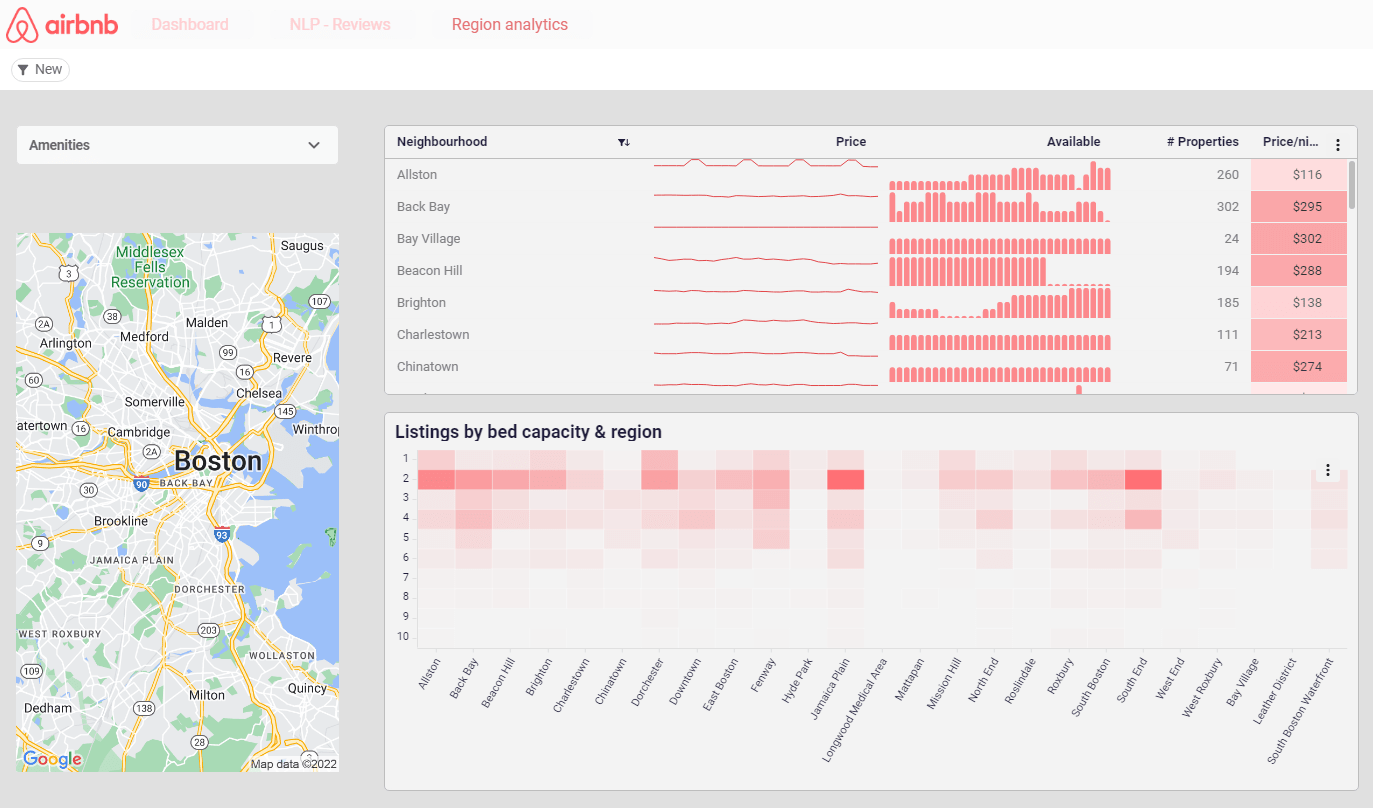
Section titled “Using mini charts”In the example below, mini charts add simple - and very useful - visuals to the table. The mini chart highlights property availability clearly and simply in the table itself - without needing a separate chart or data object.
Adding Mini charts
Section titled “Adding Mini charts”-
Click on your table object to view its properties.
-
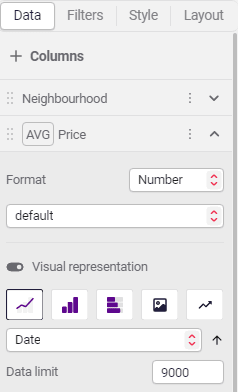
From the Data tab, click Columns to view your measures.
-
Slide the toggle beside the Visual representation slider to add mini charts, sparklines, and bars on each table row, for a given measure.
Styling mini charts
Section titled “Styling mini charts”When mini charts are added, the Style tab displays the formatting options.
The example below shows the style options for a bar chart, these include: chart type, color, and opacity to show negative bars, bar padding, bar radius, and its Y-axis start.
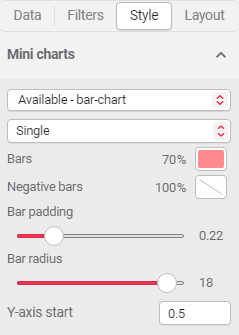
If several charts are added to the table (from various measure columns), they are displayed as options in the dropdown for you to select.