Multi-Measures Waterfall Chart
A multi-measure waterfall chart shows how a sequence of measures builds up a running total, in the order you add them, so you can see which measures contribute most to the result. It uses between one and one hundred measures and no dimension, which suits a profit and loss statement or a comparison of actuals against a target. To break one measure down by the values of a dimension instead, use a cumulative waterfall chart.
Building a Waterfall
Section titled “Building a Waterfall”Add a Waterfall Chart
Section titled “Add a Waterfall Chart”The waterfall chart is in the Bar charts section of the visualization list.
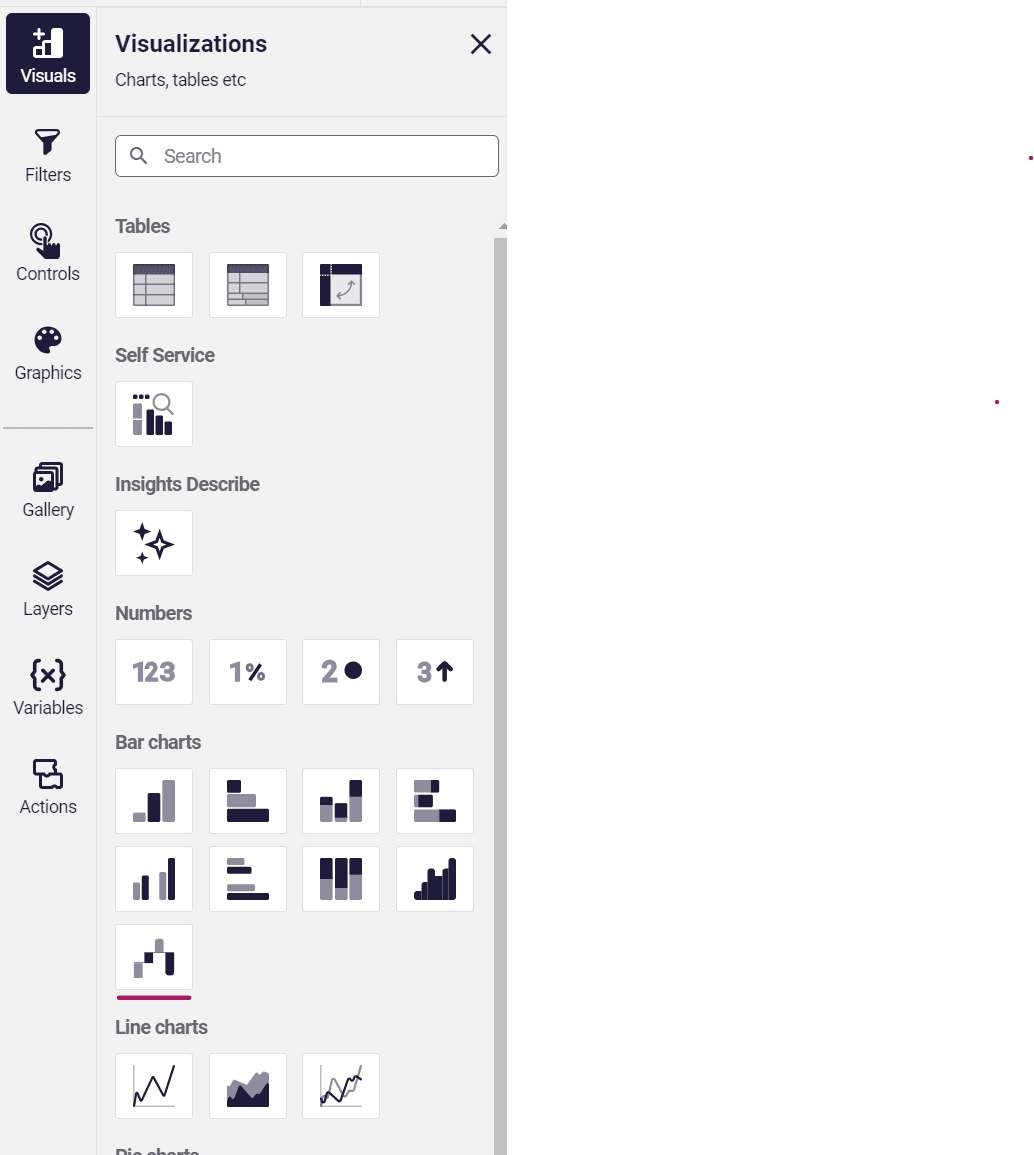
Define a Waterfall Chart
Section titled “Define a Waterfall Chart”Add the measures in the Data tab of the properties panel, in the order the bars should appear.
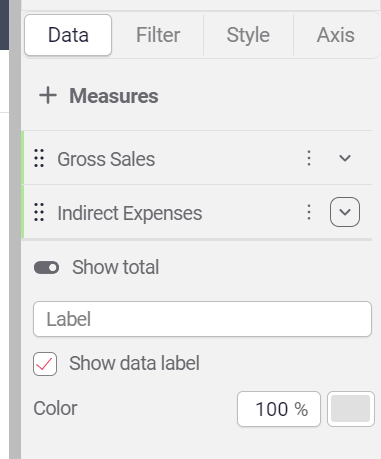
Measure settings
Section titled “Measure settings”Each measure has settings of its own:
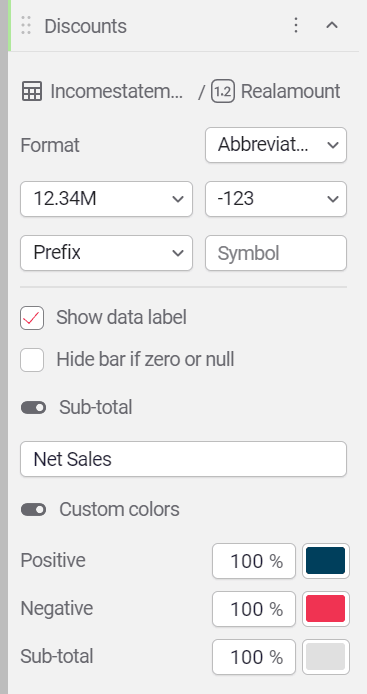
- Hide bar if zero or null: leave the measure’s bar out of the chart when it has no value or its value is zero.
- Sub-total: add a bar after the measure showing the running total up to and including it. Enter a label for the sub-total bar; without one, it is labelled Sub-Total.
- Custom colors: give the measure its own colors, overriding the chart’s color settings.
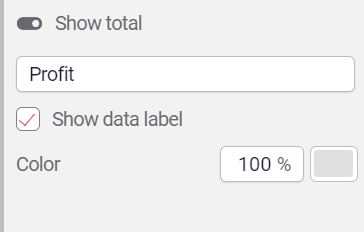
Show total adds a bar after the last measure with the running total of all the measures. Enter a label for it; without one, it is labelled Total. The total bar takes its number format from the last measure in the chart.
Style a Waterfall Chart
Section titled “Style a Waterfall Chart”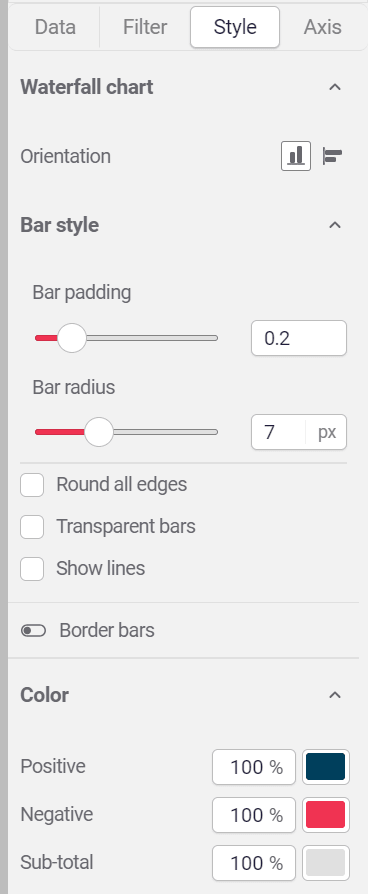
- Orientation: horizontal or vertical.
- Bar padding: the space between the bars.
- Bar radius: how rounded the bar corners are.
- Transparent bars: fill every bar with a gradient that fades from the full color to partly transparent (65% opacity).
- Show lines: draw connecting lines between the bars.
- Color: the colors for all bars. A measure’s Custom colors override them for that measure.
For the other chart types in the classic Workbook Editor, start from Data objects.