

Edward Tufte
Edward Tufte’s approach is graphical integrity and density: show rich data and remove anything that does not carry it. Books: The Visual Display of Quantitative Information (1983) and Envisioning Information (1990).
Use it for analytical pages, reports and comparisons across many items that readers study closely. For other pages, see Choose an expert.
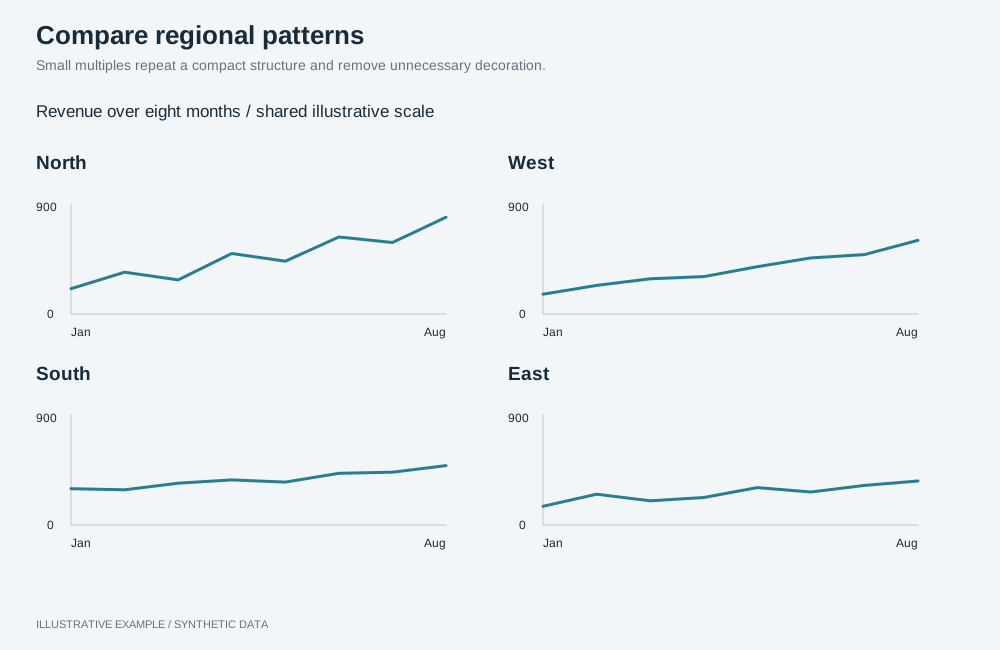
Illustrative example with synthetic data. Small multiples repeat a compact structure and remove unnecessary decoration.
Remove ink that shows no data
Section titled “Remove ink that shows no data”Remove or lighten borders, backgrounds, redundant legends, repeated labels and decoration.
| Check | Operation |
|---|---|
| Axis line and ticks only where they help reading | setShowAxisLine, setShowAxisTicks (bar, line, scatter) |
| No legend when a title or label names the series | setLegendEnabled false (bar, line) |
| No axis title that repeats the chart title | setShowAxisTitle with showAxisName: false (bar) |
| Light table dividers | setTableColumnBorders showHorizontal (table) |
| No image or shadow behind text | Leave setTextBackgroundImage and setTextObjectShadow unset (text object) |
| No heavy card chrome | Panel backgrounds, borders and shadows |
Keep the scale honest
Section titled “Keep the scale honest”A shown effect should be the size of the effect in the data.
- A bar encodes its value as length, so its axis must include zero. Use the
axis range controls to anchor it at zero.
For table bar mini charts, use
setColumnMiniChartBarYAxisStart0(table). - Do not stack measures with different units; use
setBarChartLayoutgroups(bar). - A line does not encode value as length and need not start at zero.
Use small multiples and sparklines
Section titled “Use small multiples and sparklines”- Small multiples: repeat one chart per item in a card grid, with the same type, measures, operations and size. Check colour assignment across cards as described in Styling and theming.
- Sparklines: set a table column’s
setColumnRepresentationtoline-chartwith a date dimension fromsetColumnMiniChartDimension, and align rows withsetColumnMiniChartUseSameStartDatetrue(table).
Colour
Section titled “Colour”Use one ink colour for data and a second only for what the reader should notice:
setColoringType single with setColoringColor, or setMeasureGraphColor per measure
(bar). See
Colour visualizations with operations.
Chart choices
Section titled “Chart choices”| Prefer | For |
|---|---|
table with sparkline columns |
Many items, each with a value and a trend |
line |
Change over time |
bar |
Comparing categories |
scatter |
Two measures against each other |
dot |
One measure across two dimensions |
| Avoid | Because |
|---|---|
pie, especially donut |
Angles and areas compare less accurately than positions |
Radial gauge |
Much non-data ink for one number |
setLineChartType stacked (line) |
Only the bottom series has a flat baseline |
Pairs with card grid, table-first, long-form and compare layouts, and the Economist and visual essay styles.
Not available
Section titled “Not available”Gridline control, sparklines in running text and a colour for one named category are not available; see App limitations.