

Drill-down
Drill-down shows the next level of detail: sales by category, then by sub-category, then by product. A mark reports a click only as a pending selection, so a chart does not step to the next level by itself; see App limitations. Use one of the patterns below.
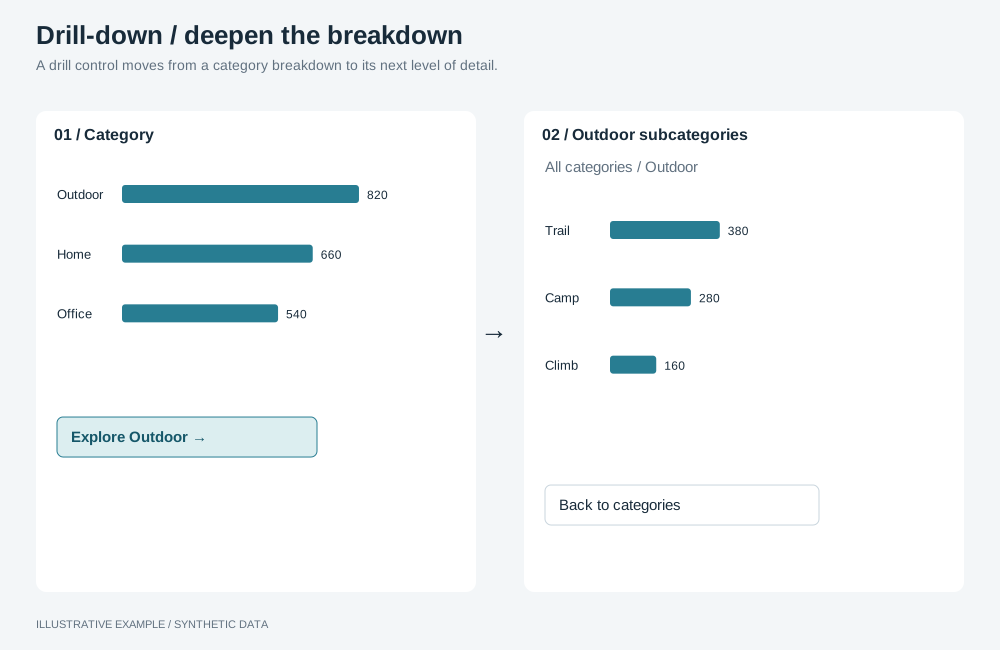
Illustrative example with synthetic data. A drill control moves from a category breakdown to its next level of detail.
Choose a pattern
Section titled “Choose a pattern”| The page needs | Use |
|---|---|
| Readers choose another dimension from the value they clicked | A drill menu cannot replace a mounted chart’s dimension |
| Levels the semantic layer already defines | A drill-down dimension, without a mounted level control |
| Several levels on screen, each filtering the next | The top-down funnel layout: one chart per level in the page’s selection group |
| Several branches of a hierarchy open at once, in rows | An expandable table: structure: 'expandable' in the table definition |
| A hierarchy drawn as one object | The tree or treemap definition, which takes an ordered list of dimensions |
| A date breakdown at year, quarter or month | A date grain control |
| A page of detail for one item | Drill-through |
Build a drill menu
Section titled “Build a drill menu”A menu that filters to a clicked value and replaces a mounted chart’s dimension is not supported:
no chart operation replaces that dimension. A table can change one column with changeColumnField;
see App limitations.
Changes to a mounted visualization must use named runtime operations. Compiling another definition does not make direct replacement of a mounted instance’s vSpec a supported operation. To show several levels, use the top-down funnel layout, with a separate chart for each level and shared selections.
Use a drill-down dimension
Section titled “Use a drill-down dimension”A semantic layer can define a dimension as a group of fields, one per level. When a chart uses that
dimension, the SDK engine replaces it with the active level as it builds each query. The active level
is held by the client’s engine, not by the chart: engine.fields.getGroupedDimensions() returns it
and setGroupedDimensions() changes it; see
The visualization engine service.
In @astrato-io/visualizations 0.5.1, a mounted chart has no level control or named operation to switch
the grouped dimension’s level. Calling setGroupedDimensions() alone does not refresh it. Do not
offer a mounted level switcher; see App limitations.
Change the date grain
Section titled “Change the date grain”Put toggle buttons in the card’s title row, one per grain, and change the chart’s date dimension with
setDimensionTemporalGrouping in
mode: 'level', which keeps buckets year-aware. The operation is published by bar, line and several
other types, not by table; check the type’s operations page.
<div class="chart-tools"> <div class="chart-switch" role="group" aria-label="Orders by"> <button type="button" aria-pressed="true" data-grain="year">Year</button> <button type="button" aria-pressed="false" data-grain="quarter">Quarter</button> <button type="button" aria-pressed="false" data-grain="month">Month</button> </div> <button class="chart-menu" type="button" aria-haspopup="dialog" aria-label="Options for Orders"></button></div>// runtime and availableFields as in Mounting objects. The date dimension's keys come from// compilation.resolvedRefs for its ref; keep them in memory only.declare const dateItem: { dataItemInternalKey: string; dataItemUniqueSignature: string };
const setGrain = (grain: 'year' | 'quarter' | 'month') => applyRuntimeOperations({ runtime, instanceId: 'orders-by-date', availableFields, operationRequests: [ { id: 'grain', name: 'setDimensionTemporalGrouping', payload: { ...dateItem, mode: 'level', dateLevel: grain } }, ], });Check each result as in Check operation results, and set
aria-pressed back if it failed. The grain is app state, not a selection.
.chart-tools places the controls in the card’s title row, beside the menu. It is shared with the
chart switcher, which also styles .chart-switch.
/* The tools take the menu's cell: right column, title and subtitle rows. */.chart-tools { grid-area: 1 / 2 / 3 / 3; display: flex; align-items: center; gap: 4px;}.chart-tools .chart-switch > button { width: auto; padding: 0 8px;}