
Getting started with the Semantic Layer Editor
Using the Semantic Layer Editor
Section titled “Using the Semantic Layer Editor”Once you’ve added your data connection and selected your tables, use the Semantic Layer Editor (SLE) to create new semantic layers and edit semantic layer properties, including setting up joins and creating custom fields and measures. The SLE is visible when you:
-
Connect a new data source or semantic layer.
-
Click on the icon that looks like a connector in the sidebar of the Data section.
-
Click on the name of your data at the top left when you’re in the Workbook Editor. A tooltip displays ‘Go to the Semantic Layer.’
Please note: joins aren’t available for Google Sheets.
-
Introducing the Semantic Layer Editor
-
Set Engine Associative Filter
-
Adding customized data
-
Dimensions and Measures
Data section options
Section titled “Data section options”The narrow rail on the left of the editor holds:
-
The Astrato logo, which takes you back to the Home view.
-
Nash AI, which opens the AI assistant beside the editor.
-
Manage access (the people icon, near the bottom), which opens the list of users and groups who can use the semantic layer.
-
Support, to contact the Astrato team.
-
Help (the question mark), which opens Astrato’s help documentation (these pages).
The semantic layer’s own settings, such as its default formats and time zone, are on the Settings tab at the right of the tab bar rather than in the rail.
Navigating in the SLE
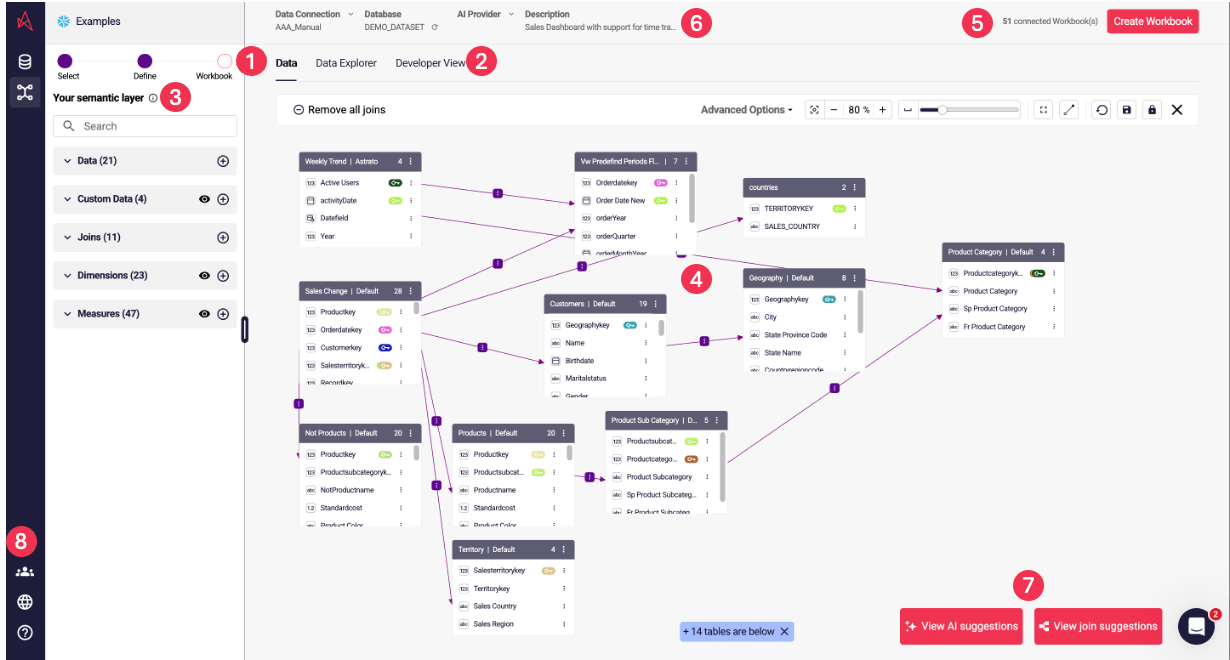
Section titled “Navigating in the SLE”The screenshot below shows an earlier version of the editor, which had a step tracker and a single row of tabs. The numbered list describes the editor as it is now.
-
The header shows the semantic layer name (click it to rename the layer), its data connection, its Database and its Description (click to edit).
-
The tab bar groups the editor’s tabs. On its right, Documentation, Dev (the semantic layer as code, in YAML or JSON) and Settings each open a whole page.
-
The SLE’s functions to define your semantic layers are separated into groups: Semantic Model, Business Context and Data Explorer, plus Evaluations (beside Dev) where it’s enabled. Use these options to create customized data queries, fields, dimensions, and measures.
-
The content area shows the tab you pick in each group. The Semantic Model group has Map View, Tables & Fields, Joins and UDFs; Business Context includes Measures and Dimensions. Tables & Fields lists the tables and fields in the layer. To see sample rows, click Data Preview in the Map View toolbar, or query the layer in Data Explorer.
-
The top right shows how many items (workbooks, and where available data apps and pinboards) are linked to the layer, with Open when there are any, and Create, or Back to Workbook when you opened the editor from a workbook.
-
Click the data connection name in the header to switch the semantic layer to another data connection.
-
Suggestions in the Map View toolbar proposes measures, dimensions and joins for the layer, and Nash AI in the left rail opens the AI assistant.
-
Manage access in the left rail controls who can use the semantic layer, and the Settings tab sets its default formats.
Back to Top
Selecting your data
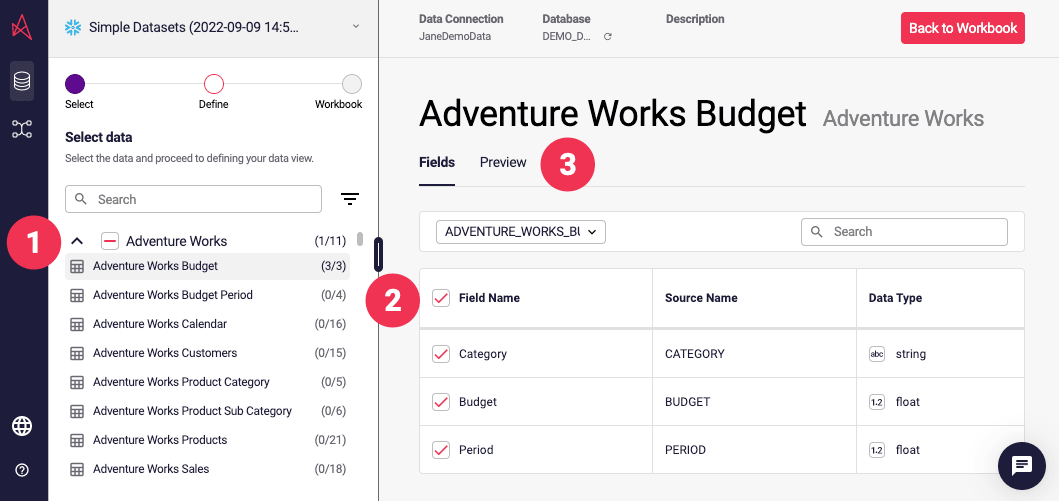
Section titled “Selecting your data”You choose the data for your semantic layer in Map View, from the Tables & Views panel. The screenshot below shows the earlier Select screen, which this panel replaces.
-
In Map View, click Add and choose Tables & Views. The panel lists the schemas in the connection’s database; if the connection has several databases, pick one from the selector at the top of the panel.
-
Use the search box (Search schemas & opened tables…) to find what you need. Expand a schema to see its tables.
-
Tick the checkbox beside a table to add it with all its fields, or tick the checkbox beside a schema to add every table in it. Clear a checkbox to remove the table from the model.
-
Open the Tables & Fields tab to see the tables and fields now in the layer, and click Data Preview in the Map View toolbar to see sample rows.
You’re now ready to define and customize your data model.
Back to Top
Managing Users Access
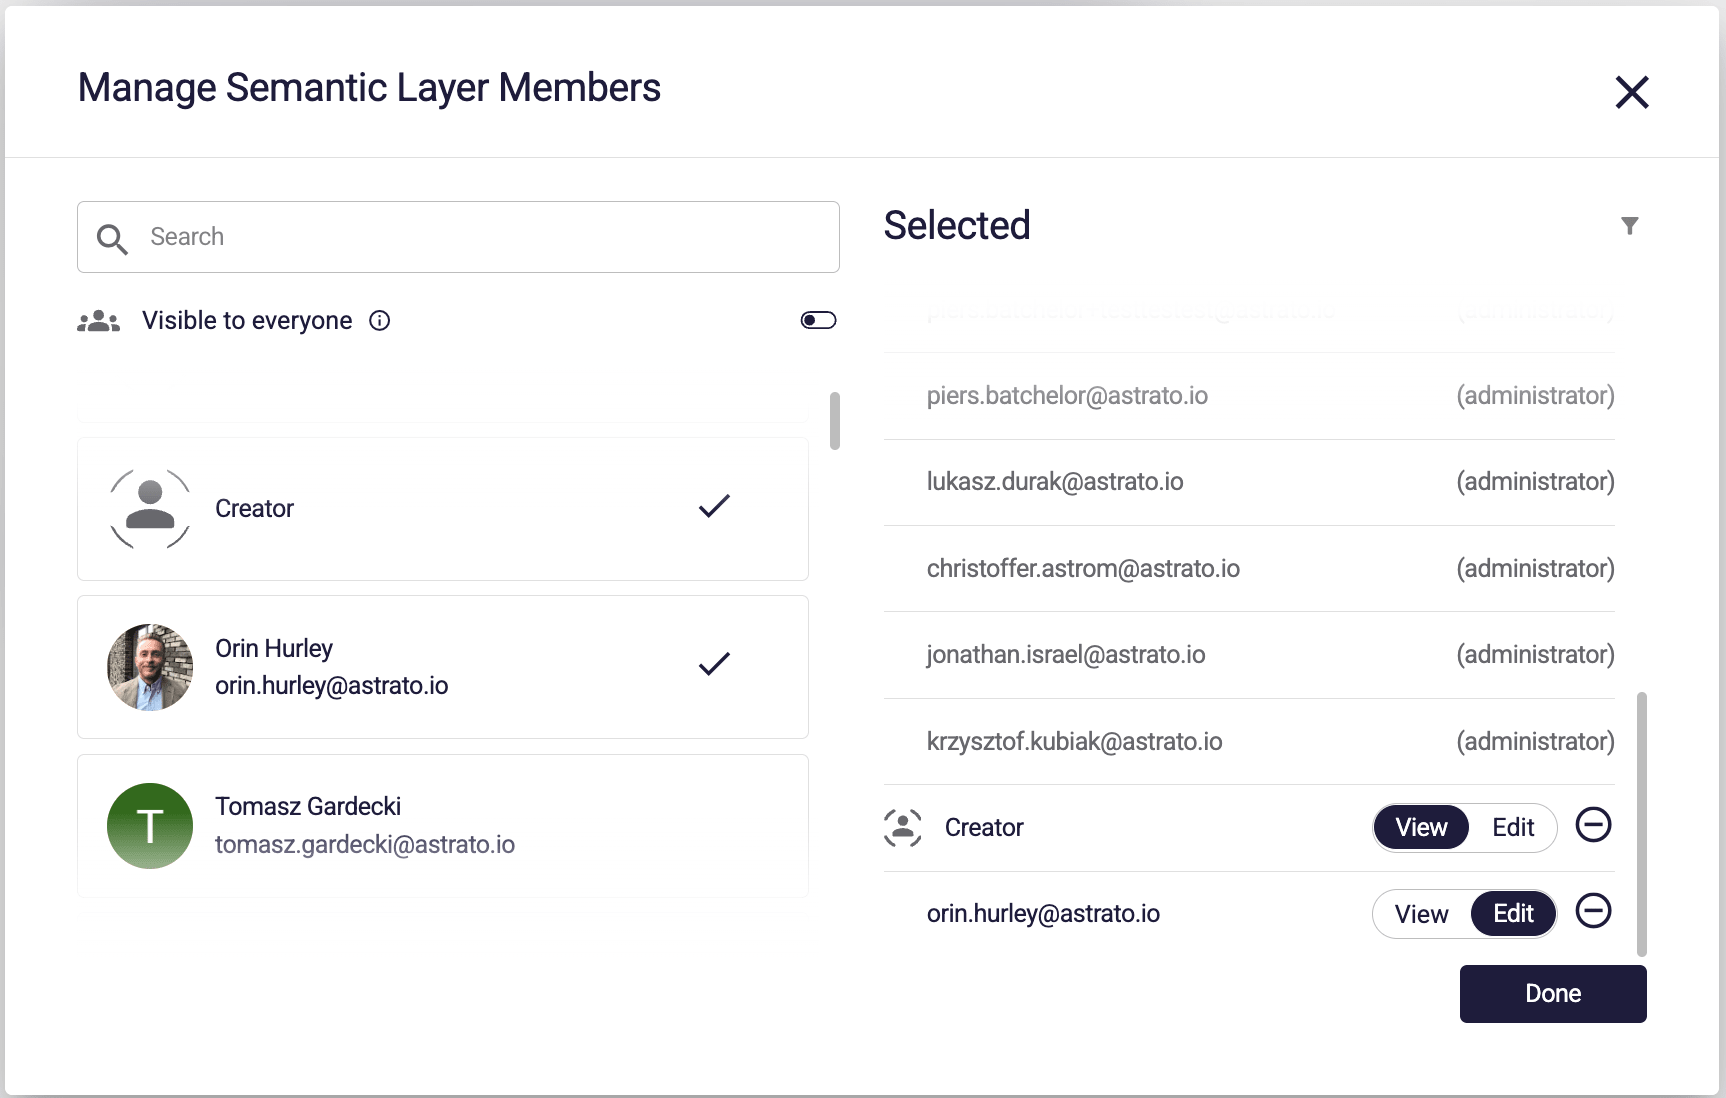
Section titled “Managing Users Access”Click Manage access (the people icon) near the bottom of the left rail.
In the panel that opens on the right, manage which roles and users have access to the semantic layer. Click Manage access again to close it. The screenshot shows the earlier dialog version of this list.
Setting Default Formats
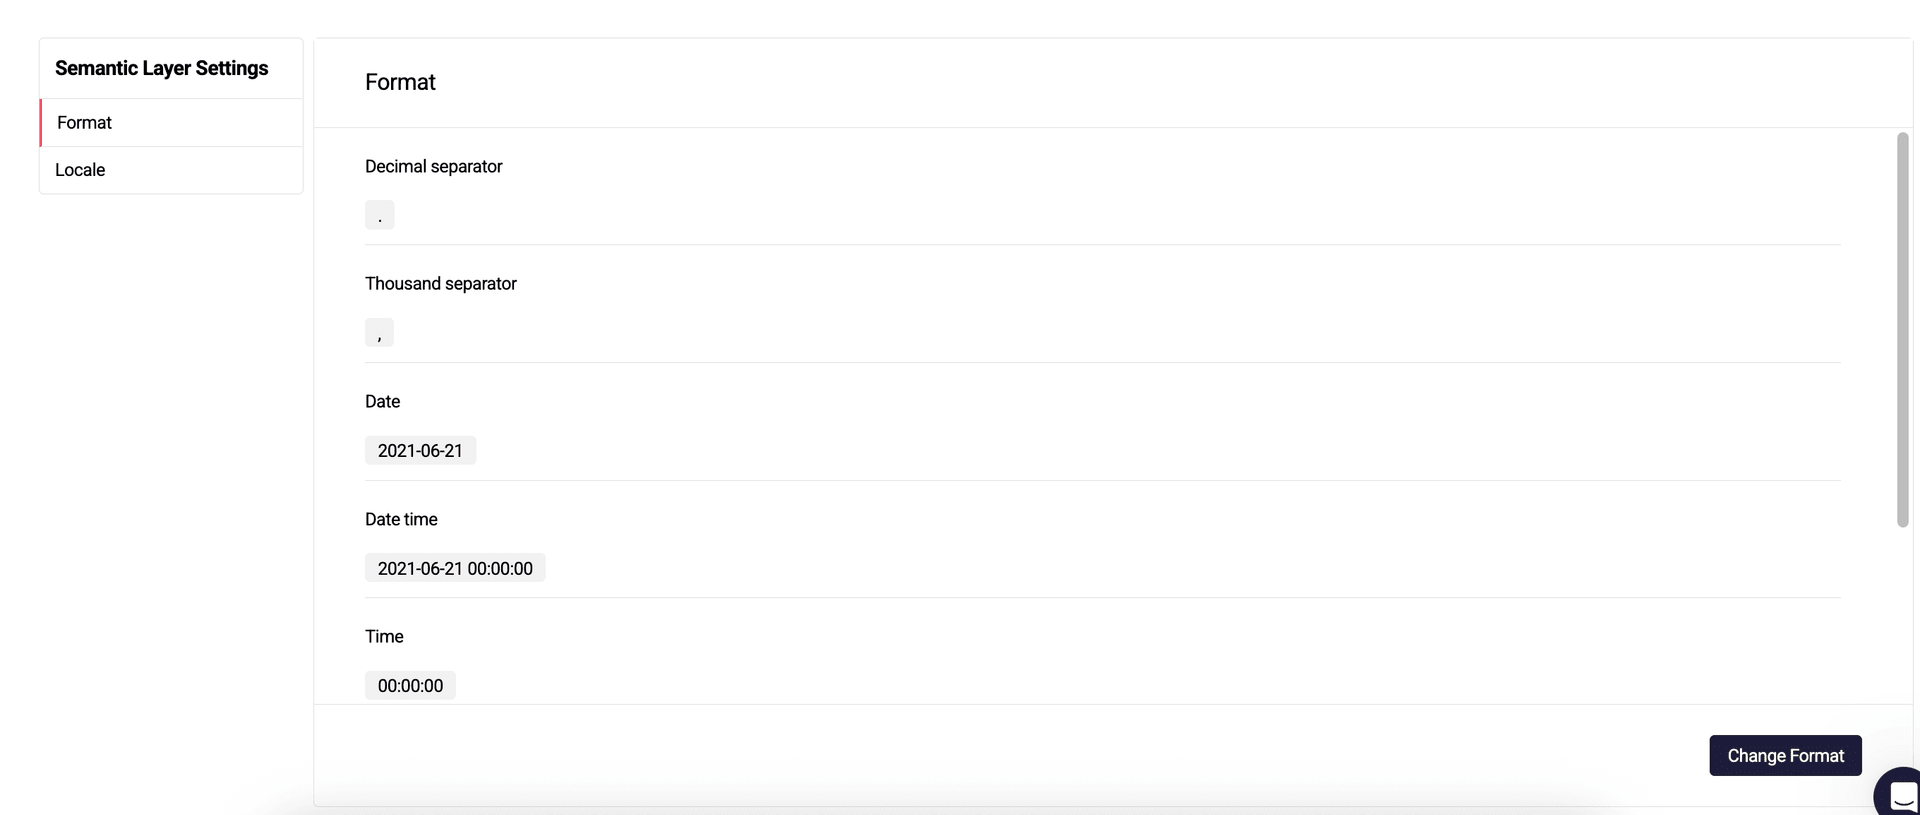
Section titled “Setting Default Formats”Click the Settings tab at the right of the tab bar.
In the Format section, set the Decimal separator, Thousand separator and the default Date, Date time, Time, Number, Integer and Money formats. In the Locale section, choose the Timezone. Changes save as you make them. The screenshot shows the earlier settings dialog.
Click any other tab, such as Map View, to return to editing your data.
Set Engine Associative Filters
Section titled “Set Engine Associative Filters”Engine associative filters are applied when multiple fact tables are present.
When a filter is applied to one of the fact tables using a common dimension table, it is automatically applied to the other table.
This is how you enable or disable the engine associative filters.
Click the Settings tab at the right of the tab bar.
In the General section, tick or clear Enable auto associative filters. The screenshot shows the same option in the earlier settings dialog.

Click any other tab, such as Map View, to return to editing your data.
Defining and customizing data
Section titled “Defining and customizing data”You model your data in the Semantic Model group: Map View draws the tables and the joins between them, Tables & Fields lists every table and field, and Joins lists the joins. Measures and dimensions live in the Business Context group.
Building your data model
Section titled “Building your data model”In Map View, you’ll see the tables in your semantic layer and the joins between them. Joins connect related data in different tables in a database or semantic layer. An example would be a table holding information about customers and a table containing details of the orders customers have placed. If you add a join, you’ll be able to add data from both tables to your workbook.
-
Click on a table to open its properties in the panel on the right, including its fields.
-
If you need to change a field’s name, click the field to open its editor, and check your results using Data Preview in the Map View toolbar.
-
If you’d like to add more data from the data source, click Add and choose Tables & Views.
-
To add a join yourself, click Add and choose Join.
-
In the Tables & Views panel, open the menu beside a field and choose Add as dimension or Add as measure. Once it’s created, you’ll find it on the Dimensions or Measures tab.
-
Click Suggestions in the Map View toolbar to see suggested measures, dimensions and joins, and accept the ones you want. You can edit or delete joins on the Joins tab.
Back to Top
Adding Custom data
Section titled “Adding Custom data”-
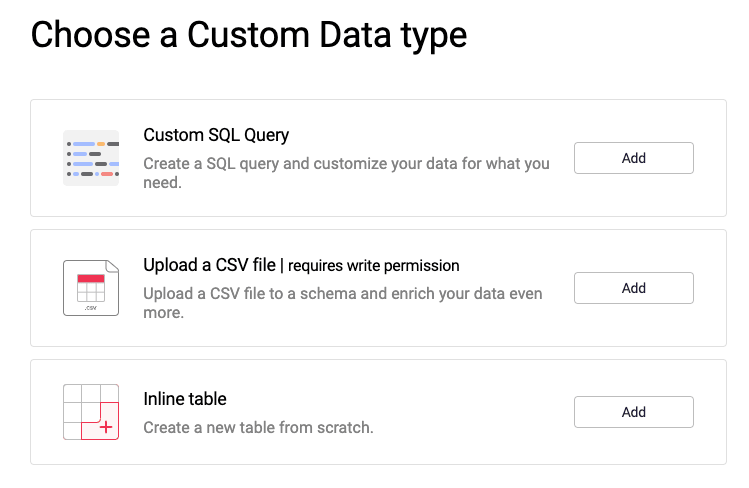
In Map View, click Add. Under Data, the menu offers Upload a CSV file, Custom SQL Query and Inline table. (On the Tables & Fields tab, Add offers Custom SQL Query and Inline table.)
-
Choose the type of custom data and follow the steps below. Custom SQL Query is not offered for connections with no SQL engine, such as Google Sheets.
The screenshot shows the earlier Custom Data dialog, which these menu items replace.
Adding a custom SQL query
Section titled “Adding a custom SQL query”-
Click Add and choose Custom SQL Query. A new table opens in the panel on the right.
-
Give the table a name by clicking its title at the top of the panel.
-
Enter the statement in the Custom SQL box. It should be a SELECT statement.
-
Click Validate SQL to check that it runs, and Run SQL preview to see its first rows.
-
Click Create to add the table to the semantic layer.
ℹ To support time travel, please add {TT} after each table name
Example of a simple Calendar table using the Min and Max of an existing date field from the table ADVERTISING_CHANNEL in the schema FUNNEL_IO using Snowflake syntax.
WITH RECURSIVE date_range AS ( SELECT MIN(DATE) AS start_date, MAX(DATE) AS end_date FROM FUNNEL_IO.ADVERTISING_CHANNEL {TT}),recursive_dates (DATE) AS ( SELECT start_date FROM date_range UNION ALL SELECT DATEADD(day, 1, DATE) FROM recursive_dates WHERE DATE < (SELECT end_date FROM date_range))SELECT DATE AS "Date", TO_CHAR(DATE, 'YYYY-MM-DD') AS "Date ISO", YEAR(DATE) AS "Year", MONTH(DATE) AS "Month of Year", TO_CHAR(DATE, 'MMMM') AS "Month", DAY(DATE) AS "Day of Month", DAYOFYEAR(DATE) AS "Day of Year", WEEK(DATE) AS "Week", DAYOFWEEK(DATE) AS "Day of Week", DAYNAME(DATE) AS "Day"FROM recursive_datesExample of a simple Option table using inline values using Snowflake syntax.
SELECT *FROM VALUES (1, 'Virtual meeting', 'Meetings conducted over digital platforms.'), (2, 'In-person', 'Face-to-face meetings.'), (3, 'Email', 'Communications sent via email.')AS Meeting_Type("Id", "Option", "Description")Uploading a CSV file
Section titled “Uploading a CSV file”This feature stores a copy of the CSV directly in your data warehouse. As such, it must be enabled on both your organization and individual warehouse connection by an organization admin.
The permission requirements are:
If you don’t have a specific schema, you wish users to upload their data, then grant the following privileges to the role:
Create SchemaIf you do have a dedicated schema created for CSV uploads, then grant the following privileges to the role:
Create TableFor more information on how to set privileges in ❄️_Snowflake, please check out their documentation:_
https://docs.snowflake.com/en/sql-reference/sql/grant-privilege.html
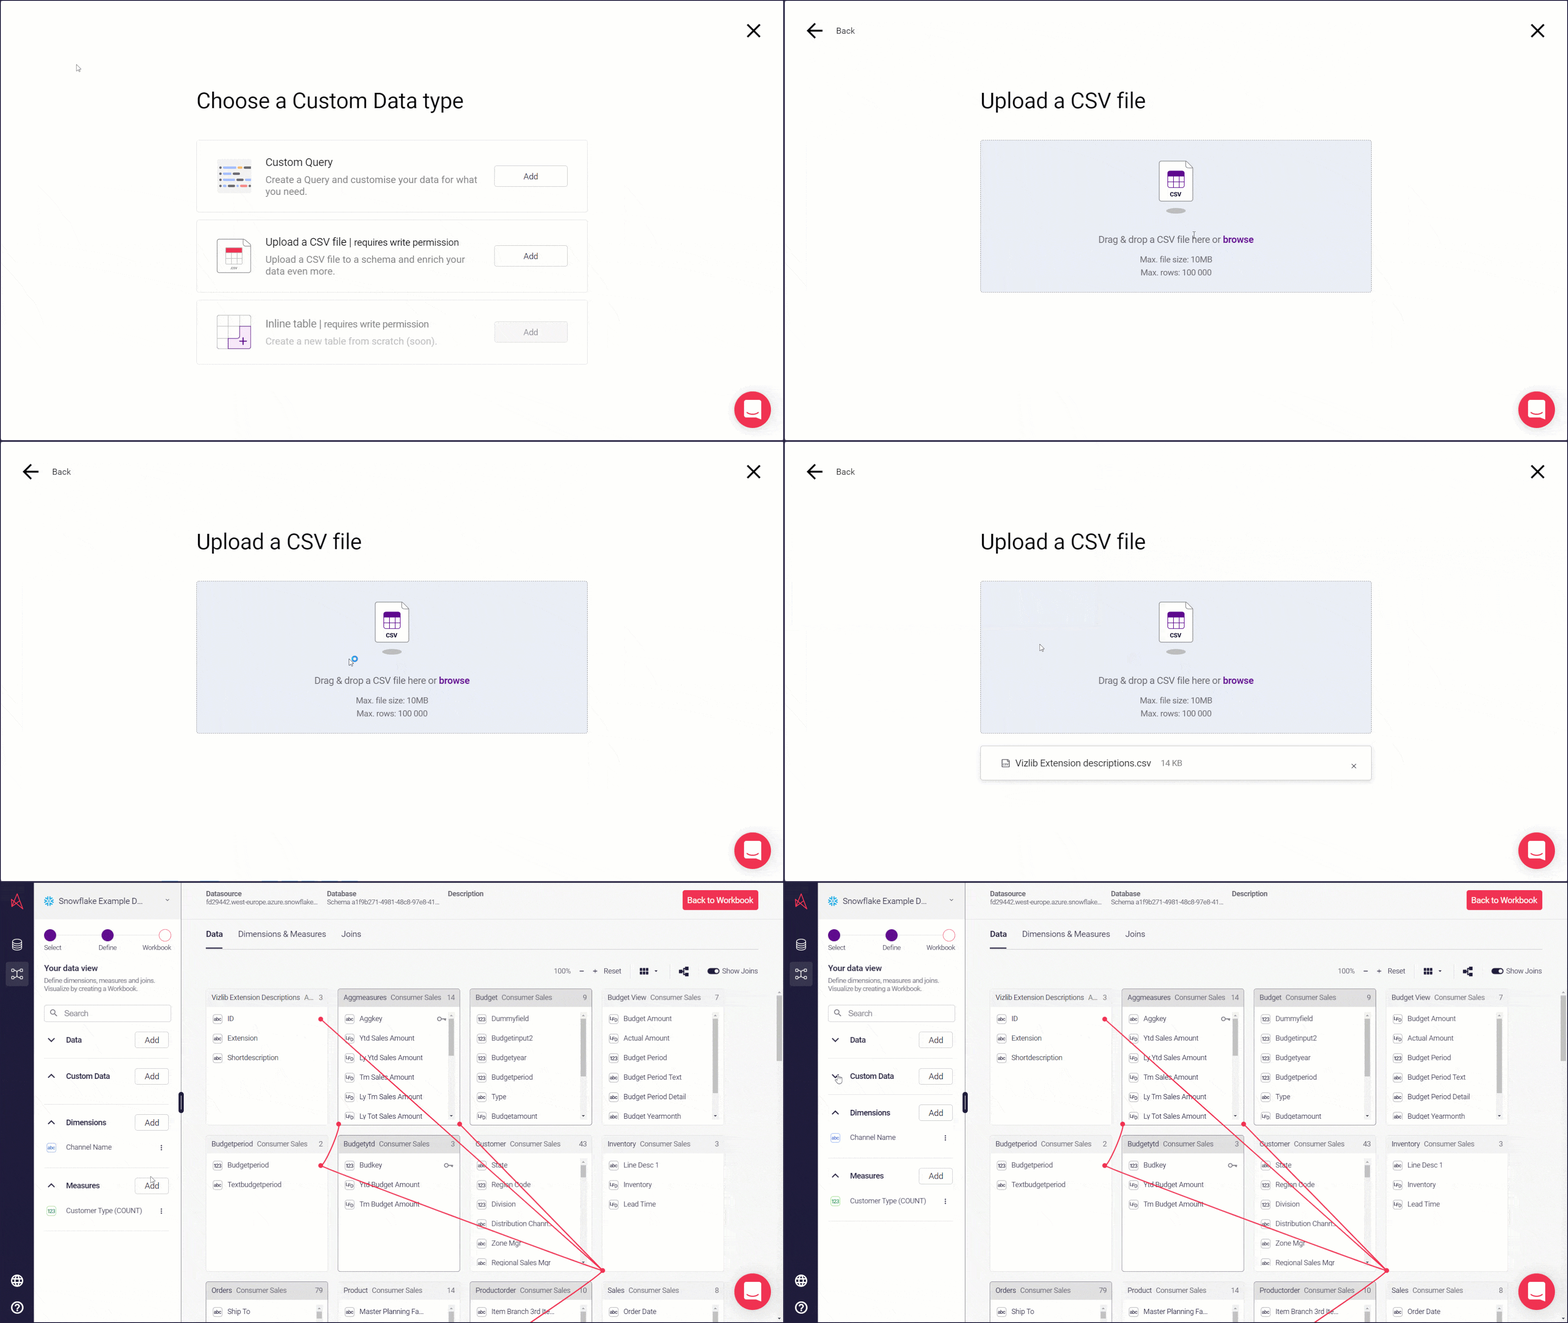
Once permissions are sorted, the steps to upload a CSV file are:
-
In Map View, click Add and choose Upload a CSV file.
-
Drag and drop the CSV file you want to use onto the dialog, or click browse to pick it with the file explorer.
-
Check the Table name, and tick or clear Set the first row as the header. In the preview, clear the checkbox above any column you don’t want and adjust each column’s data type.
-
Click Save. The CSV is uploaded and added to the semantic layer as a new table.
The animation below shows the earlier version of this dialog.
Back to Top
Dimensions & Measures
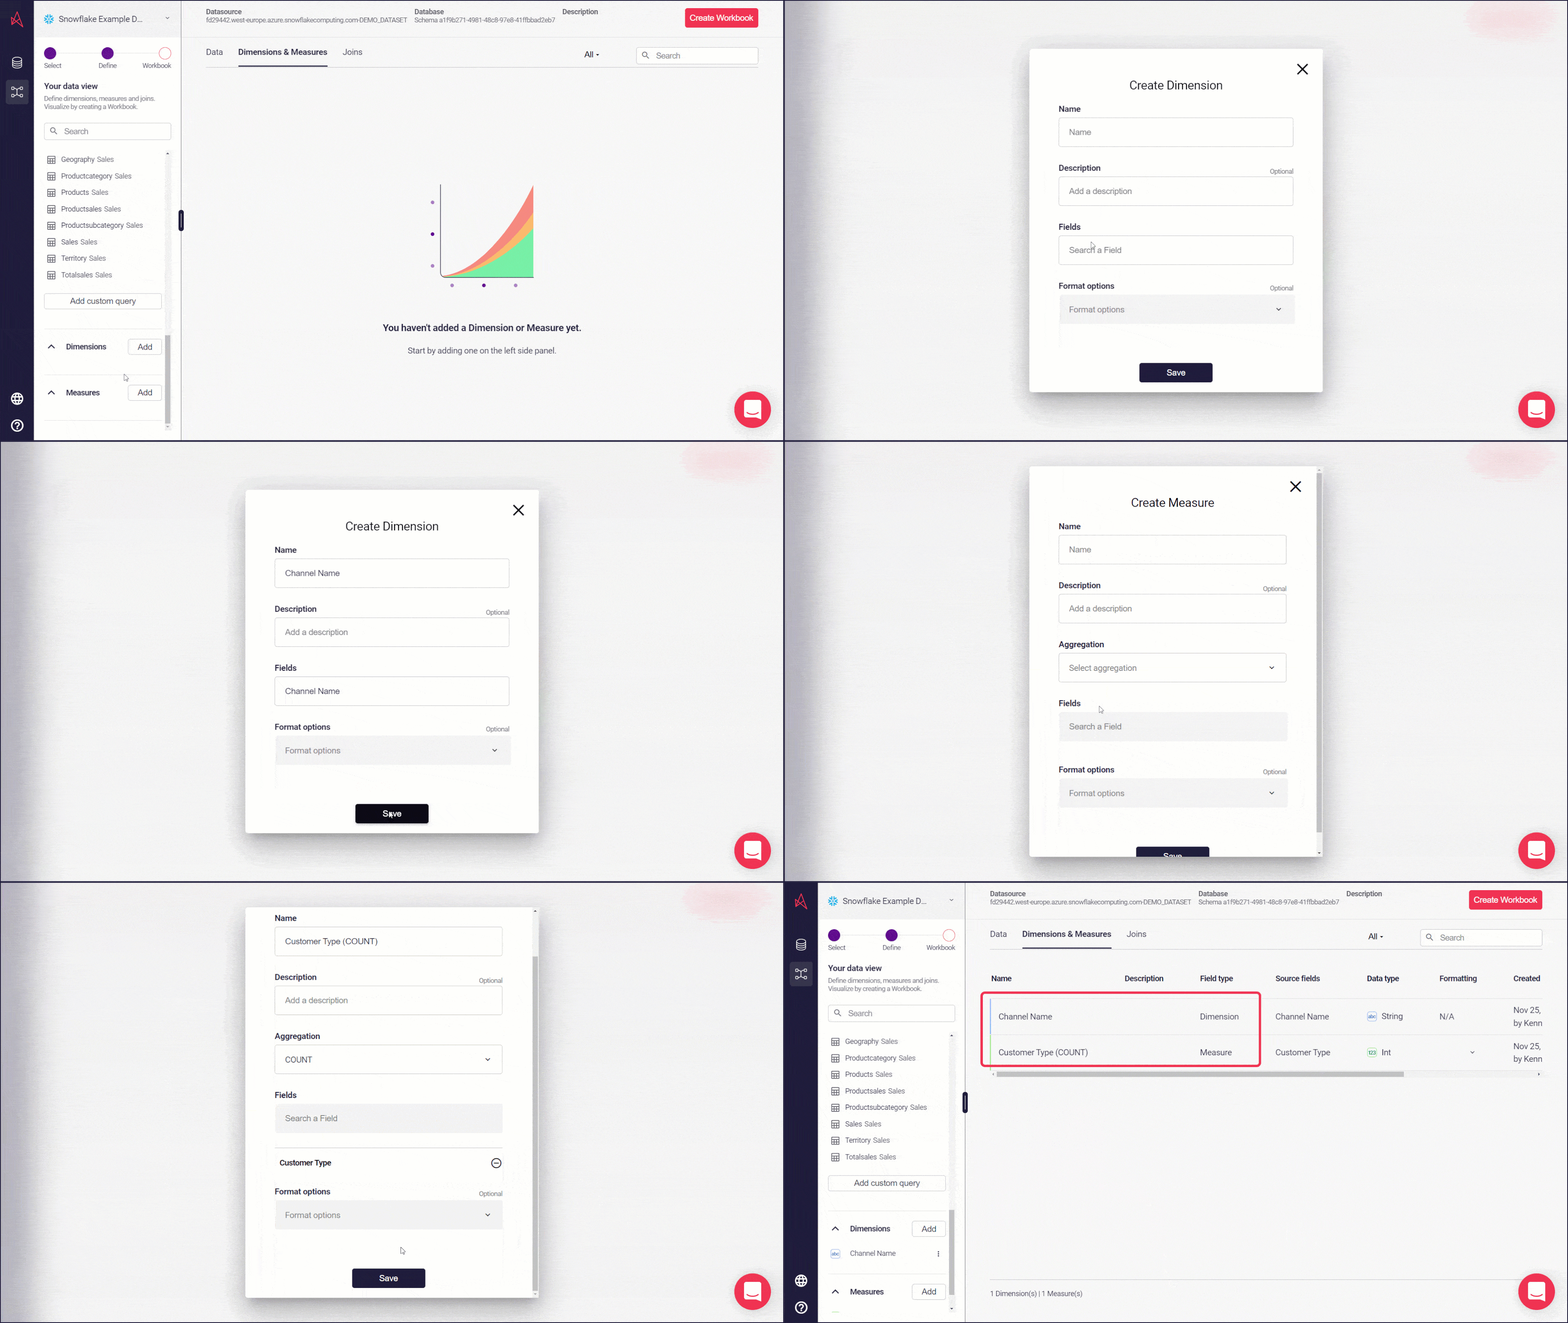
Section titled “Dimensions & Measures”Dimensions and measures are on their own tabs in the Business Context group. To add one, open the Dimensions or Measures tab and click Add.
-
For dimensions, choose the kind you want, such as Field dimension (one field, as it is), Drill-through, Bucket or Custom groups, then pick the field and give it a Name. You can also add a Description.
-
For measures, choose the kind you want, such as Standard measure or Calculated measure. For a standard measure, pick the field and its Aggregation, give it a name and, if you like, a Description. Click Create when you’re finished.
-
You’ll find any dimensions and measures you’ve added listed on their tab. Click one to open it in the panel on the right, where you can edit or remove it.
The animation below shows the earlier editor.
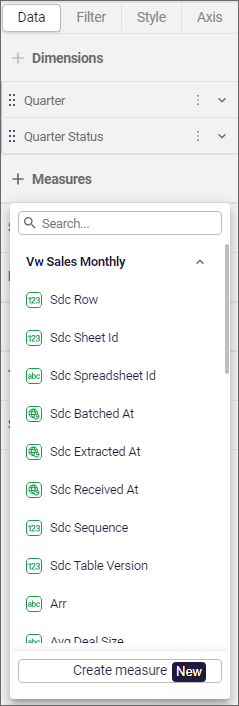
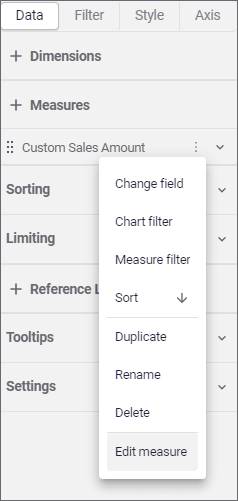
In the workbook, you can also create and update measures in the properties panel for each object using measures. Measures added here, will also be visible in the current semantic layer.
Creating a measure in the workbook | Editing a measure in the workbook |
 |  |
Back to Top